Abstract
Free radicals generated by oxidative stress cause damage that can contribute to numerous chronic diseases. Mammalian cells respond to this damage by increased transcription of cytoprotective phase II genes, which are regulated by NRF2. Previously, it has been shown that NRF2 protein levels increase after oxidative stress because its negative regulator, KEAP1, loses its ability to bind NRF2 and cause its proteasome-mediated degradation during oxidative stress. Here, we show that CRIF1, a protein previously known as cell cycle regulator and transcription cofactor, is also able to negatively regulate NRF2 protein stability. However, in contrast to KEAP1, which regulates NRF2 stability only under normal reducing conditions, CRIF1 regulates NRF2 stability and its target gene expression under both reducing and oxidative stress conditions. Thus, CRIF1-NRF2 interactions and their consequences are redox-independent. In addition, we found that CRIF1, unlike KEAP1 (which only interacts with N-terminal region of NRF2), physically interacts with both N- and C-terminal regions of NRF2 and promotes NRF2 ubiquitination and subsequent proteasome-mediated NRF2 protein degradation.
Keywords: Oxidative Stress, Protein Stability, Protein-Protein Interactions, Transcription Regulation, Ubiquitination, CRIF1, KEAP1, NRF2
Introduction
Oxidative stress leads to the accelerated production and increased accumulation of reactive oxygen species (ROS),2 which contribute to both cancer and aging by causing oxidative damage to proteins and DNA (1). NF-E2-related factor 2 (NRF2), a short lived transcription factor, plays a major role in protecting cells from these and other kinds of damages by regulating transcription of multiple genes encoding cytoprotective enzymes such as glutathione S-transferases and oxidoreductases that have antioxidant functions. NRF2 has been shown to be a key factor in protecting lung and liver against a range of toxic xenobiotic chemicals, including acetaminophen, butylated hydroxytoluene, and diesel exhaust (2–7).
KEAP1 is part of a multiprotein complex that contains the CUL3-ROC1 ubiquitin ligase (8–11), which can ubiquitinate the N-terminal domain of NRF2. Two molecules of KEAP1 bind to two distinct sites in the N-terminal region of NRF2, the ETGE and DLG sites, which affect the KEAP1-NRF2 interaction and/or its physiological consequences (12–14).
Under conditions of oxidative stress, KEAP1 loses its ability to limit NRF2 protein accumulation and to block NRF2 from transcribing its target genes. This occurs because oxidative stress/oxidative stress-generated ROS oxidize a Cys–Cys covalent bond, which causes a conformational change in KEAP1, enabling NRF2 to escape from the imposed cytoplasmic localization, ubiquitination, and degradation of KEAP1. Once translocated to the nucleus, NRF2 forms heterodimers with other transcriptional regulators such as c-Jun, JunB/D, ATF2/4, or MAF F/G/K (15–17).
Because only small numbers of NRF2-interacting proteins regulate its stability and transcription activity, it is important to identify other interacting proteins. Interestingly, through yeast two-hybrid assay systems using CR6-interacting factor 1 (CRIF1, initially identified as GADD45 family protein-associating factor; see Ref. 18) as a bait, we identified CRIF1 as an NRF2-interacting protein. Originally, CRIF1 was discovered as a cell cycle and growth regulator (18); however, another possible role for CRIF1 as a transcriptional cofactor has been proposed (19–22). So far, several nuclear receptors, including NUR77 (19), androgen receptor (20), STAT3 (21), and ELF3 (22), are known to interact physically and functionally with CRIF1. Here, we are presenting the data suggesting CRIF1 as a new negative regular for NRF2.
EXPERIMENTAL PROCEDURES
Cell Culture and Reagents
All cell lines, MCF-7, HEK293, COS-1, and DU145, used for this study were obtained from ATCC and were cultured as recommended. ALLN, MG132, and epoxomicin were from Peptides International (Louisville, KY), and clasto-lactacystin β-lactone (CLβL) was from Cayman Chemical Co. (Ann Arbor, MI). (RS)-Sulforaphane (SFN) was from LKT Laboratories, Inc. (St. Paul, MN). Hydrogen peroxide (H2O2) was purchased from Acros Organics (Morris Plains, NJ), and paraquat was obtained from Chem Service, Inc. (West Chester, PA). Cycloheximide, tert-butylhydroquinone (t-BHQ), and other chemicals were obtained from Sigma.
CRIF1 Monoclonal Antibody Production
Monoclonal antibodies (mAbs) to human CRIF1 protein were prepared by ProMab Biotechnologies (Albany, CA). A full-length CRIF1 protein was injected intraperitoneally into BALB/c mice. Spleen cells from mice immunized with the CRIF1 protein were fused with Sp2/0-Ag14 myeloma cells, grown in hybridoma culture media, and then screened by enzyme-linked immunosorbent assays.
Yeast Two-hybrid and cDNA Library Screening
The yeast strain Y190 (Clontech) was transformed with pAS-CRIF1 and a Matchmaker two-hybrid cDNA (in pACT2 vector) library from K-562 cells (Clontech). Positive transformants were selected as described in our previous studies (19, 23).
Construction of NRF2 Mutants
Three NRF2 deletion mutants were constructed by amplifying fragments of wild-type, full-length FLAG-NRF2 by PCR using the following primers: aa 1–100, forward 5′-gga tcc acc atg atg gac ttg gag-3′ and reverse 5′-act cga gcg ggc aga tcc act ggt-3′; aa 101–434, forward 5′-gga tcc acc atg aac tac tcc cag gtt-3′ and reverse 5′-act cga gcg agg act tac agg caa-3′; and aa 435–605, forward 5′-gga tcc acc atg ggt cat cgg aaa acc-3′ and reverse 5′-act cga gcg gtt ttt ctt aac atc-3′. To construct NRF2 bZIP domain deletion mutants (see supplemental Fig. S2 for schematic mappings), we used the following primers: forward primer (for all the bZIP deletion mutants) 5′-gga tcc acc aac tac tcc cag gtt-3′ and reverse primer 5′-act cga gcg agg act tac agg caa-3′ (for aa 101–434); 5′-act cga gcg gga cat cat ttc gtt-3′ (for 101–486); 5′-act cga gcg atc ccg aat taa tgc-3′ (for aa 101–500); 5′-act cga gcg ttg ctc tag ttc tac-3′ (for aa 101–527); 5′-act cga gcg tcc ttt ttc ttt gag c-3′ (for aa 101–544); 5′-act cga gcg acg tag cat gct gaa-3′ (for aa 101–569); 5′-act cga gcg ttg ctg cag gga gta-3′ (for aa 101–585); and 5′-act cga gcg gtt ttt ctt aac atc-3′ (for aa 101–605). The PCR products were inserted into pCR®2.1 TOPO® vector (Invitrogen) and then subcloned into the BamHI/XhoI sites of the pCDNA3.1B-His-V5 expression vector (Invitrogen). Four lysine-to-four arginine substitution mutations in both the His-V5-NRF2 aa 1–100 protein fragment (specifically aa 50, 52, 53, and 56) and in the His-V5-NRF2 aa 101–605 protein fragment (specifically aa 536, 538, 541 and 543) were constructed by using QuikChange XL site-directed mutagenesis kit (Stratagene, La Jolla, CA).
Immunoprecipitations (IP), Western Blot (WB), and in Vivo Ubiquitination Assay
The same lysis buffer was used for both WB analysis and IP experiments as we reported previously (24). For IP experiments, normal mouse IgG (the negative control), FLAG beads (EZviewTM Red ANTI-FLAG® M2 Affinity Gel, Sigma), His beads (EZviewTM Red HIS-Select® HC Nickel Affinity Gel, Sigma), or anti-GFP antibody (Abcam Inc., Cambridge, MA) was used. The following antibodies were used for WB analysis: anti-NRF2 (H-300, Santa Cruz Biotechnology, Santa Cruz, CA), anti-CRIF1 (mouse monoclonal), anti-FLAG (M2, Sigma), anti-GFP (Abcam Inc., Cambridge, MA), anti-HA (12CA5, Roche Applied Science), anti-HO-1 (Hsp32, StressGen, Ann Arbor, MI), anti-KEAP1 (Proteintech Group Inc., Chicago), anti-V5 (Invitrogen), anti-β-actin (Sigma), anti-α/β-tubulin (Cell Signaling Technology, Inc., Boston), and anti-lamin B1 (Abcam Inc., Cambridge, MA). For the in vivo ubiquitination assay, lysates from COS-1 or MCF-7 cells were transfected with expression vectors, prepared by IP, and analyzed by our standard WB analysis using anti-ubiquitin (Biomeda, Foster City, CA) or anti-HA (2CA5, Roche Applied Science) antibodies.
Immunocytochemistry
Cells (DU-145) were seeded on poly-d-lysine-coated coverslips (BD Biosciences) in 12-well plates and treated with 100 μm t-BHQ for 30 or 60 min. Cells were fixed with 4% paraformaldehyde and permeabilized with 0.1% Triton X-100. Fixed cells were incubated with a 1:200 dilution of anti-CRIF1 mouse monoclonal antibody and anti-NRF2 antibody in phosphate-buffered saline containing 0.5% bovine serum albumin overnight at 4 °C. Coverslips were washed with phosphate-buffered saline and incubated with Alexa Fluor® 546 goat anti-rabbit IgG (Invitrogen) for NRF2 and Alexa Fluor® 488 goat anti-mouse IgG (Invitrogen) for CRIF1 at a 1:500 dilution in phosphate-buffered saline containing 0.5% bovine serum albumin for 1 h. Following secondary antibody incubation, cells were incubated with 4′,6-diamidino-2-phenylindole to stain the nuclei. Coverslips were washed and mounted on glass slides in mounting medium for fluorescence (Vector Laboratories, Inc., Burlingame, CA). Images were obtained using an Olympus laser confocal microscope at Georgetown University Core Facilities.
Preparation of in Vitro Labeled NRF2 and CRIF1
An in vitro coupled transcription and translation (IVT) kit (TnT T7 coupled reticulocyte lysate system, Promega, Madison, WI) was used as described previously (25).
Reporter Gene Assay
Cell culture, seeding, and DNA plasmid transfection were performed similarly to our previous reports (24, 25). All luciferase activity differences in transfection efficiencies were corrected for by co-transfections with an expression vector encoding β-galactosidase and measuring β-galactosidase activity.
Transfection of siRNA
100 nm of four different CRIF1-specific siRNAs (3, 4, 263, or 379) or control (scrambled) siRNAs were transfected into cells using Lipofectamine 2000 (Invitrogen). The CRIF1-siRNA-3 sequence was 5′-gct acg cgg cta agc agt t-3′, and CRIF1-siRNA-4 sequence was 5′-cta cgc ggc taa gca gtt c-3′. The sequence of CRIF1-siRNA-263 or -379 has been described elsewhere (18).
Quantitative Real Time PCR
Quantitative real time PCR was performed as described previously (25). The following primer sequences were used: HO-1 forward and reverse primers 5′-agg tca tcc cct aca cac ca-3′ and 5′-tgt tgg gga agg tga aga ag-3′; GSTa2 forward and reverse primers 5′-ggc tgc agc tgg agt aga gt-3′ and 5′-aag gca ggg aag tag cga tt-3′; GCLC forward and reverse primers 5′-ctg ggg agt gat ttc tgc at-3′ and 5′-agg agg ggg ctt aaa tct ca-3′; glyceraldehyde-3-phosphate dehydrogenase forward and reverse primers 5′-gta tga caa cga att tgg cta cag-3′ and 5′-agc aca ggg tac ttt att gat ggt-3′.
Subcellular Fractionation
Cytosol and nuclear fractionation was done as described in our previous study (24). We used antibodies against α/β-tubulin and lamin B1 as indicators for the purity of the cytosol and nuclear fractions, respectively.
Chromatin Immunoprecipitation (ChIP) Assay
A ChIP assay kit (Upstate Biotechnology, Billerica, MA) was performed as described previously in our studies (24). Immunoprecipitated complexes were collected on protein A/G beads and then eluted with 250 μl of elution buffer and used as templates for PCR. The published primer sequences were used to amplify ARE or non-ARE-containing regions of the HO-1 promoter/enhancer (26).
TransAMTM NRF2 DNA Binding Assay
Total cell lysates harvested from the cells treated with 5 μm SFN were used to prepare nuclear extracts as described above. For DNA binding assays, we used the TransAM NRF2 assay kit (Active Motif, Carlsbad, CA), and assays were performed according to the manufacturer's protocol.
Reactive Oxygen Species (ROS) Measurements
Intracellular ROS levels were measured by monitoring the fluorescence of the ROS-sensitive fluorophore, 5-(and-6)-chloromethyl-2′,7′-dichlorodihydrofluorescein diacetate (Molecular Probes Inc., Eugene, OR).
MTT Cell Viability Assays
A standard MTT assay was employed as we previously reported (27).
Statistical Methods
For statistical comparisons, we employed the two-tailed Student's t test. * indicates p < 0.05; ** indicates p < 0.005. For the bar graphs, * and ** evaluate the statistical significance of comparisons with the control of interest. For the line graphs, * and ** compare the marked values with the values just above or below or with the control samples (see the open circles).
RESULTS
NRF2 and CRIF1 Interact
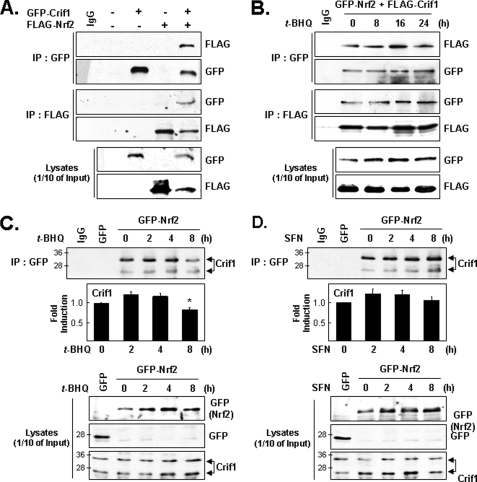
To identify additional transcription factors that might be regulated by interactions with CRIF1, we used a yeast two-hybrid assay (19). By using an expression vector construct encoding a fusion protein between the GAL4 DNA binding domain and a bait protein (in this case, a full-length CRIF1), a cDNA encoding part of NRF2 (aa 403–605) was identified in a Matchmaker cDNA library (data not shown). To confirm this result and to test for a direct NRF2-CRIF1 protein-protein interaction, we performed reciprocal co-immunoprecipitation experiments with total lysates prepared from cells transfected with expression vectors for FLAG-NRF2, GFP-CRIF1, both, or neither. FLAG-NRF2 was detected when lysates were immunoprecipitated with anti-GFP antibody, and GFP-CRIF1 was detected when lysates were immunoprecipitated with anti-FLAG antibody (Fig. 1A). Next, we asked whether these exogenous proteins would co-immunoprecipitate from lysates prepared from cells treated with an NRF2-inducing chemical, t-BHQ, which is known to act as both an antioxidant agent (28) and an oxidative stress-producing agent (6). The t-BHQ treatment did not significantly affect the ability of GFP-NRF2 and FLAG-CRIF1 to co-immunoprecipitate (Fig. 1B). To test whether endogenous CRIF1 can also bind NRF2 under oxidative stress conditions, cells transfected with GFP-NRF2 for 24 h were treated with either t-BHQ or SFN, another NRF2-inducing agent, and then used for IP-WB analysis with an anti-GFP antibody (Fig. 1, C and D). This experiment showed that endogenous CRIF1, like exogenous CRIF1, can interact with NRF2 in the absence or presence of either of two NRF2-inducing agents (Fig. 1, C and D), indicating that the CRIF1-NRF2 interaction is redox-independent. Thus far, CRIF1 with a molecular mass of 30 kDa has been reported (18); however, using the anti-CRIF1 mouse monoclonal antibody that we developed, we found that there are two distinguishable molecular masses of CRIF1 proteins, and the slower migrating form predominantly interacts with NRF2. We quantified the amount of CRIF1 (slower migrating form) interacting with immunoprecipitated GFP-NRF2 and found that t-BHQ or SFN does not significantly change the amount of CRIF1 interacting with NRF2. We only observed the decrease of CRIF1 interaction with NRF2 8 h following t-BHQ treatment. Following t-BHQ (or SFN), we found that exogenously expressed NRF2 levels increased, which may be due to the inhibition of NRF2 negative regulators, such as KEAP1.
FIGURE 1.
Physical interaction of CRIF1 and NRF2. A, exogenous NRF2 and CRIF1 interact under normal reducing conditions. Total lysates of HEK293 cells transiently co-transfected for 24 h with expression vectors for FLAG-NRF2 and GFP-CRIF1, either individually or together, were immunoprecipitated with anti-GFP or anti-FLAG antibodies and then used for WB analysis with anti-FLAG and anti-GFP antibodies as indicated. B, exogenous NRF2 and CRIF1 also interact under oxidative stress conditions. HEK293 cells co-transfected with GFP-NRF2 and FLAG-CRIF1 were then incubated with t-BHQ (100 μm) for the times indicated and analyzed as in A. C and D, endogenous CRIF1 interacts with exogenous NRF2 in the presence of t-BHQ or SFN. MCF-7 cells transfected with GFP as a negative control and GFP-NRF2 expression vector for 24 h and then treated with either 100 μm t-BHQ (C) or 5 μm SFN (D) for the times indicated. IP-WBs were analyzed as in A except that an anti-CRIF1 mouse antibody was used. One-tenth of the total cell lysates was also used for WB analysis (bottom panels). For the top panels of C and D, IP-WB images were scanned, and quantified results are shown as bar graphs (below the IP-WB images). We quantified the slower migrating form of CRIF1, which is the form that predominantly interacts with NRF2, and the results are shown in the bar graphs. The results were from triplicate experiments, and a representative image of IP-WB is shown.
Co-localization of Endogenous CRIF1 and NRF2 in the Nucleus and Cytoplasm
Confocal laser scanning microscopy was used to compare immunolocalization of endogenous NRF2 with that of endogenous CRIF1 in DU-145 cells. Both NRF2 and CRIF1 showed nuclear as well as cytoplasmic localization in the absence of t-BHQ (supplemental Fig. S1A). It was clearly shown that most of NRF2 translocates to the nucleus after 60 min of t-BHQ treatment. In comparison, both nuclear and cytoplasmic CRIF1 were observed with and without t-BHQ treatment. The merged images showed significant co-localization (yellow) of NRF2 and CRIF1 in the nucleus and cytosol in the absence and in the presence of t-BHQ within 30 min, but very little co-localization of NRF2 and CRIF1 in the cytoplasm was found at 60 min after t-BHQ treatment. These findings suggest that some portion of endogenous NRF2 and CRIF1 proteins interact with each other, independent of redox conditions (supplemental Fig. S1A).
CRIF1 Interacts with Both N- and C-terminal Regions of NRF2
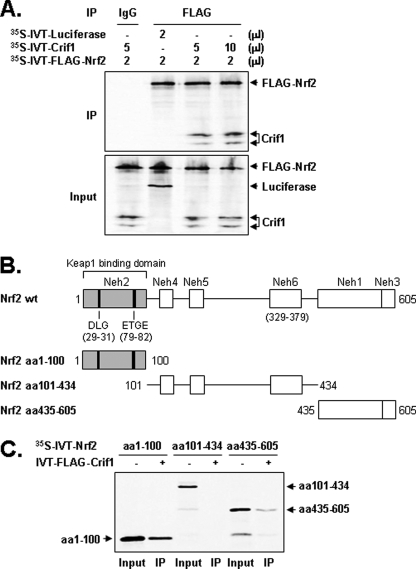
To obtain additional information about this interaction, we prepared 35S-labeled in vitro transcribed and translated (IVT) proteins (NRF2, CRIF1, and luciferase, as a control). When mixtures of the 35S-labeled luciferase and 35S-labeled FLAG-NRF2 were immunoprecipitated with an anti-FLAG antibody, no 35S-labeled luciferase was detected (Fig. 2A, 2nd lane of upper panel and see 2nd lane of lower panel for a control of luciferase). In contrast, significant amounts of 35S-labeled CRIF1 were found when mixtures of 35S-labeled CRIF1 and 35S-labeled FLAG-NRF2 were immunoprecipitated with the anti-FLAG antibody (Fig. 2A, 3rd and 4th lanes of upper panel). These results strongly suggest that CRIF1 can directly interact with NRF2 in vitro. It is interesting to note that IVT of CRIF1 produced two differentially migrating forms of CRIF1 as we previously observed in WBs (Fig. 1, C and D, and supplemental Fig. S1, B and C). Both slower and faster migrating forms of CRIF1 IVT seem to interact with NRF2 not only in vitro but also in vivo (Fig. 1, C and D). Next, we identified which regions of NRF2 interact with CRIF1. For this experiment, we used full-length wild-type NRF2 and three NRF2 deletion mutant constructs (see Fig. 2, B and C). When mixtures of unlabeled IVT-FLAG-CRIF1 and each of the 35S-labeled NRF2 deletion mutants were immunoprecipitated with the anti-FLAG antibody, we found that CRIF1 co-immunoprecipitated with both the most N-terminal (aa 1–100) and the most C-terminal (aa 435–605) regions of NRF2 (Fig. 2C), indicating that NRF2 contains at least two domains capable of binding CRIF1. Previous studies and our current studies found that KEAP1 interacts only with the most N-terminal region of NRF2 (data not shown) (29). Because the C terminus of NRF2 contains a bZIP that mediates sequence-specific DNA binding and we wanted to test whether CRIF1 binds the bZIP domain, we constructed multiple NRF2 deletion mutants as shown in supplemental Fig. S2.The supplemental Fig. S2B shows that CRIF1 does not interact with aa 101–434, 101–486, 101–500, and 101–527 but does interact with aa 101–544, 101–569, 101–585, and 101–605. These results specify that CRIF1 partially interacts with the bZIP domain (aa 435–563) of NRF2.
FIGURE 2.
CRIF1 interacts with both N- and C-terminal sequences of NRF2. A, IVT CRIF1 and FLAG-NRF2 proteins interact. 35S-Labeled proteins (see “Experimental Procedures”) were mixed, immunoprecipitated with an anti-FLAG antibody, subjected to SDS-PAGE, and exposed to x-ray film. These experiments were repeated three times and yielded similar results; a representative result is shown. 35S-Labeled IVT luciferase was used as the negative control. B, schematic of the NRF2 deletion mutants used for the experiments in C. C, CRIF1 interacts with both N- and C-terminal regions of NRF2. Mixtures of unlabeled IVT full-length FLAG-CRIF1 and three 35S-labeled NRF2 deletion mutants were immunoprecipitated with the anti-FLAG antibody, subjected to SDS-PAGE, and exposed to x-ray film.
CRIF1 Negatively Regulates NRF2 Protein Levels
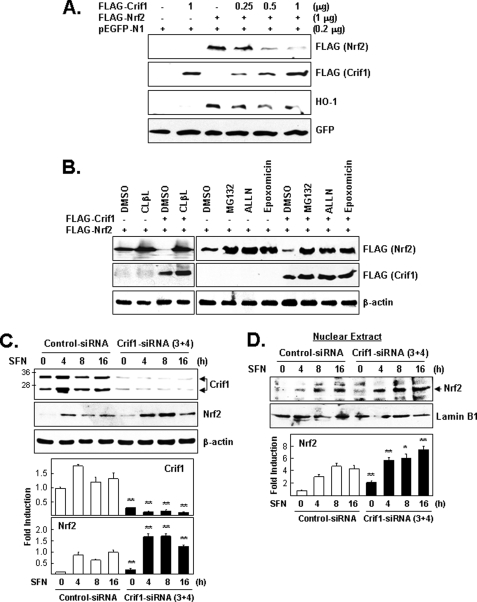
Because CRIF1 and NRF2 interact, we tested whether CRIF1 can affect NRF2 protein levels under normal reducing conditions. As expected, CRIF1 overexpression reduced accumulation of both exogenous NRF2 as well as an NRF2 target gene-encoded protein HO-1 (Fig. 3A). Next, we examined the effect of four proteasomal inhibitors (clasto-lactacystin β-lactone, MG132, ALLN, and epoxomicin) on exogenous NRF2 protein levels in CRIF1 overexpressing cells (Fig. 3B). Each inhibitor increased NRF2 protein levels, indicating that CRIF1, like KEAP1, negatively regulates NRF2 protein levels by affecting its stability, at least under normal reducing conditions. To test whether endogenous CRIF1 negatively regulates endogenous NRF2 protein levels, we first reduced the negative regulation of endogenous NRF2 of CRIF1 by using CRIF1-specific siRNAs. Then, by adding SFN, we eliminated the negative regulation of KEAP1 for both the basal level of endogenous NRF2, as well as any additional NRF2 protein that may have been synthesized as a result of CRIF1 knockdown. Cells pretreated with siRNA (control versus CRIF1) for 72 h were treated with 5 μm of SFN and then harvested immediately or after 4, 8, or 16 h and subjected to WB analysis (Fig. 3C). Because more endogenous NRF2 accumulated in the CRIF1 knockdown cells (treated with SFN) than in the control cells (also treated with SFN), it is clear that endogenous CRIF1 acts as a negative regulator of endogenous NRF2 protein. Thus, by eliminating the negative regulation of KEAP1 for NRF2 for at least 4 h, we were able to easily detect the ability of endogenous CRIF1 to negatively regulate endogenous NRF2 protein levels (Fig. 3C). We used the same approach, employing SFN to eliminate negative regulation of KEAP1 for endogenous NRF2, to show that CRIF1 knockdown results in a further increase of nuclear accumulation of endogenous NRF2 (Fig. 3D).
FIGURE 3.
CRIF1 regulates NRF2 protein levels via proteasome-mediated degradation. A, effect of CRIF1 overexpression on NRF2 protein levels. Cells (HEK293) were co-transfected for 24 h with three expression vectors (constant amounts of FLAG-NRF2 and pEGFP-N1 (the control vector) and increasing amounts of FLAG-CRIF1) and were analyzed on WB. B, effect of proteasomal inhibitors on CRIF1-driven down-regulation of NRF2 protein levels. Cells co-transfected as in A with the indicated expression vectors were incubated for an additional 4 h with proteasomal inhibitors (clasto-lactacystin β-lactone (CLβL) (10 μm), MG132 (10 μm), ALLN (50 μm), and epoxomicin (1 μm)) and then analyzed by WB. Exogenous FLAG-CRIF1 and FLAG-NRF2 were identified by their different migration distances. C, effects of CRIF1 knockdown on NRF2 protein levels. Cells (MCF-7) pretreated with siRNA (control versus CRIF1–3 and -4) for 72 h were treated with SFN (5 μm) and harvested at the indicated times. Total cell lysates were used for WB analysis with anti-NRF2 and anti-CRIF1 mouse monoclonal antibodies. β-Actin was used as a loading and transfer control. D, nuclear extracts from cells in C were subjected to WB analysis. Lamin B1 was used as a control for nuclear fractionation and equal loading. The results of WB image quantification of triplicate experiments are shown as bar graphs on the bottom panels of C and D.
An independent approach to assessing the effect of CRIF1 on NRF2 protein stability, measuring protein half-life, gave similar results (supplemental Fig. S3). CRIF1 overexpression significantly decreased the half-life of pre-existing exogenous NRF2, when the cells were incubated with cycloheximide for the indicated times (supplemental Fig. S3A). In contrast, the half-life of endogenous NRF2 induced by SFN was significantly increased in CRIF1 knockdown cells that were incubated in cycloheximide for intervals up to 75 min (supplemental Fig. S3B). Thus, we found that NRF2 stability is significantly affected by the presence of CRIF1.
CRIF1 Promotes NRF2 Ubiquitination
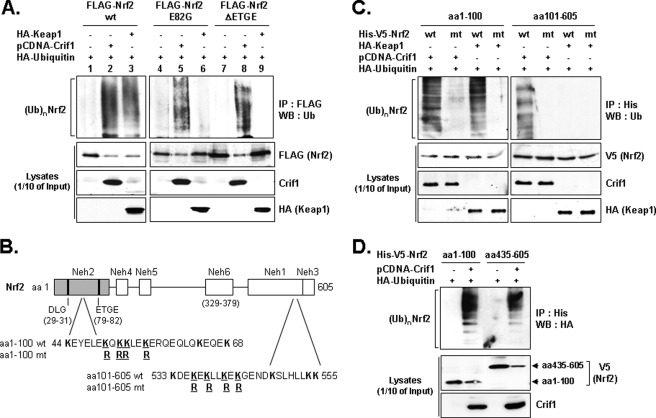
We used standard WB analysis to determine whether CRIF1 could promote the ubiquitination of wild-type and two ETGE mutant NRF2 (E82G and ΔETGE) proteins (that KEAP1 cannot bind and ubiquitinate) (13). As expected, overexpression of either CRIF1 or KEAP1 reduced exogenous wild-type NRF2 protein levels in total cell lysates (Fig. 4A, 2nd panel from the top, lanes 2 and 3). The wild-type NRF2 protein was ubiquitinated when either CRIF1 or KEAP1 was overexpressed (Fig. 4A, lanes 2 and 3). In contrast to the similar effects of CRIF1 and KEAP1 overexpression on wild-type NRF2 ubiquitination, only CRIF1 overexpression promoted significant poly-ubiquitination of the two NRF2 ETGE mutants (E82G and ΔETGE, Fig. 4A, lanes 5 and 8) defective for KEAP1 binding (Fig. 4A, lanes 6 and 9). Thus, CRIF1-driven NRF2 ubiquitination does not require the KEAP1-binding site. However, both CRIF1 and KEAP1 may ubiquitinate the same N-terminal lysine residues because an N-terminal NRF2 protein fragment carrying four lysine to arginine substitutions (see Fig. 4, B and C) is not ubiquitinated by overexpressing either CRIF1 or KEAP1 (Fig. 4C), even though both CRIF1 and KEAP1 can bind this quadruple mutant protein fragment (supplemental Fig. S4A) (14).
FIGURE 4.
CRIF1 promotes NRF2 ubiquitination. A, total lysates of COS-1 cells co-transfected for 24 h with the expression vector combinations (encoding full-length NRF2) indicated at the top of the figure were divided and then analyzed either directly on WBs (1/10 of the lysates) or first immunoprecipitated with anti-FLAG antibody and then used for standard WB analysis with the antibodies indicated in the right-hand margin. B, schematic showing the amino acid composition of the N- and C-terminal lysine clusters and their locations relative to previously described NRF2 landmarks. C, cells (COS-1) co-transfected for 24 h with indicated expression vectors, including NRF2 mutants (mt) with four lysine to arginine residues, were subjected to IP and WB analysis as described in A. wt, wild type. D, COS-1 cells were co-transfected for 24 h with the indicated expression vectors. The NRF2 deletion mutant encoding expression vectors encoded two tags, His and V5, and CRIF1 was in pCDNA and ubiquitin was tagged with HA. Total lysates were immunoprecipitated with the anti-His (NRF2) antibody and analyzed as in A and C with the antibodies indicated in the right-hand margin. (Ub)n NRF2 indicates polyubiquitinated forms of NRF2.
Because CRIF1 can bind the N- and C-terminal region of NRF2 (Fig. 2C), we tested whether CRIF1 can also drive ubiquitination at the C terminus of NRF2. This possibility seemed reasonable because we found that this region also contains a lysine cluster (see Fig. 4B), the potential target of ubiquitination. Indeed, CRIF1, but not KEAP1, can drive ubiquitination of the C-terminal region of NRF2 (Fig. 4, C and D, top panel). Again, a lysine to arginine quadruple point mutant protein fragment was not significantly ubiquitinated by CRIF1 overexpression (Fig. 4C), even though CRIF1 could bind this quadruple mutant protein fragment (supplemental Fig. S4B). Neither KEAP1 nor CRIF1 can bind to or drive ubiquitination of the middle region of NRF2 (data not shown).
CRIF1-driven NRF2 Ubiquitination Is Redox-independent
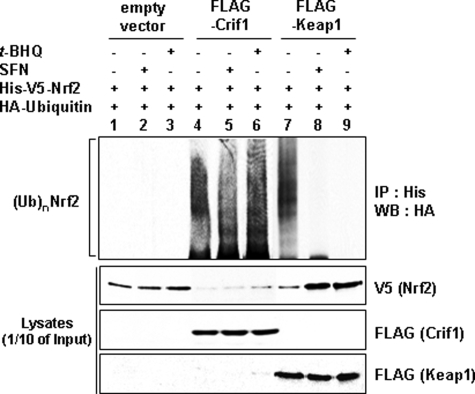
Because CRIF1 overexpression causes easily detectable NRF2 ubiquitination under reducing conditions (Fig. 4A), we asked whether CRIF1 overexpression under oxidative stress conditions (t-BHQ or SFN) would also result in easily detectable NRF2 ubiquitination. This was indeed observed (Fig. 5, lanes 4 and 5). Oxidative stress caused easily detectable NRF2 ubiquitination only if CRIF1 was overexpressed (Fig. 5, lanes 2 and 3 (empty vector), versus lanes 5 and 6 (CRIF1) versus lanes 8 and 9 (KEAP1)). As expected, KEAP1 overexpression causes easily detectable NRF2 ubiquitination only under reducing conditions (Fig. 5, 2nd panel from the top, lane 7, versus lanes 8 and 9). Thus, CRIF1-driven NRF2 ubiquitination is redox-independent.
FIGURE 5.
CRIF1-driven NRF2 ubiquitination and degradation are redox-independent. Total lysates of MCF-7 cells co-transfected with the indicated expression vectors for 24 h were treated with either 100 μm of t-BHQ or 5 μm of SFN for 6 h and were immunoprecipitated with an anti-His antibody (for NRF2) followed by analysis on WBs with anti-HA antibody (for ubiquitin). One-tenth of the total cell lysates was used to determine the expression level of each transfected DNA plasmid by WB analysis. Anti-V5 antibody was used to detect exogenously expressed NRF2, and the anti-FLAG antibody was used to detect either CRIF1 or KEAP1. The two proteins, FLAG-CRIF1 and FLAG-KEAP1, were identified by their molecular weights. FLAG-CRIF1 and FLAG-KEAP1 were detected at ∼30 and 70 kDa, respectively.
CRIF1 Negatively Regulates NRF2 Target Gene Expression
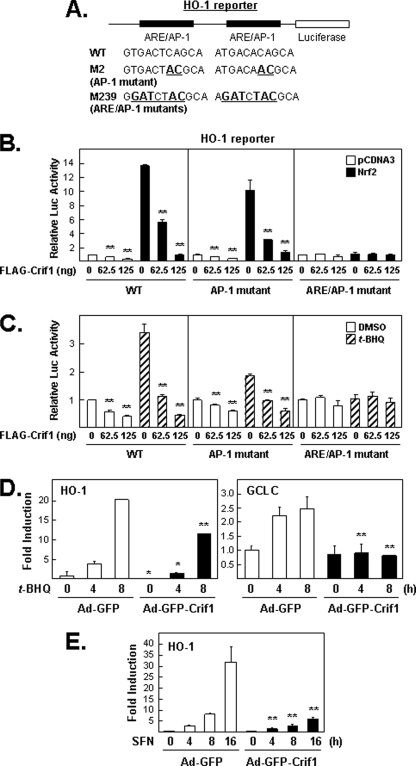
These results shown in Fig. 6 indicate that NRF2 target gene expression might be negatively regulated by CRIF1 protein levels under both oxidative stress and normal reducing conditions. We first tested this possibility using a HO-1 gene reporter plasmid. The genomic enhancer of HO-1 can be induced under both reducing conditions (by overexpressing NRF2) and under oxidative stress (t-BHQ). The HO-1 genomic DNA region in our reporter plasmid is called E1 enhancer, which contains two AREs overlapping with AP-1-binding sites (see Fig. 6A) (30). As expected, both the basal and t-BHQ-induced expression from this reporter plasmid were reduced by CRIF1 overexpression (Fig. 6, B and C). We found similar results with a reporter plasmid driven by promoter sequences from a different NRF2 target gene, NQO1, in two different cell lines, MCF-7 and AsPC-1 (data not shown).
FIGURE 6.
Overexpression of CRIF1 represses NRF2 target gene expression. These experiments used luciferase reporter plasmids that contain AREs from the HO-1 enhancer. A, schematic of the HO-1 gene enhancer region present in the reporter plasmid used in B and C. The two AREs have overlapping 12-O-tetradecanoylphorbol-13-acetate-response elements (TRE or AP-1-binding sites). The M2 mutant contains 2 bp changes in each AP-1 site, leaving the ARE core sequence (TGACnnnGC) intact. The M239 mutant contains multiple base pair changes that affect both ARE core sequences and the AP-1-binding sites. WT, wild type. B, effects of CRIF1 overexpression on basal and induced expression from wild-type and mutant HO-1 reporter plasmids. Total lysates of MCF-7 cells transfected with various DNA plasmids for 24 h as indicated were measured for luciferase (Luc) activity. C, effects of CRIF1 overexpression on t-BHQ-induced HO-1 luciferase reporter. Cells transfected with HO-1 reporter and FLAG-CRIF1 (except NRF2) for 16 h were incubated with either DMSO (control vehicle) or t-BHQ (100 μm) for 24 h before harvesting for measuring luciferase activity. D and E, effects of CRIF1 on NRF2 target gene expression. Total RNA was isolated from the MCF-7 cells infected with control Ad-GFP versus Ad-GFP-CRIF1 for 24 h and were treated with 100 μm of t-BHQ (D) or 5 μm of SFN (E). Real time PCR for HO-1 and GCLC was performed as described under “Experimental Procedures.”
CRIF1 Regulation of HO-1 Reporter Activity Requires Intact ARE Sequences
Next, we identified sites in the HO-1 enhancer necessary for maximal reporter plasmid induction under either reducing (NRF2 overexpression) or oxidative stress-inducing conditions (t-BHQ) (Fig. 6). The AP-1-only mutant M2 (see Fig. 6A) was tested because AP-1 or AP-1-like binding sites found in some promoters that also contain ARE sites can affect antioxidant gene expression (31). However, under these conditions, this AP-1 mutant did not limit the ability of overexpressed NRF2 (Fig. 6B, middle panel) to induce reporter activity, but it may somewhat limit the capacity of t-BHQ treatment to induce reporter activity (Fig. 6C, middle panel). Also, the AP-1 mutant had no effect on the ability of exogenous CRIF1 to significantly reduce reporter plasmid activity (Fig. 6, B and C, middle panel). In contrast, the reporter plasmid carrying mutations in both ARE sites and the AP-1 site was not responsive to either inducing conditions, even in the absence of exogenous CRIF1, indicating that efficient induction of reporter activity requires at least one intact ARE. To test whether exogenous CRIF1 can affect NRF2 and NRF2 target gene mRNA levels when functional KEAP1-NRF2 interactions are eliminated, cells were infected with adenovirus (GFP versus GFP-CRIF1) (19) for 24 h and then treated with t-BHQ (100 μm) or SFN (5 μm) for increasing time intervals and harvested for WB (supplemental Fig. S5) and real time PCR analysis (Fig. 6, D and E). As expected, reduced NRF2 protein levels (supplemental Fig. S5) and GCLC and HO-1 mRNA levels were found in CRIF1 overexpressed cells, even when KEAP1 negative regulation is eliminated by t-BHQ or SFN (Fig. 6, D and E).
Effect of Endogenous CRIF1 in NRF2 Transcriptional Regulation Activity, Its DNA Binding Activity and Its Target Gene Expression
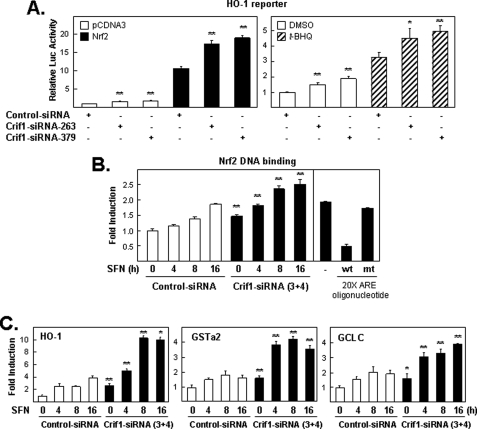
Next, we asked whether the functional interactions observed between exogenous CRIF1 and NRF2 proteins reflect similar functional interaction between endogenous CRIF1 and NRF2 proteins. To determine the effects of endogenous CRIF1 protein levels on NRF2 target gene expression, we reduced endogenous CRIF1 protein levels with two CRIF1-specific siRNAs. As expected, we found that endogenous CRIF1 knockdown allowed modest but statistically significant increased reporter activity after NRF2 overexpression and after t-BHQ exposure (Fig. 7A) as compared with cells containing normal amounts of CRIF1. The modest effects observed in this experiment may reflect, at least in part, that normal amounts of endogenous KEAP1 protein were present (data not shown). Thus, these results are consistent with the notion that endogenous CRIF1 protein levels also negatively regulate NRF2 protein levels. Because our study showed that knockdown of endogenous CRIF1 enhanced SFN-induced NRF2 total and nuclear expression (Fig. 3, C and D), we determined whether the induced nuclear NRF2 binds to an ARE-containing DNA sequence. Nuclear extracts from cells treated with siRNA (control versus CRIF1) were fractionated (as in Fig. 3D) and incubated with TransAMTM-NRF2, a quantitative ELISA kit. The results show significant increase of NRF2 binding with and without SFN treatment (Fig. 7B). Finally, total RNA extracted from cells treated with siRNA (control versus CRIF1) and then with SFN was used for real time PCR. As expected, increased mRNA levels from three NRF2 target genes, HO-1, GSTa2, and GCLC were found in CRIF1 knockdown cells when compared with control cells (Fig. 7C).
FIGURE 7.
Knockdown of CRIF1 on NRF2-, t-BHQ-, or SFN-induced gene expression. A, endogenous CRIF1 levels limit the ability of the HO-1 reporter plasmid to respond to inducing treatments. Cells pretreated with siRNA (control, CRIF1–263, or -379) for 48 h were transfected with the DNA plasmid as indicated for 16 h and harvested for luciferase (Luc) analysis (left-hand bar graph). Next, cells were transfected similarly as in the left panel (but without NRF2) and then exposed for an additional 24 h to either DMSO or 100 μm of t-BHQ before measuring the luciferase activity (right-hand bar graph). The luciferase activities in all figures were normalized to the value obtained with the empty expression plasmid control, unless otherwise indicated or as described under “Experimental Procedures,” and are presented as mean luciferase activity ± S.E. of n = 4 wells. A representative of three independent experiments that yielded similar results is shown in each panel. * means p < 0.05, and ** means p < 0.005. B, NRF2 binds to an ARE-containing DNA sequence. Nuclear extracts from cells treated with siRNA (control versus CRIF1–3 and -4) for 48 h and treated with SFN (5 μm) for the indicated times were incubated with TransAMTM-NRF2, a quantitative ELISA kit. The left-hand panel shows the effect of CRIF1-siRNA treatment on total nuclear binding capacity of NRF2. The right-hand panel demonstrated the effects of 20-fold excess amount (20 pmol/well over 1 pmol-the amount of probe immobilized on the plate) of wild-type consensus oligonucleotides or the mutated consensus oligonucleotides on NRF2 binding activity in SFN-treated sample (5 μm, 16 h). mt, mutant; wt, wild type. C, total RNA isolated from experiments similar to that performed in B was used for quantitative real time PCR analysis. Appropriate primers for the three NRF2 target genes, HO-1, GSTa2, and GCLC, were used as described under “Experimental Procedures.”
CRIF1 Affects NRF2 Accumulation at Genomic ARE-containing Sites
We hypothesized that CRIF1 could negatively regulate NRF2 target gene expression at the chromosomal level by affecting NRF2 accumulation at ARE-containing regions of NRF2 target gene promoters and enhancers. We examined this possibility in MCF-7 cells by using a standard ChIP assay analysis method to ask the following question. Does exogenous FLAG-CRIF1 affect the accumulation of exogenous His-V5-NRF2 at the enhancer region of HO-1? We did this ChIP assay analysis in the absence of conditions that induce HO-1 gene expression. The results of the single transduction controls, His-V5-NRF2 alone and FLAG-CRIF1 alone, showed that antibodies to either His or FLAG could immunoprecipitate detectable amounts of the endogenous enhancer DNA and that both of these antibodies immunoprecipitated significantly more HO-1 DNA than the nonspecific antibody control, IgG (supplemental Fig. S6B), indicating that exogenous, epitope-tagged CRIF1 can accumulate at ARE-containing chromatin DNA sequences (and, as expected, so could epitope-tagged NRF2). However, when cells were simultaneously co-transfected with expression vectors for both His-V5-NRF2 and FLAG-CRIF1, 60% less HO-1 DNA was immunoprecipitated by the anti-His antibody than when only the His-V5-NRF2 expression vector was used (supplemental Fig. S6, B and C, compare 3rd and 4th lanes), suggesting that CRIF1 somehow reduces NRF2 accumulation at these genomic sites. These results are specific to ARE-containing sites; a nearby non-ARE-containing DNA sequence in the corresponding promoter/enhancer was not detected in complexes immunoprecipitated with either antibody (supplemental Fig. S6B).
CRIF1 Protein Levels Affect ROS Accumulation and Sensitivity of Cells to Oxidative Stressors
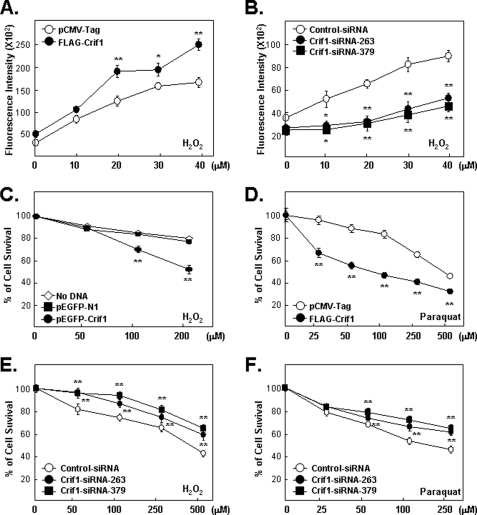
Because the effects of CRIF1 on NRF2 protein levels and NRF2 target gene expression, under both reducing and oxidative stress conditions, are predictable, we hypothesized that altered CRIF1 protein levels might also affect the accumulation of certain types of ROS in a predictable manner. These predictions were confirmed in cells containing normal amounts of NRF2. Overexpression of CRIF1 enhanced both basal and H2O2-induced ROS accumulation, and CRIF1 knockdown reduced both basal and H2O2-induced ROS accumulation (Fig. 8, A and B). Given the results in Fig. 8, A and B, we hypothesized that altered CRIF1 protein levels should also have predictable effects on the ability of the cells to resist the killing effects of oxidative stress-inducing agents, H2O2 or Paraquat (27). As expected, MCF-7 cells became more sensitive to killing by these agents when transfected with the CRIF1 expression vector (Fig. 8, C and D) and more resistant to oxidative stress-induced cytotoxicity after CRIF1 knockdown (Fig. 8, E and F). Similar effects were found with a second cell line, MDA-MB-231 (data not shown).
FIGURE 8.
CRIF1 regulates ROS accumulation and cell sensitivity to oxidative stress. A, CRIF1 overexpression increases ROS accumulation. ROS accumulation in MCF-7 cells transfected for 24 h and then treated with various doses of H2O2 for 24 h was measured as described under “Experimental Procedures.” B, CRIF1 knockdown decreases ROS accumulation. ROS levels in MCF-7 cells transfected for 48 h and then treated with H2O2 for 24 h were measured as in A. C–F, CRIF1 affects the ability of the cell to survive oxidative stress. C and D, MCF-7 cells transfected with GFP-CRIF1 or FLAG-CRIF1 (versus empty vectors, pEGFP-N1 or pCMV-Tag) for 24 h and then treated with H2O2 for 24 h (C) or paraquat for 72 h (D) were assayed for viability by standard MTT assays. Values are presented as means ± S.E. of cell viability in 10 replicate wells relative to the untreated controls (no DNA or empty vector and no killing agents). The results shown are representative of three independent experiments. E and F, cells (MCF-7) pretreated with the indicated siRNAs (control versus CRIF1–263 or -379) for 48 h were treated with H2O2 for 24 h (E) or paraquat for 72 h (F) when MTT assays were done.
DISCUSSION
Activity of CRIF1 toward NRF2 is similar in several ways to that previously described for KEAP1. Both CRIF1 and KEAP1 1) function at the post-transcription level; 2) regulate NRF2 protein levels by binding the N-terminal region of NRF2; 3) promote ubiquitination of the same cluster of N-terminal NRF2 lysine residues; 4) promote proteasome-mediated degradation of NRF2; and 5) function under the reducing conditions normally present in cells.
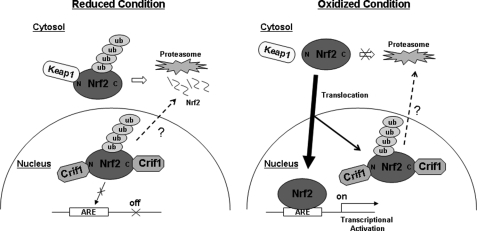
There are also several differences between the activity of CRIF1 and KEAP1; for example, 1) CRIF1 interacts with both the N and C termini of NRF2 protein, whereas KEAP1 interacts with only the N terminus of NRF2; and 2) KEAP1 cannot interact with ETGE point mutants of NRF2, whereas CRIF1 can. However, the most important difference between CRIF1 and KEAP1 negative regulation of NRF2 may have physiological significance, i.e. the unique ability of CRIF1 (but not KEAP1) to negatively regulate NRF2 protein levels under conditions of oxidative stress. Some of these findings were demonstrated in a model accounting for the degradation of the NRF2 transcription factor by CRIF1 and KEAP1 (see Fig. 9 and its legend).
FIGURE 9.
A proposed model for CRIF1 and NRF2 interaction. This schematic drawing demonstrates how CRIF1 regulates NRF2 ubiquitination and its transcriptional regulation in either reduced or oxidized conditions. We found two forms of CRIF1, a fast migrating form in the cytosol and a slow migrating form in the nucleus. Because nuclear CRIF1 is the predominant form that interacts with NRF2, this model is focused on role of nuclear CRIF1. In reduced conditions, CRIF1 binds and ubiquitinates nuclear NRF2, which limits its ability to function as a transcription factor. In oxidized conditions, NRF2 bound by KEAP1 will escape from proteasome-mediated degradation and will enter into the nucleus. Perhaps excess amounts of NRF2, which cannot bind ARE-containing promoters or enhancers, may bind nuclear CRIF1 and undergo post-translational modifications. Whether these post-translational modifications of NRF2 occur in the cytosol or nucleus needs further investigation. To include the faster migrating form of CRIF1 (cytosolic), which weakly interacts with NRF2 in redox-independent manner into this model, we need to know the following: 1) whether KEAP1 and the fast migrating form of CRIF1 are in the same cellular compartment; 2) whether KEAP1 and CRIF1 compete with each other to bind N-terminal of NRF2; and 3) a precise DNA sequence of the fast migrating form of CRIF1.
We speculate that this ability may serve important normal functions and that manipulating this ability might have clinical utility. It has been speculated that cells may have a normal (but at that time unidentified) ability to limit NRF2 protein levels under conditions where KEAP1 cannot drive NRF2 degradation (32), i.e. under conditions of oxidative stress and especially under chronic oxidative stress where the uncontrolled accumulation of NRF2 protein and the resulting uncontrolled NRF2-driven transcription could be harmful or lethal (33). Mouse knock-out phenotypes are consistent with this speculation. Thus, Keap1 knock-out mice die shortly after birth (possibly from uncontrolled expression of Nrf2 target genes), but mice defective for both Keap1 and Nrf2 are viable (possibly because Nrf2 target genes cannot be overexpressed sufficiently to cause embryonic death in the double knock-out).
The potential clinical utility of CRIF1 manipulation is suggested by recent reports showing that NRF2 protein levels are abnormally high in certain cancers and cancer cell lines (34, 35), that these cell lines are relatively drug-resistant, and that this drug resistance can be modified by altering NRF2 protein levels. Drug resistance may arise, at least in part, from NRF2 target gene-encoded proteins acting to detoxify and/or export anti-cancer agents. However, a much larger literature emphasizes potential cancer-preventive effects of NRF2-activating chemicals of which many can be found in foods, tea (36), and red wine (resveratrol) (37, 38). In any case, identifying agents that reduce NRF2 protein levels, especially during oxidative stress (e.g. increasing CRIF1 protein or activity levels or blocking KEAP1-NRF2 dissociation), may be useful in clinic settings to help cope with drug-resistant cancer cells.
A second notable difference between KEAP1 and CRIF1 negative regulation of NRF2 is that KEAP1 can bind to, ubiquitinate, and drive proteasomal degradation of full-length NRF2 only at the N-terminal region of NRF2, whereas CRIF1 can bind and ubiquitinate and may drive proteasomal degradation of full-length NRF2 through both ends of the protein. It is tempting to speculate that this greater range of CRIF1-NRF2 interactions is somehow related to the greater range of conditions under which CRIF1 can negatively regulate NRF2 protein levels and thus NRF2 target gene expression. We do not yet have evidence bearing on this possibility but are examining this question.
Several additional questions are raised by our results. Previous studies have shown that CRIF1 is an important player in cell cycle control (18) and that redox signaling can affect the cell cycle (39). Thus, is it possible that CRIF1 coordinates cell cycle control-specific responses to more general responses of the cells to overall oxidative stress? In what cellular compartment(s) does CRIF1 have its effect(s) on NRF2 protein stability? Are CRIF1 and KEAP1 negative regulations of NRF2 completely independent of one another? Although all of our evidence is consistent with independent negative regulation, there is at least one possibility for functional CRIF1-KEAP1 interactions, and although CRIF1 binding to the N-terminal region does not require certain amino acids necessary for KEAP1 binding to this region, CRIF1 ubiquitinates or at least requires a lysine cluster whose ubiquitination is driven by KEAP1. If CRIF1 and KEAP1 drive ubiquitination of exactly the same lysine residue in this lysine cluster, cooperation and/or competition also seem likely.
In summary, our results demonstrate that knockdown of CRIF1 and KEAP1 can independently increase expression from NRF2 target gene reporter plasmids, strongly suggesting that normal levels of CRIF1 and KEAP1 can independently limit NRF2 protein levels and its ability to stimulate genomic transcription.
Supplementary Material
Acknowledgments
We appreciate Dr. Thomas L. Mattson and Dr. Rashmi Nemade (BioMedText, Inc.) for helpful discussions and editing. We also appreciate Dr. Manabu Furukawa (Nebraska University Medical Center) and Dr. Jawed Alam (Ochsner Medical Center) who kindly provided us NRF2/KEAP1 DNA plasmids and series of HO-1-Luc reporters, respectively.

The on-line version of this article (available at http://www.jbc.org) contains supplemental Figs. S1–S6.
- ROS
- reactive oxygen species
- aa
- amino acid
- bZIP
- basic leucine zipper domain
- t-BHQ
- tert-butylhydroquinone
- IP
- immunoprecipitation
- ChIP
- chromatin immunoprecipitation
- WB
- Western blot
- HA
- hemagglutinin
- GFP
- green fluorescent protein
- SFN
- sulforaphane
- IVT
- in vitro transcription and translation
- siRNA
- small interfering RNA
- MTT
- 3-(4,5-dimethylthiazolyl)-2,5-diphenyltetrazolium bromide
- ARE
- antioxidant-response element.
REFERENCES
- 1.Kovacic P., Jacintho J. D. (2001) Curr. Med. Chem. 8, 773–796 [DOI] [PubMed] [Google Scholar]
- 2.Aoki Y., Sato H., Nishimura N., Takahashi S., Itoh K., Yamamoto M. (2001) Toxicol. Appl. Pharmacol. 173, 154–160 [DOI] [PubMed] [Google Scholar]
- 3.Chan K., Kan Y. W. (1999) Proc. Natl. Acad. Sci. U.S.A. 96, 12731–12736 [DOI] [PMC free article] [PubMed] [Google Scholar]
- 4.Enomoto A., Itoh K., Nagayoshi E., Haruta J., Kimura T., O'Connor T., Harada T., Yamamoto M. (2001) Toxicol. Sci. 59, 169–177 [DOI] [PubMed] [Google Scholar]
- 5.Huang H. C., Nguyen T., Pickett C. B. (2000) Proc. Natl. Acad. Sci. U.S.A. 97, 12475–12480 [DOI] [PMC free article] [PubMed] [Google Scholar]
- 6.Itoh K., Wakabayashi N., Katoh Y., Ishii T., Igarashi K., Engel J. D., Yamamoto M. (1999) Genes Dev. 13, 76–86 [DOI] [PMC free article] [PubMed] [Google Scholar]
- 7.Osburn W. O., Wakabayashi N., Misra V., Nilles T., Biswal S., Trush M. A., Kensler T. W. (2006) Arch. Biochem. Biophys. 454, 7–15 [DOI] [PMC free article] [PubMed] [Google Scholar]
- 8.Sekhar K. R., Yan X. X., Freeman M. L. (2002) Oncogene 21, 6829–6834 [DOI] [PubMed] [Google Scholar]
- 9.Zhang D. D., Lo S. C., Cross J. V., Templeton D. J., Hannink M. (2004) Mol. Cell. Biol. 24, 10941–10953 [DOI] [PMC free article] [PubMed] [Google Scholar]
- 10.Cullinan S. B., Gordan J. D., Jin J., Harper J. W., Diehl J. A. (2004) Mol. Cell. Biol. 24, 8477–8486 [DOI] [PMC free article] [PubMed] [Google Scholar]
- 11.Kobayashi A., Kang M. I., Okawa H., Ohtsuji M., Zenke Y., Chiba T., Igarashi K., Yamamoto M. (2004) Mol. Cell. Biol. 24, 7130–7139 [DOI] [PMC free article] [PubMed] [Google Scholar]
- 12.Kang E. S., Woo I. S., Kim H. J., Eun S. Y., Paek K. S., Kim H. J., Chang K. C., Lee J. H., Lee H. T., Kim J. H., Nishinaka T., Yabe-Nishimura C., Seo H. G. (2007) Free Radic. Biol. Med. 43, 535–545 [DOI] [PubMed] [Google Scholar]
- 13.Tong K. I., Katoh Y., Kusunoki H., Itoh K., Tanaka T., Yamamoto M. (2006) Mol. Cell. Biol. 26, 2887–2900 [DOI] [PMC free article] [PubMed] [Google Scholar]
- 14.McMahon M., Thomas N., Itoh K., Yamamoto M., Hayes J. D. (2006) J. Biol. Chem. 281, 24756–24768 [DOI] [PubMed] [Google Scholar]
- 15.Dhakshinamoorthy S., Jaiswal A. K. (2002) Oncogene 21, 5301–5312 [DOI] [PubMed] [Google Scholar]
- 16.Dhakshinamoorthy S., Jain A. K., Bloom D. A., Jaiswal A. K. (2005) J. Biol. Chem. 280, 16891–16900 [DOI] [PubMed] [Google Scholar]
- 17.Sankaranarayanan K., Jaiswal A. K. (2004) J. Biol. Chem. 279, 50810–50817 [DOI] [PubMed] [Google Scholar]
- 18.Chung H. K., Yi Y. W., Jung N. C., Kim D., Suh J. M., Kim H., Park K. C., Song J. H., Kim D. W., Hwang E. S., Yoon S. H., Bae Y. S., Kim J. M., Bae I., Shong M. (2003) J. Biol. Chem. 278, 28079–28088 [DOI] [PubMed] [Google Scholar]
- 19.Park K. C., Song K. H., Chung H. K., Kim H., Kim D. W., Song J. H., Hwang E. S., Jung H. S., Park S. H., Bae I., Lee I. K., Choi H. S., Shong M. (2005) Mol. Endocrinol. 19, 12–24 [DOI] [PubMed] [Google Scholar]
- 20.Suh J. H., Shong M., Choi H. S., Lee K. (2008) Mol. Endocrinol. 22, 33–46 [DOI] [PMC free article] [PubMed] [Google Scholar]
- 21.Kwon M. C., Koo B. K., Moon J. S., Kim Y. Y., Park K. C., Kim N. S., Kwon M. Y., Kong M. P., Yoon K. J., Im S. K., Ghim J., Han Y. M., Jang S. K., Shong M., Kong Y. Y. (2008) EMBO J. 27, 642–653 [DOI] [PMC free article] [PubMed] [Google Scholar]
- 22.Kwon M. C., Koo B. K., Kim Y. Y., Lee S. H., Kim N. S., Kim J. H., Kong Y. Y. (2009) J. Biol. Chem. 284, 33634–33641 [DOI] [PMC free article] [PubMed] [Google Scholar]
- 23.Yi Y. W., Kim D., Jung N., Hong S. S., Lee H. S., Bae I. (2000) Biochem. Biophys. Res. Commun. 272, 193–198 [DOI] [PubMed] [Google Scholar]
- 24.Kang H. J., Kim H. J., Kim S. K., Barouki R., Cho C. H., Khanna K. K., Rosen E. M., Bae I. (2006) J. Biol. Chem. 281, 14654–14662 [DOI] [PubMed] [Google Scholar]
- 25.Kang H. J., Kim H. J., Rih J. K., Mattson T. L., Kim K. W., Cho C. H., Isaacs J. S., Bae I. (2006) J. Biol. Chem. 281, 13047–13056 [DOI] [PubMed] [Google Scholar]
- 26.Keum Y. S., Yu S., Chang P. P., Yuan X., Kim J. H., Xu C., Han J., Agarwal A., Kong A. N. (2006) Cancer Res. 66, 8804–8813 [DOI] [PubMed] [Google Scholar]
- 27.Bae I., Fan S., Meng Q., Rih J. K., Kim H. J., Kang H. J., Xu J., Goldberg I. D., Jaiswal A. K., Rosen E. M. (2004) Cancer Res. 64, 7893–7909 [DOI] [PubMed] [Google Scholar]
- 28.Nakamura Y., Kumagai T., Yoshida C., Naito Y., Miyamoto M., Ohigashi H., Osawa T., Uchida K. (2003) Biochemistry 42, 4300–4309 [DOI] [PubMed] [Google Scholar]
- 29.Kobayashi M., Itoh K., Suzuki T., Osanai H., Nishikawa K., Katoh Y., Takagi Y., Yamamoto M. (2002) Genes Cells 7, 807–820 [DOI] [PubMed] [Google Scholar]
- 30.Alam J. (1994) J. Biol. Chem. 269, 25049–25056 [PubMed] [Google Scholar]
- 31.Venugopal R., Jaiswal A. K. (1998) Oncogene 17, 3145–3156 [DOI] [PubMed] [Google Scholar]
- 32.McMahon M., Thomas N., Itoh K., Yamamoto M., Hayes J. D. (2004) J. Biol. Chem. 279, 31556–31567 [DOI] [PubMed] [Google Scholar]
- 33.Wakabayashi N., Itoh K., Wakabayashi J., Motohashi H., Noda S., Takahashi S., Imakado S., Kotsuji T., Otsuka F., Roop D. R., Harada T., Engel J. D., Yamamoto M. (2003) Nat. Genet. 35, 238–245 [DOI] [PubMed] [Google Scholar]
- 34.Ohta T., Iijima K., Miyamoto M., Nakahara I., Tanaka H., Ohtsuji M., Suzuki T., Kobayashi A., Yokota J., Sakiyama T., Shibata T., Yamamoto M., Hirohashi S. (2008) Cancer Res. 68, 1303–1309 [DOI] [PubMed] [Google Scholar]
- 35.Stacy D. R., Ely K., Massion P. P., Yarbrough W. G., Hallahan D. E., Sekhar K. R., Freeman M. L. (2006) Head Neck 28, 813–818 [DOI] [PubMed] [Google Scholar]
- 36.Patel R., Maru G. (2008) Free Radic. Biol. Med. 44, 1897–1911 [DOI] [PubMed] [Google Scholar]
- 37.Kode A., Rajendrasozhan S., Caito S., Yang S. R., Megson I. L., Rahman I. (2008) Am. J. Physiol. Lung Cell Mol. Physiol. 294, L478–L488 [DOI] [PubMed] [Google Scholar]
- 38.Rubiolo J. A., Mithieux G., Vega F. V. (2008) Eur. J. Pharmacol. 591, 66–72 [DOI] [PubMed] [Google Scholar]
- 39.Shackelford R. E., Kaufmann W. K., Paules R. S. (2000) Free Radic. Biol. Med. 28, 1387–1404 [DOI] [PubMed] [Google Scholar]
Associated Data
This section collects any data citations, data availability statements, or supplementary materials included in this article.


