

Abstract
Objective
This study characterized treated adolescents’ alcohol use and symptom trajectories over 1 year to describe the form of use trajectories and symptom trajectories, and the joint probability of membership in alcohol use and symptom trajectory groups.
Method
109 teens (age 14–18, 66% male, 94% white), recruited from addictions treatment, with a lifetime DSM-IV alcohol diagnosis, reported on daily alcohol use and symptoms in monthly phone contacts using the Time Line Follow-Back method. A group-based modeling method jointly estimated trajectories of use and symptoms.
Results
Four alcohol use trajectories were identified: “Abstinent” (31%), Low (36%), Increasing (28%), and High Use (5%). Three alcohol symptom trajectories were identified: Very Low severity (44%), Mild (44%), and High severity (12%). The most frequent joint outcome was “Abstinent” and Very Low symptom severity (32%).
Conclusions
Symptom severity was moderately related to alcohol use pattern over 1 year. Findings have implications for moving beyond relapse defined as a return to “any use” to consideration of treatment outcome in terms of a broader pattern of alcohol use and problems.
Keywords: Adolescent, Alcohol, Course, DSM-IV
1. Introduction
Treated adolescents’ alcohol and other drug involvement generally decreases through 1-year follow-up (Catalano, Hawkins, Wells, & Miller, 1990–1991; Williams, Chang, & Addiction Centre Adolescent Research Group, 2000). However, a high degree of heterogeneity characterizes adolescents’ posttreatment course. Specifically, multiple patterns of treated adolescents’ alcohol use have been identified over short-term (e.g., Chung, Maisto, Cornelius, & Martin, 2004) and longer term follow-ups (e.g., Abrantes, McCarthy, Aarons, & Brown, 2002; Chung et al., 2003). Little is known, however, about teens’ posttreatment alcohol involvement when level of alcohol use is considered in conjunction with the occurrence of alcohol symptoms during early recovery.
In one study, conjoint consideration of level of alcohol use and symptom occurrence in treated teens identified a group, defined a priori, of “non-problem drinkers”. Non-problem drinking teens were defined as those who reported moderate alcohol use, but no DSM-IV alcohol symptom over 1-year follow-up (Maisto, Martin, Pollock, Cornelius, & Chung, 2002). Non-problem drinkers comprised 23% of an adolescent clinical sample. When non-problem drinkers were compared with “problem drinkers” (i.e., teens who reported alcohol use and any DSM-IV alcohol symptom over follow-up) and abstainers on measures of psychosocial functioning over 1 year, non-problem drinkers showed improvements in psychosocial functioning over follow-up that were similar to teens who reported complete abstinence from alcohol (Maisto et al., 2002). Similar results were observed in a larger clinical sample that included teens from the Maisto et al. (2002) report, and that extended the observation window through 3-year follow-up (i.e., baseline, 1- and 3-year follow-ups) (Chung et al., 2003). Adolescent non-problem drinkers’ generally positive psychosocial outcomes highlight the importance of considering pattern of alcohol use in conjunction with alcohol symptom occurrence, in contrast to focusing only on level of alcohol consumption.
Existing studies of adolescent non-problem and problem drinking outcomes, however, have been limited to contrasting groups defined a priori (i.e., abstainers, non-problem and problem drinkers). In particular, the group of problem drinkers represents teens with a wide range in alcohol symptom severity (i.e., total DSM-IV alcohol symptom count ranges from 1 to 11), which suggests the potential utility of distinguishing problem drinkers by the number and/or type of symptoms endorsed over follow-up.
This study addressed the need to jointly consider level of alcohol use and problems during the early recovery period in a sample of clinical adolescents. The study sample overlaps with that described in Maisto et al. (2002), which contrasted non-problem drinkers, defined a priori, with abstainers and problems drinkers; and with that used in Chung et al. (2004), a report that examined trajectories of alcohol use in relation to trajectories of other drug use. As an extension of those previous analyses, this study jointly characterized treated teens’ alcohol use in relation to alcohol symptom trajectories. Analyses tested the hypothesis that homogeneous subgroups based on pattern of monthly alcohol use and symptoms over 1 year would be identified, representing abstainers and continuing heavy drinkers, as well as improving and worsening course over time. In addition, this study estimated the joint probability of membership in alcohol use and symptom trajectories, testing the prediction that alcohol use and symptom trajectories would be moderately associated (i.e., low use will have high probability of low symptom severity overall, although some exceptions would be observed, such as heavy drinkers without symptoms). Further, symptoms related to impaired control over alcohol use behavior (i.e., difficulty quitting or cutting down on alcohol use; Quit/Cut Down) were predicted to be most common during the early recovery period, reflecting some treated teens’ difficulties in attempting to limit their drinking behavior.
2. Method
2.1. Participants
The sample included 109 adolescents (ages 14–18), recruited from addictions treatment (97% outpatient, 3% inpatient). All treatment programs had a goal of abstinence from alcohol and other nonprescribed drugs, and included components that involved understanding chemical dependency, developing relapse prevention skills, and addressing family issues related to substance use. The majority of participants were male (66%) and Caucasian (94%). African-Americans constituted 3% of the sample, and 3% were of other ethnicity (e.g., biracial). Participants had a mean age of 16.9 years (S.D.=1.0), and represented a broad range of socioeconomic status (Hollingshead, 1975), range=1–5 (mean=2.3, S.D.=0.9; 1=high socioeconomic status). At baseline, all participants met criteria for a DSM-IV lifetime alcohol use disorder (AUD) (50.5% abuse, 49.5% dependence), with the majority (92.7%) also meeting criteria for a lifetime non-alcohol substance use disorder (SUD). The mean DSM-IV lifetime alcohol symptom count at baseline was 5.1 (S.D.=2.4) symptoms. In the year prior to baseline, the average number of drinking days per month was 8.7 (S.D.=7.8).
2.2. Attrition analyses
Teens included in this study (n=109 [91%] out of a total of 120 adolescents [age 14–18] in the monthly follow-up study) provided at least 3 months of monthly data during the 1-year follow-up period (mean=9.9 monthly assessments, S.D.=2.7). Comparison of included (n=109) and excluded participants (n=11) resulted in no statistically significant differences on gender, ethnicity, SES, lifetime DSM-IV AUD or other SUD, global level of functioning at the baseline assessment, and quantity and frequency of alcohol use in the year prior to the baseline assessment (p’s > 0.10).
2.3. Procedure
The study sample shares some overlap with samples described in Maisto et al. (2002) and Chung et al. (2004). Study procedures have been detailed elsewhere (e.g., Chung et al., 2004; Maisto et al., 2002), and are presented briefly here. Prior to data collection, written informed consent was obtained from the adolescent, and for adolescents who were less than 18 years old, the teen provided assent and the teen’s legal guardian provided written informed consent for the teen’s participation. Shortly after the start of outpatient treatment or the end of inpatient treatment, teens completed a comprehensive baseline assessment of substance involvement and monthly phone interviews over 1-year follow-up, which were administered by highly trained master’s level clinical interviewers. Monthly phone assessments collected data on daily alcohol use using the Time Line Follow-Back method, as well as the presence of DSM-IV alcohol use disorder (AUD) symptoms in the past 30 days. To minimize missing data in the event that a monthly assessment was not completed as scheduled, interviewers asked participants to recall information for all previously missed 30-day reporting intervals that preceded the current assessment. Adolescents received gift certificates for study participation.
2.4. Alcohol use measure
The Time Line Follow-Back (TLFB) (Sobell & Sobell, 1992, 1995), which was administered monthly over the phone, collected data on daily quantity of alcohol use in each of the past 30 days over 1-year follow-up. TLFB data provided the basis for summary variables of number of alcohol use days per month. TLFB alcohol use data have good reliability and validity in adolescent samples (e.g., Donohue et al., 2004; Waldron, Slesnick, Brody, Turner, & Peterson, 2001). Collection of TLFB alcohol use data over the phone also has satisfactory reliability (Sobell & Sobell, 1995).
Preliminary analyses of TLFB alcohol use data indicated that number of alcohol use days per month was highly correlated with number of days on which 5 or more drinks were consumed (r’s across the 12 months=0.79–0.99, mean r=0.94, S.D.=0.06), total quantity of alcohol consumed per month (r’s=0.80–0.97, mean r=0.90, S.D.=0.06), and an alcohol use variable modeled in other research using this adolescent clinical sample (Chung et al., 2004), maximum consecutive days of abstinence from alcohol per month (r’s=−0.79-0.61, mean r=−0.74, S.D.=0.04). Given the high correlation among these alcohol use indicators, we decided to model frequency of alcohol use days, the most parsimonious and straightforward measure of alcohol use, in relation to DSM-IV AUD symptom counts for each month.
2.5. Alcohol symptom measure
A modified version of the Structured Clinical Interview for DSM-IV (SCID; First, Spitzer, Gibbon, & Williams, 1997; Martin, Pollock, Bukstein, & Lynch, 2000) was used to rate the presence of DSM-IV alcohol abuse and dependence symptoms in monthly phone interviews over 1-year follow-up. The modified SCID has demonstrated high interrater reliability (Martin et al., 2000), and concurrent validity (Martin, Kaczynski, Maisto, Bukstein, & Moss, 1995). The phone follow-up of the SCID coded the presence or absence of 10 DSM-IV AUD symptoms (withdrawal was not assessed due to its generally low prevalence among adolescents) for each 30-day interval. The 10 alcohol symptom variables for each month were summed to construct the monthly symptom count.
2.6. Data analysis
To identify a relatively small number of distinct short-term patterns of adolescent alcohol use and symptoms following treatment entry, we applied SAS Proc Traj to monthly data collected over 1 year. Proc Traj uses a semi-parametric, group-based modeling strategy to identify homogeneous latent trajectory classes based on longitudinal data (Jones, Nagin, & Roeder, 2001; Nagin, 2005). A particular advantage of the method is that it accommodates incomplete data using maximum likelihood estimation. We initially identified trajectory classes for alcohol use (i.e., number of alcohol use days per month) and alcohol-related symptoms separately, then estimated the joint probability of membership in the alcohol use and symptom trajectories. Joint estimation of trajectories for alcohol use and symptoms permits simultaneous examination of the linkage between two dimensions of alcohol involvement as they unfold over the entire observation period (Nagin, 2005; Nagin & Tremblay, 2001). Analyses tested trajectory models that specified data with a censored normal distribution, 2 to 6 groups, and a quadratic function as the highest order polynomial to estimate trajectory shape. The Bayesian Information Criterion (BIC), and the substantive utility of the classes (e.g., distinctiveness of the trajectories, proportion assigned to a given class) were used to determine the optimal solution for frequency of alcohol use and symptom trajectory groups.
3. Results
3.1. Treated adolescents’ alcohol use trajectories
In the total sample, mean number of alcohol use days per month ranged from 2.6 (S.D.=5.8) to 3.8 (S.D.=6.4) over 1 year, and followed a shallow U-shaped function (month 1 mean=3.4; month 12 mean=3.8) with somewhat lower mean values during months 4 to 9 (2.6 to 2.7 mean drinking days per month). The relatively large standard deviations suggested a considerable degree of variability, consistent with the possibility that more homogeneous subgroups based on pattern of alcohol use may be identified. A model that fit 4 trajectories to data on number of drinking days per month was selected as the best fitting solution, based on consideration of BIC (−1961.23), representation of substantively distinct trajectories of use, and distribution of cases across classes. Although BIC favored an increasing number of classes (e.g., 6-class BIC=−1950.04), increasing the number of classes split the group with the lowest number of drinking days into smaller groups, which did not substantively change the basic nature of the solution. In further support of the 4 group solution, average probability of group membership for the class with the highest posterior probability was relatively high (0.87–0.99 across the 4 classes). The 4 group solution (Fig. 1) included “Abstainers” (i.e., those with very little to no alcohol use; 31.2%), Low alcohol users (35.8%), Increasers (28.4%), and High users (4.6%). Eight adolescents reported complete abstinence from alcohol over 1-year follow-up, and all were classified in the Abstainer group. For Abstainers, mean drinking days per month over 12-month follow-up ranged from 0 to 0.5 days; for the Low use class, the range was 0.4–3.6 days; for Increasers, the range was 3.9–7.8 days; and for High use, the range was 14.6–24.0 days.
Fig. 1.
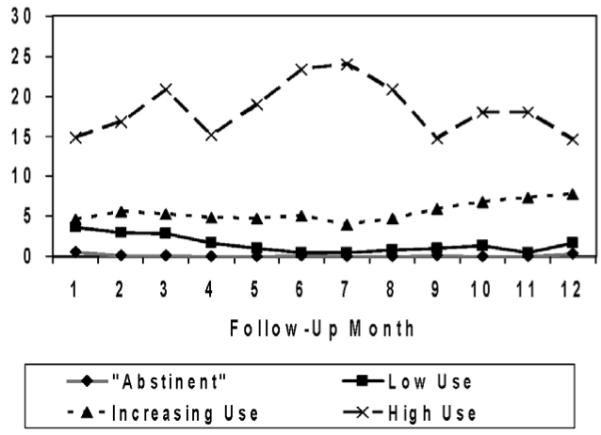
Mean number of drinking days by alcohol use trajectory groups over 1 year.
3.2. Alcohol symptom trajectories over 1 year
Mean number of alcohol symptoms per month in the total sample ranged from 0.6 (S.D.=1.3) to 1.3 (S.D.=2.0), with a slight decrease in mean number of symptoms over months 1–2 (from a mean of 1.3 to 0.9 symptoms), followed by a relatively stable low level of alcohol symptoms (0.7–0.9 symptoms). A model that fit 3 trajectories to data on DSM-IV alcohol symptom count per month was selected as the best fitting solution (BIC=−1148.50). The next best fitting models were the four (BIC=−1149.30) and five class (BIC=−1148.93)solutions. In support of the 3 group solution, average probability of group membership for the class with the highest posterior probability was relatively high (0.96) for all 3 classes. The 3 group solution for alcohol symptom count data (Fig. 2) included Very Low (44.0%), Mild (44.0%), and High (11.9%) severity classes. For the Very Low trajectory, mean alcohol symptom count over follow-up ranged from 0 to 0.5; for the Mild trajectory, the range was 0.4–1.6; and for the Severe trajectory, the range was 1.7–4.4 symptoms.
Fig. 2.
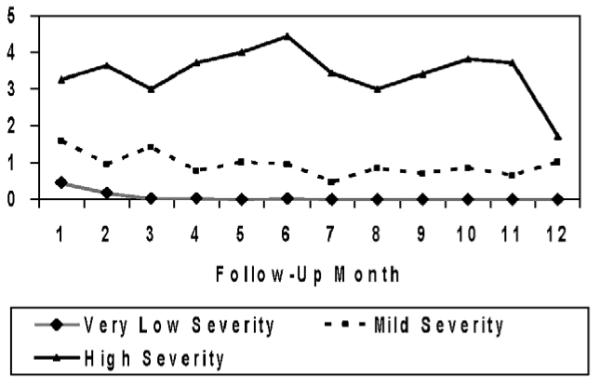
Mean DSM-IV symptom count by alcohol symptom trajectory groups over 1 year.
3.3. Type of alcohol symptoms reported during follow-up
The most frequently reported DSM-IV abuse symptoms (Table 1) were Interpersonal Problems (e.g., arguments with parents about alcohol use; average percent reporting the symptom each month: 24.0%, S.D.=8.4) and Hazardous Use (e.g., riding a dirt bike when intoxicated; average percent reporting the symptom each month: 16.4%, S.D.=4.0). Most alcohol abuse symptoms had relatively low, stable frequency of report over 1-year follow-up. However, Interpersonal Problems declined over follow-up, from 37% in month 1 to between 12% and 16% in months 11–12.
Table 1.
Mean percentage (S.D.) reporting DSM-IV alcohol symptoms each month over 1-year follow-up by symptom trajectory group
| DSM-IV alcohol symptom | Total sample (N =109) |
Very low severity (n =48) |
Mild severity (n =48) |
High severity (n =13) |
|---|---|---|---|---|
| A1: role impairment | 10.2 (3.3) | 0.5 (1.6) | 8.0 (5.2) | 22.7 (10.6) |
| A2: hazardous use | 16.4 (4.0) | 0.8 (2.6) | 15.8 (6.8) | 30.1 (12.3) |
| A3: legal problems | 5.1 (3.4) | 3.0 (7.6) | 5.3 (4.5) | 6.4 (7.1) |
| A4: interpersonal problems | 24.0 (8.4) | 4.4 (8.1) | 21.0 (9.7) | 48.7 (14.9) |
| D1: tolerance | 32.4 (4.8) | 3.0 (8.2) | 28.2 (5.9) | 66.8 (13.6) |
| D3: larger/longer | 24.7 (7.1) | 1.4 (4.8) | 26.0 (33.4) | 66.2 (12.4) |
| D4: quit/cut down | 21.7 (8.5) | 4.6 (8.5) | 20.3 (9.5) | 38.7 (14.4) |
| D5: much time using | 20.0 (4.6) | 0.5 (1.6) | 11.7 (3.1) | 56.9 (14.8) |
| D6: reduce activities | 11.7 (4.7) | 0.5 (1.6) | 6.4 (4.2) | 34.1 (11.8) |
| D7: physical/ psychological problems |
5.4 (2.9) | 0.0 (0.0) | 6.6 (4.8) | 6.9 (7.0) |
A1–A4=DSM-IV abuse criterion 1–4. D1–D7=DSM-IV dependence criterion 1–7.
The most commonly reported dependence symptoms (Table 1) included Tolerance (average percent reporting the symptom each month: 32.4%, S.D.=4.8), and two symptoms representing impaired control over alcohol use behavior (i.e., using more or longer than intended [Larger/Longer], average percent reporting the symptom each month: 24.7%, S.D.=7.1; and Quit/Cut Down, average percent reporting the symptom each month: 21.7%, S.D.=8.5). In contrast to other indicators of dependence, these two symptoms of impaired control over alcohol use tended to show greater fluctuation over time. Specifically, as depicted by the High Severity trajectory (Fig. 2), there was an increase in report of these twoimpaired control symptoms in months 5–6, followed by a waxing and waning course through 12 months.
Examination of type of symptom endorsed by symptom trajectory group generally indicated, for each symptom, on average over 1-year follow-up, an increasing proportion endorsing the symptom as severity of the symptom trajectory group increased (Table 1). These results suggest that the symptom trajectories were generally distinguished more by increasing number, rather than type, of symptoms endorsed.
3.4. Joint analysis of alcohol use and symptom trajectories
The highest joint probability (Table 2) involved Abstainers and Very Low symptom severity (.315), followed by Low alcohol use and Mild symptom severity (0.265). Examination of conditional probabilities indicated that Abstainers were almost certain (99.9%, S.E.=0.02) to be in the Very Low symptom severity class, while those in the Low alcohol use class were more likely to be in the Mild severity class (74.8%, S.E.=9.2) than the Very Low (25.2%, S.E.=9.2) or High (0.0%, S.E.=0.02) symptom severity classes. Those in the Increasing alcohol use class showed the greatest variability in short-term alcohol symptom severity class, with highest likelihood (58.7%, S.E.=10.5) of being in the Mild symptom severity class (for the Very Low severity class, 5.8%, S.E.=5.4; for the High severity class, 35.5%, S.E.=10.2). Those in the High alcohol use class were as likely to be in the Mild (41.9%, S.E.=22.4) or High (58.1%, S.E.=22.4) symptom severity classes. Cross-classification results suggested that alcohol use and symptom trajectories were moderately associated (χ2=77.7, df=6, p<0.001; phi=0.84).
Table 2.
Joint probability of classification in alcohol use and symptom severity trajectories
| Use trajectories | Symptom count trajectories |
||
|---|---|---|---|
| Very low severity (44%) | Mild severity (44%) | High severity (12%) | |
| “Abstinent” (31%) | 31.5% | 0.0 | 0.0 |
| Low use (36%) | 8.9 | 26.5 | 0.0 |
| Increasing use (28%) | 1.6 | 16.6 | 10.0 |
| High use (5%) | 0.0 | 2.0 | 2.8 |
4. Discussion
This study characterized heterogeneity in treated adolescents’ pattern of alcohol use and symptoms over 1-year follow-up. Relative to baseline level of alcohol involvement, treated adolescents appeared to show a reduction in alcohol use and symptoms that was generally maintained over short-term follow-up (cf. Williams et al., 2000). Among the four alcohol use trajectories (Abstainers, Low use, Increasing, High use) that were identified, Abstainer and Low use groups represented the majority of the sample. In addition, three alcohol symptom count trajectories (Very Low, Mild, and High severity) were identified, with most adolescents in the Very Low or Mild severity groups. As hypothesized, joint analysis of alcohol use and symptom trajectories indicated a moderate level of association between these dimensions of alcohol involvement over short-term follow-up. Those in the Increasing Alcohol Use group showed the most variability with regard to symptom trajectory group, possibly reflecting differences in the rating and timing of the increase in drinking behavior. Symptom-level data indicated, as predicted, that indicators of impaired control over alcohol use (i.e., Larger/Longer, Quit/Cut Down) were among the symptoms most commonly reported during the early recovery period.
The four alcohol use trajectories identified in this study share some similarities with trajectories that were identified based on monthly data representing maximum consecutive days of abstinence from alcohol (Chung et al., 2004). Specifically, the Abstainer trajectory in this study generally corresponds to the High Abstinence trajectory in Chung et al. (2004), the High Use trajectory to the Low Abstinence trajectory, and the Increasing Use trajectory to the Decreasing Abstinence trajectory. However, the Increasing Abstinence trajectory identified in the previous study does not directly correspond to any of the alcohol use trajectories identified in this study. The differences in the trajectories identified likely occurred because one indicator (i.e., maximum consecutive abstinent days) takes into account the temporal patterning of drinking episodes. For example, the same number of drinking days per month (e.g., 3 drinking days) may involve a relatively long period of abstinence (e.g., 20 days of abstinence followed by 3 consecutive days of use) or shorter periods of abstinence (e.g., drinking only on Saturday for 3 weeks). The differences in the alcohol use trajectories identified in the two studies highlight the importance of selecting an indicator of alcohol use in relation to a particular purpose, given that various indicators represent specific aspects of alcohol consumption.
In the total sample, mean alcohol symptom severity was generally low, and relatively stable over 1-year follow-up. The symptom trajectory groups did not appear to differ by type of symptom endorsed, but were largely distinguished by number of symptoms endorsed, as reported in other studies (e.g., Bucholz, Heath, & Madden, 2000; Chung & Martin, 2001). The relatively high prevalence and fluctuating short-term course of two symptoms of impaired control over alcohol use in this clinical sample of adolescents, however, warrant further fine-grained investigation, particularly among those in the High Alcohol Use group, because, as may be expected, level of alcohol use and difficulties controlling alcohol use appeared to change in parallel. Further research is needed to examine the direction of effects between drinking episodes and motivation to limit alcohol use (e.g., unidirectional or reciprocal influence models) to better understand how motivational factors and drinking behaviors influence one another during the early recovery period.
Joint estimation of alcohol use and symptom trajectories revealed a moderate longitudinal linkage between these two dimensions of alcohol involvement over 1 year. The highest joint probability involved Abstainers and Very Low symptom severity (32%). Of note, the “Abstainer” group includes all teens who reported abstinence from alcohol (7% of the sample), as well as those who reported relatively infrequent episodes of alcohol use each month (cf. Brown, D’Amico, McCarthy, & Tapert, 2001). Teens representing the joint Abstainer and Very Low symptom severity outcome, excluding the small number of complete abstainers, correspond to the group of “non-problem drinkers”, that was defined a priori in other research (Maisto et al., 2002). Significantly, joint estimation generated a similar group of “non-problem drinkers”, and combined them with the small number of complete abstainers. Combining non-problem drinkers with complete abstainers in a single trajectory group has some support, based on previous research, which indicated that psychosocial functioning of non-problem drinkers did not differ from that of abstainers over 1-year follow-up (Maisto et al., 2002). Joint estimation also provided for greater distinctions among the group of problem drinking teens through identification of severity-based symptom trajectory groups.
Joint analysis of alcohol use and problem status has important clinical implications for moving beyond defining treatment outcome in terms of an initial relapse episode to consideration of initial episodes of use in the context of a broader pattern of alcohol use, consecutive days of abstinence, and occurrence of alcohol-related problems. Trajectory analyses highlight how an initial episode of use following a period of abstinence (i.e., “relapse”) does not always signal a return to problem drinking, and may represent an adolescent’s early successive approximations toward a goal of decreasing use. Study findings also indicate that some youth appear to be able to reduce alcohol use to levels of non-problem drinking, suggesting the potential utility of considering treatment goals that are alternative to complete abstinence from alcohol for certain adolescents. Further, comparison of trajectories based on number of drinking days per month with maximum consecutive abstinent days per month indicates the importance of considering the temporal spacing of drinking episodes as another indicator of clinical course.
Certain clinical presentations identified through joint estimation warrant further study. In particular, teens who reported relatively high levels of alcohol use in the context of few alcohol-related symptoms represent an apparent discrepancy between level of use and symptoms. These teens may be engaging in relatively heavy alcohol use, but may not be attempting to limit their alcohol use. In addition, these teens may have experienced alcohol-related problems that do not appear to be covered by DSM-IV symptoms (e.g., victimization while intoxicated). Alternatively, teens with relatively low levels of use and relatively high rates of symptom endorsement represent another type of discrepancy that bears further investigation to better understand adolescents’ alcohol use patterns in relation to type of DSM-IV symptom reported during early recovery (e.g., some teens with low levels of alcohol use may meet Quit/Cut Down because they continue to have a strong desire and actively attempt to reduce their alcohol use).
Study limitations need to be considered. Generalizability of findings may be limited because teens were recruited from addictions treatment, and the majority of teens were Caucasian and male. Retrospective self-report data on alcohol use and symptoms, which may be subject to bias, were used. However, care was taken to reduce potential self-report bias by using a relatively short reporting interval, emphasizing confidentiality of data collection, and developing rapport during the assessment. The trajectories identified also suggest that distinct classes exist, although classes distinguished by clear boundaries are relatively rare (Nagin, 1999). Further, the relatively small sample size may have limited the number of trajectories identified, highlighting the need for replication of study results in other samples.
This study examined temporal linkages between changes in treated adolescents’ alcohol use and symptom occurrence over 1 year. Joint estimation of alcohol use and symptom trajectories indicated a moderate degree of association between these dimensions of use. A subgroup of treated teens who appear to engage in relatively infrequent alcohol use with few associated problems over short-term follow-up suggests the utility of considering treatment goals that are alternative to complete abstinence from alcohol for certain youth. Further research using fine-grained methods of data collection, such as monthly follow-ups, during the early recovery period are needed to identify factors that influence teens’ short-term alcohol involvement trajectories (e.g., comorbid psychopathology, other drug use, peer influences on alcohol use), and that predict fluctuations in teens’ motivation and ability to limit alcohol use.
Acknowledgements
This research and the preparation of this manuscript were supported by National Institute on Alcohol Abuse and Alcoholism K01 AA00324, R01 AA014357, K02 AA13252, K02 AA00249, and K01 AA13938. Portions of this paper were presented at the annual meeting of the Research Society on Alcoholism, Fort Lauderdale, Florida, June 2003.
References
- Abrantes A, McCarthy DM, Aarons GA, Brown SA. Trajectories of alcohol involvement following addiction treatment through 8-year follow-up in adolescents; Paper presented at the 2002 Research Society on Alcoholism meeting; San Francisco, CA. 2002, July. [Google Scholar]
- Brown SA, D’Amico EJ, McCarthy DM, Tapert SF. Four-year outcomes from adolescent alcohol and drug treatment. Journal of Studies on Alcohol. 2001;62:381–388. doi: 10.15288/jsa.2001.62.381. [DOI] [PubMed] [Google Scholar]
- Bucholz KK, Heath AC, Madden PAF. Transitions in drinking in adolescent females: Evidence from the Missouri adolescent female twin study. Alcoholism, Clinical and Experimental Research. 2000;24:914–923. [PubMed] [Google Scholar]
- Catalano RF, Hawkins JD, Wells EA, Miller JL. Evaluation of the effectiveness of adolescent drug abuse treatment, assessment of risks for relapse, and promising approaches for relapse prevention. International Journal of the Addictions. 1990–91;25:1085–1140. doi: 10.3109/10826089109081039. [DOI] [PubMed] [Google Scholar]
- Chung T, Maisto SA, Cornelius JR, Martin CS. Adolescents’ alcohol and drug use trajectories in the year following treatment. Journal of Studies on Alcohol. 2004;65:105–114. doi: 10.15288/jsa.2004.65.105. [DOI] [PubMed] [Google Scholar]
- Chung T, Martin CS. Classification and course of alcohol problems among adolescents in addictions treatment programs. Alcoholism, Clinical and Experimental Research. 2001;25:1734–1742. [PubMed] [Google Scholar]
- Chung T, Martin CS, Grella C, Winters KC, Abrantes AM, Brown SA. Course of alcohol problems in treated adolescents: Symposium proceedings of 2002 research society on alcoholism meeting. Alcoholism, Clinical and Experimental Research. 2003;27:253–261. doi: 10.1097/01.ALC.0000053009.66472.5E. [DOI] [PubMed] [Google Scholar]
- Donohue B, Azrin NH, Strada MJ, Silver NC, Teichner G, Murphy H. Psychometric evaluation of self and collateral time line follow-back reports of drug and alcohol use in a sample of drug abusing and conduct disordered adolescents and their parents. Psychology of Addictive Behaviors. 2004;18:184–189. doi: 10.1037/0893-164X.18.2.184. [DOI] [PubMed] [Google Scholar]
- First MB, Spitzer RL, Gibbon M, Williams JBW. Structured clinical interview for DSM-IV Axis I disorders, research version, non-patient edition. (SCID-I/NP) Biometrics Research, New York State Psychiatric Institute; New York: 1997. [Google Scholar]
- Hollingshead AB. Four-factor index of social status. Department of Sociology, Yale University; New Haven, CT: 1975. [Google Scholar]
- Jones BL, Nagin DS, Roeder K. A SAS procedure based on mixture models for estimating developmental trajectories. Sociological Methods and Research. 2001;29:374–393. [Google Scholar]
- Maisto SA, Martin CS, Pollock NK, Cornelius JR, Chung T. Non-problem drinking outcomes in adolescents treated for alcohol use disorders. Experimental and Clinical Psychopharmacology. 2002;10:324–331. doi: 10.1037//1064-1297.10.3.324. [DOI] [PubMed] [Google Scholar]
- Martin CS, Kaczynski NA, Maisto SA, Bukstein OG, Moss HB. Patterns of DSM-IV alcohol abuse and dependence symptoms in adolescent drinkers. Journal of Studies on Alcohol. 1995;56:672–680. doi: 10.15288/jsa.1995.56.672. [DOI] [PubMed] [Google Scholar]
- Martin CS, Pollock NK, Bukstein OG, Lynch KG. Inter-rater reliability of the SCID alcohol and substance use disorders section among adolescents. Drug and Alcohol Dependence. 2000;59:173–176. doi: 10.1016/s0376-8716(99)00119-2. [DOI] [PubMed] [Google Scholar]
- Nagin D. Group-based modeling of development. Harvard University Press; Cambridge, MA: 2005. [Google Scholar]
- Nagin DS. Analyzing developmental trajectories: A semi-parametric, group-based approach. Psychological Methods. 1999;4:139–177. doi: 10.1037/1082-989x.6.1.18. [DOI] [PubMed] [Google Scholar]
- Nagin DS, Tremblay RE. Analyzing developmental trajectories of distinct but related behaviors: A group-based model. Psychological Methods. 2001;6:18–34. doi: 10.1037/1082-989x.6.1.18. [DOI] [PubMed] [Google Scholar]
- Sobell LC, Sobell MB. Time-line follow-back: A technique for assessing self-reported alcohol consumption. In: Litten RZ, Allen JP, editors. Measuring alcohol consumption. Humana Press; Totowa, NJ: 1992. pp. 73–98. [Google Scholar]
- Sobell LC, Sobell MB. Assessment of drinking behavior. In: Allen JP, Columbus M, editors. Assessing alcohol problems. Humana Press; Bethesda, MD: 1995. pp. 55–74. [Google Scholar]
- Waldron HB, Slesnick N, Brody JL, Turner CW, Peterson TR. Treatment outcomes for adolescent substance abuse at 4- and 7-month assessments. Journal of Consulting and Clinical Psychology. 2001;69:802–813. [PubMed] [Google Scholar]
- Williams RJ, Chang SY, Addiction Centre Adolescent Research Group A comprehensive and comparative review of adolescent substance abuse treatment outcome. Clinical Psychology: Science and Practice. 2000;7:138–166. [Google Scholar]