

Abstract
Diffusive mass transfer in biofilms is characterized by the effective diffusion coefficient. It is well-documented that the effective diffusion coefficient can vary by location in a biofilm. The current literature is dominated by effective diffusion coefficient measurements for distinct cell clusters and stratified biofilms showing this spatial variation. Regardless of whether distinct cell clusters or surface-averaging methods are used, position-dependent measurements of the effective diffusion coefficient are currently: 1) invasive to the biofilm, 2) performed under unnatural conditions, 3) lethal to cells, and/or 4) spatially restricted to only certain regions of the biofilm. Invasive measurements can lead to inaccurate results and prohibit further (time-dependent) measurements which are important for the mathematical modeling of biofilms. In this study our goals were to: 1) measure the effective diffusion coefficient for water in live biofilms, 2) monitor how the effective diffusion coefficient changes over time under growth conditions, and 3) correlate the effective diffusion coefficient with depth in the biofilm. We measured in situ two-dimensional effective diffusion coefficient maps within Shewanella oneidensis MR-1 biofilms using pulsed-field gradient nuclear magnetic resonance methods, and used them to calculate surface-averaged relative effective diffusion coefficient (Drs) profiles. We found that 1) Drs decreased from the top of the biofilm to the bottom, 2) Drs profiles differed for biofilms of different ages, 3) Drs profiles changed over time and generally decreased with time, 4) all the biofilms showed very similar Drs profiles near the top of the biofilm, and 5) the Drs profile near the bottom of the biofilm was different for each biofilm. Practically, our results demonstrate that advanced biofilm models should use a variable effective diffusivity which changes with time and location in the biofilm.
Keywords: biofilm, diffusion coefficient, diffusivity, in situ, mass transfer, magnetic resonance imaging, nuclear magnetic resonance, pulsed-field gradients, Shewanella oneidensis
Introduction
Mass transfer inside a biofilm occurs through both advection and diffusion processes (de Beer et al. 1994). In most biofilms, diffusion controls mass transfer (Beuling et al. 1998; Beyenal and Lewandowski 2007; Phoenix and Holmes 2008; Xia et al. 1998). Practically, a knowledge of mass transfer is needed to predict the activity of biofilms, to predict nutrient and metabolic end-product transport, to determine antibiotic penetration in biofilms, and to model subsurface biofilms and optimize bioremediation strategies.
Diffusive mass transfer in biofilms is characterized by the effective diffusion coefficient (De) (IUPAC 1997). Despite biofilms generally having heterogeneous morphologies, the effective diffusion coefficient has been assumed to be constant throughout the biofilm in mathematical models describing biofilm activity and behavior. This approximation is mainly motivated by experimentally measured average effective diffusion coefficients for entire biofilms (Converti et al. 1996; Stewart 1998; Zhang et al. 1998). However, experimental evidence suggests that the effective diffusion coefficient is position-dependent and the constant-coefficient assumption needs to be modified.
Several researchers have measured effective diffusion coefficients in distinct cell clusters. Lawrence et al. (1994) used fluorescence recovery after photobleaching (FRAP) with scanning confocal laser microscopy (SCLM) to measure the effective diffusion coefficients of fluorescein and fluor-conjugated dextrans in Pseudomonas and mixed-species biofilms. Similar methods were used by De Beer et al. (1997) for determining effective diffusion coefficients in spatially distinct cell clusters and interstitial voids in Klebsiella and Pseudomonas biofilms. Bryers and Drummond (1998) used layered horizontal FRAP scans to determine volume-averaged effective diffusion coefficients for dextran and to distinguish biofilm regions with different densities. More recently, the effective diffusion coefficient of fluorescently tagged daptomycin was measured in Staphylococcus epidermidis biofilm cell clusters using SCLM (Stewart et al. 2009).
Other researchers have measured the variation of effective diffusion coefficients in stratified layers of biofilms. In this technique, the effective diffusion coefficient is calculated for two-dimensional (2D) parallel slices through a biofilm. These measurements yield surface-averaged effective diffusion coefficients (Des) which allow us to determine the diffusion coefficient profile through the depth of the biofilm. Bishop et al. (1995) used a microtome to section frozen biofilms into 10-20 μm parallel layers and calculated Des from the measured structural properties of each layer. They found that the effective diffusion coefficient decreased toward the bottom. This technique unavoidably perturbs cells within the biofilm and damages its structure. Beyenal et al. (1998) averaged the diffusion coefficients of ferricyanide over 225 μm × 225 μm slices parallel with the bottom of the biofilm through several biofilms. This technique used potassium ferricyanide, which deactivated the biofilms, and a microelectrode that invasively measured ferricyanide flux. Although this method is quite effective for measuring local effective diffusion coefficients to micron-level resolution, it cannot be used near the bottom of the biofilm (0-60 μm from the bottom) because of the mass transfer limitations around the microelectrode tip when it is near a solid surface.
Regardless of whether distinct cell cluster or surface-averaging methods are used, the position-dependent measurements of effective diffusion coefficients are: 1) invasive to the biofilm, 2) performed under unnatural conditions, 3) lethal to cells, and/or 4) spatially restricted to only certain regions of the biofilm. Invasive measurements can lead to inaccurate results and prohibit further (time-dependent) measurements which are important for the mathematical modeling of biofilms. There is a need to measure diffusive properties in situ at a high resolution (microscale) without affecting biofilm structure or function.
Nuclear magnetic resonance (NMR) is a noninvasive technique that overcomes the limitations of the competing methods for measuring effective diffusion coefficients in biofilms. In particular, pulsed-field gradient NMR (PFG-NMR) is a sensitive tool that uses the nuclear magnetic spin properties of nuclei (typically 1H in water) as a tracer for Brownian motion (Stejskal and Tanner 1965). PFG-NMR methods have been used to measure effective diffusion coefficients in biofilms and other heterogeneous systems. Beuling et al. (1998) used PFG-NMR to measure the rate of diffusion of water in both natural and artificial biofilms. Vogt et al. (2000) employed a combination of bulk-water suppression and spectrally resolved diffusion to measure the De of three distinct water environments and unidentified chemical components in Pseudomonas aeruginosa biofilms. In these studies, the biofilms were not kept in life-sustaining conditions and the measurements were not spatially resolved. Wieland et al. (2001) used both a multiple-spin-echo (PFG CPMG) sequence and a pulsed-field gradient turbo spin echo (PFG TSE) sequence to map diffusion coefficients and water densities for natural microbial mats and to generate their diffusion coefficient depth profiles. Manz et al. (2003) used PFG-NMR to study the effects of biofilm structure on local fluid velocity. Similarly, PFG-NMR was used by Seymour et al. (2007) to study velocity and transport processes in a biofouled polystyrene-bead packed column. Phoenix and Holmes (2008) measured local surface-averaged diffusion coefficients in an unsustained phototrophic biofilm using PFG-NMR. They averaged the diffusion coefficients on 1 mm × 26 mm slices to create a Des profile through the biofilm. The individual voxels were larger than most natural biofilms. NMR has also been used to measure in situ diffusion coefficients of iron bound to ethylenediaminetetraacetate (EDTA) in methanogenic granules (Bartacek et al. 2009). Bartacek et al. monitored the concentration of the iron–EDTA complex within the granule over time to determine the diffusion coefficients.
Recently McLean et al. (2008b) measured in situ effective diffusion coefficient depth profiles for water in biofilms at the microscale using PFG-NMR methods. In this study we extend that work to 2D measurements to provide greater spatial resolution. Our goals are: 1) to measure the effective diffusion coefficient of water in live, metabolically active biofilms, 2) to monitor how the effective diffusion coefficient changes within the biofilms as a function of time, and 3) to correlate the effective diffusion coefficient with the depth in the biofilms. Two-dimensional effective diffusion coefficient maps in Shewanella oneidensis MR-1 biofilms were measured using PFG-NMR imaging, and from these maps 1D surface-averaged effective diffusion coefficient profiles were generated. All the results are presented as relative effective diffusion coefficients. Our long-term goal is to predict the mobility of heavy metals in subsurface biofilms. Therefore we selected a model microorganism, S. oneidensis MR-1, which is a dissimilatory metal-reducing bacteria.
Materials and Methods
Reactor for growing biofilms
The biofilms were grown using a constant depth film fermenter (CDFF) (Peters and Wimpenny 1988). The CDFF consisted of a rotating turntable which held fifteen polytetrafluoroethylene (Teflon®) pans located flush around its rim. Each pan contained five cylindrical sample wells (5 mm in diameter each) holding Teflon® plugs. Planar No. 1 glass coverslips (BellCo Glass, Vineland, NJ), 5 mm in diameter and 160 μm thick, were placed on top of the Teflon® plugs and were recessed to a depth of 400 μm using a custom gap-setting tool. The inoculum and growth medium were introduced through ports located at the top of the CDFF. The air inlet and sample removal ports were also located at the top of the CDFF and effluent exited from the bottom of the CDFF. Two Teflon® blades, situated above the rotating turntable, sheared the plate surface, removing excess biomass to control the depth of the developing biofilm. The medium was dripped onto the turntable pans from a height of 15 mm directly in front of one of the blades. A detailed description of the CDFF along with figures are given in Pratten (2007). As in many other biofilm reactors, biofilm growth in a CDFF is dominated by the diffusion of nutrients (Chang et al., 2003).
Growing the biofilms
Biofilms of S. oneidensis strain MR-1 were used for this study. The inoculum was prepared by adding 1 mL of stock S. oneidensis MR-1 culture to 100 ml (20 g/L) of lysogeny broth. It was allowed to grow for 24 hours under shaking conditions at 30°C. Approximately 50 mL of the inoculum was pumped at 0.3 mL/min into a clean and autoclave-sterilized CDFF. The rotation rate of the turntable was 8 rpm at all times except directly after inoculation, at which time the culture feed and the turntable rotation were stopped for one hour to allow for initial cell attachment. After inoculation, a feed of sterile chemically defined minimal medium (slightly modified from McLean et al. (2008a); see supplementary material SI Table 1) was pumped in at 0.3 mL/min. The medium was designed to be compatible with NMR measurements: paramagnetic metal salts were used in concentrations that were non-interfering. The CDFF was operated in an incubator at 30°C. The pressure within the CDFF was kept at equilibrium with filtered (0.2 μm) atmospheric air: therefore ambient O2 concentrations were maintained at all times. Normal growth conditions were continued after inoculation until the biofilm samples were harvested and aseptically collected through the sample port and transferred to the NMR.
Biofilms were allowed to grow for predetermined times (4 days, 8 days, and 10 days) and then removed from the CDFF. From this point on, the biofilms will be referred to as the “4-day-old biofilm,” the “8-day-old biofilm,” and the “10-day old biofilm,” respectively, even though the age of the biofilms continued to increase inside the NMR. Each biofilm was transferred into the NMR for measurements, and the biofilms continued to grow in the NMR under continuous feed conditions for an additional 1 to 6 days.
NMR biofilm reactor
Each CDFF-grown sample was transferred to a specially designed NMR biofilm reactor to allow the biofilm to continue to grow inside the NMR. The reactor was constructed from Torlon® polyamide-imide plastic (Figure 1). Its single-pass flow system consisted of a medium reservoir bottle, a pulseless dual syringe pump (Pharmacia P-500, Uppsala, Sweden), the NMR biofilm reactor (inside the NMR magnet), and a waste reservoir bottle connected in series with polyetheretherketone (PEEK) plastic tubing. Drip-isolation tubes were placed upstream of the reactor to minimize microbial growth and avoid contamination. Figure 1 shows the NMR biofilm reactor and its location in the NMR probe. The inside of the chamber was 40 mm long, 4 mm wide, and 2 mm tall, giving a total liquid volume of 320 μL. When installed in the magnet, the normal direction to the coverslip surface was perpendicular to the magnet bore and coincident with the Helmholtz radiofrequency detection coil axis.
Figure 1.
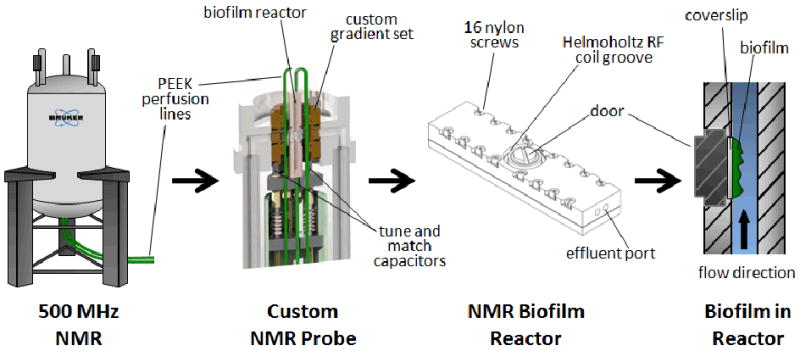
Experimental arrangement for NMR of biofilms. The illustrations show (from left to right): the vertical bore superconducting magnet with perfusion lines leading to the bottom-loaded NMR probe; a cutaway view of the custom NMR probe, shown holding the NMR biofilm reactor; an external view of the NMR biofilm reactor; and a cutaway view of the NMR biofilm reactor containing a perfused biofilm (medium flowing against gravity).
The influent medium flowed against gravity, and the effluent flow was routed to a waste vessel. O2-saturated minimal medium (SI, Table 1) was pumped through the reactor at a rate of 1 mL/h, which resulted in a laminar flow profile (Reynolds number of 0.1). The hydraulic retention time was 19.2 minutes (dilution rate of 3.13 h-1). A temperature-controlled gas stream delivery unit (FTS Systems, Stone Ridge, NY, USA) maintained a purge of nitrogen gas in the magnet bore and around the sample chamber, keeping the reactor and perfusion lines in the bore at 30 ± 0.2 °C.
NMR measurements and calculations for diffusion coefficient profiles
To measure rates of diffusion of water using NMR, the sample is subjected to a series of pulsed magnetic field gradients (PFG) that encode each hydrogen atom's displacement into its signal phase. This displacement information is preserved in the magnitude of the NMR signal and represents the vector sum of all spins within the volume of measurement. The signal attenuation effects of molecular diffusion are described by the Bloch-Torrey differential equation for transverse magnetization in the presence of a magnetic field gradient (Torrey 1956). The general expression for NMR signal attenuation due to diffusion is given by
| Equation 1 |
where M is the observed NMR signal intensity, M0 is the signal intensity in the absence of gradients, D is the diffusion coefficient, and b is the b-factor (or diffusion-weighting factor) (Le Bihan 1990). The b-factor, is dependent upon the timings (t) and amplitudes (G) of all gradient pulses and the gyromagnetic ratio (γ) for the nucleus of detection, forming expressions of the general form:
| Equation 2 |
where the sum includes cross product terms for interacting gradient pulses. Thus, by measuring the signal for a variety of b-factors, it is possible to solve for D in Equation 1. Furthermore, because the NMR signal is spatially dependent in the presence of a gradient magnetic field, it is possible to obtain spatially resolved diffusion coefficient measurements.
The NMR signal intensity of protons is measured in order to determine the diffusion coefficients of water. This is possible because the substantial majority of the protons in the sample are bound in H2O molecules. Due to the self-ionization of water, a small fraction of the protons are found as hydronium ions. However, because the NMR signal is proportional to concentration, these hydrated protons (∼10-7 molar) do not affect the measurement of the water (effective concentration of ∼102 molar). Other protons that are present in the sample, such as those in various organic molecules, have a negligible effect because they also have very small concentrations and they may be bound in the biofilm matrix or in the cell, which further reduces NMR signal intensity. Therefore, it is possible to measure the NMR signal of protons to determine the diffusion coefficients of water using Equation 1.
All NMR measurements were performed at 500.44 MHz for protons (1H) using a Bruker Avance digital NMR spectrometer (Bruker Instruments, Billerica, MA, USA) with an 11.7-T, 89‐mm vertical bore, actively shielded superconducting magnet. Bruker software TopSpin v1.5 and ParaVision v4.0 imaging software was used to collect and process the data. Measurements included 1) rapid multidirectional NMR imaging to verify correct sample positioning and the absence of gas bubbles, 2) two-dimensional Fourier transform (2DFT) MRI, and 3) diffusion-mapping 2DFT MRI. The field of view dimensions were 3.84 mm in the biofilm depth direction and 8.00 mm in the flow direction for both the MRI and diffusion mapping measurements. A total of 512 complex points were sampled at a rate of 98 Hz in the depth direction, with 32 phase-encoding steps, for an in-plane resolution of 7.50 by 250 μm. For diffusion mapping, the standard diffusion tensor imaging Paravision method (DtiStandard) was employed with a repetition time of 1000 milliseconds, an echo time of 25 milliseconds, and 24 averages. The pulse gradient width (∂) was 2 milliseconds and the diffusion time interval (Δ) was 10 milliseconds. The imaging sequence was repeated with six different b-factors —1, 10, 375, 750, 1125, and 1500 s/mm2 (aligned with the slice direction)—for a total measurement time of 77 minutes.
Two-dimensional diffusion maps were generated by processing the individual images (Gaussian noise filtering followed by fast 2DFT processing), and then performing a semilogarithmic analysis of the b-factor-dependent intensity values of each image pixel above a preset noise threshold in accord with Equation 1. The center voxels of the 2D diffusion maps (corresponding to the central 2 mm by 2 mm portion of the biofilm) were averaged to yield a depth-dependent Des profile. The central 2 mm by 2 mm voxel location and size were used to insure that measurements were taken where the magnetic field had the highest homogeneity.
Figure 2 schematically describes the process required to generate the diffusion coefficient profiles. The direct measurements from the NMR result in a 2D De map. The middle 2 mm of the biofilm are averaged along the x-direction to create a z-dependent profile. Surface-averaged relative effective diffusion coefficient (Drs) profiles are calculated by dividing the effective diffusion coefficient of water by the bulk liquid diffusion coefficient of water (Daq). The expression for a surface-averaged relative effective diffusion coefficient is given by:
Figure 2.
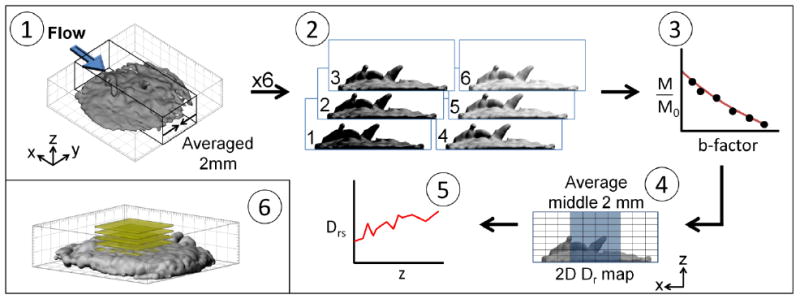
Steps for obtaining a diffusion coefficient profile: 1) The NMR measurements experimentally provided averaging in the y-direction. A 2-mm-thick slab aligned normal to that direction was selected and spatially resolved in the x- (phase encode) and z-directions. 2) A series of six diffusion-weighted 2D images was collected, each having a unique b-factor value. 3) A semilogarithmic fit was performed to find the diffusion coefficient value for each pixel location. 4) The result is a 2D (x-z) map of effective diffusion coefficients (in which the diffusion rate is modulated by spatial hindrance because of the presence of biomass). 5) To obtain the depth-resolved surface-averaged effective diffusion coefficient profiles, image pixels corresponding to the middle 2 mm of the sample were averaged along the x-axis. 6) A 3D MRI image of the 10-day-old biofilm (yellow slices show the final shape and location of the apparent surface averaging slices) was used to produce the diffusion coefficient profiles.
| Equation 3 |
Each data point in the profile thus represents the average of the effective relative diffusion coefficients across a 2 mm × 2 mm surface area that is concentric with the coverslip. Figure 2 panel 6 shows a volume-filled 3D MRI of the 10-day-old biofilm with slices depicting the apparent locations of the surface-averaging calculations. MRI data were used to determine the locations of biofilm interfaces, including the top and bottom of the biofilm. The diffusion coefficient in the bulk solution (Daq) was calculated approximately 1000 μm above the biofilm surface.
Imaris v6.1.5 image rendering software (Bitplane, Zurich, Switzerland) was used to process the 3D data and construct a 3D biofilm image. All other calculations were performed in Excel 2007 (Microsoft, Redmond, Washington, USA).
Figure 3 shows an example of a 2D relative effective diffusion coefficient (Dr) map obtained for the 10-day-old biofilm. Maps similar to Figure 3 were used to generate the Drs profiles which are presented in the following sections of the paper.
Figure 3.
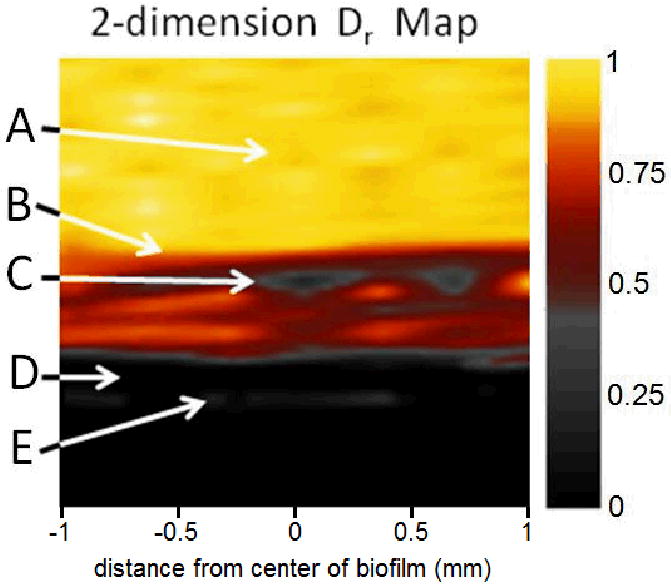
2D relative effective diffusion coefficient (Dr) map of the NMR biofilm reactor obtained by PFG-NMR. The central 2 mm of the 10-day-old biofilm are shown. A) The bulk liquid (yellow) flowing above the biofilm, B) the top of the biofilm (yellow/red interface), C) a low-diffusion region in the biofilm (gray), D) the coverslip that supports the biofilm (black), and E) a thin layer of water trapped between the coverslip and the reactor door.
Results and Discussion
Table 1 compares the diffusion coefficients in the bulk liquid (Daq) in this and previous literature studies. The Daq values we measured are similar (1% difference) to the values obtained by Simpson and Carr (1958), who used NMR, and fall within the error range that they reported. However, Beuling et al. (1998) reported slightly higher values (10%). Since Beuling et al. (1998) and Carr (1958) measured Daq in pure water and we measured in a chemically defined microbial growth medium, small differences were expected. In summary, Table 1 confirms that our microscale measurements are comparable.
Table 1.
Diffusion coefficients for the bulk liquid (Daq) for our work and literature values at 30°C.
| Study | Daq [m2/s] |
|---|---|
| This study | 2.42 · 10-9 |
| Beuling et al., 1998 | 2.68 · 10-9 |
| Simpson and Carr, 1958 | 2.46 · 10-9 |
Drs changes with distance and biofilm age
Figure 4 shows the variation of Drs with position for biofilms harvested from the CDFF reactor at different ages: 4 days, 8 days, and 10 days. The Drs is around 1 near the biofilm surface and in the bulk liquid for all biofilms. For the 4-day-old biofilm, Drs decreases approximately linearly to a value of 0.65 at the bottom of the biofilm. Similar linear profiles, which were measured using microelectrodes for diffusion coefficients of ferricyanide, were observed by Beyenal et al. (1998) in 5-day-old mixed-species biofilms. The two older biofilms demonstrate a different profile, in which Drs decreases for approximately 200 μm and then begins to increase irregularly near the bottom of the biofilms. The 8-day-old biofilm has a Drs local minimum near the middle of the biofilm, and Drs subsequently rises again near the bottom. The 10-day-old biofilm shows an even more drastic decline in Drs in the middle region. For all biofilms, the profiles show an overall decrease from top to bottom. The average relative effective diffusion coefficient (Dr, which is Drs averaged across the entire profile) is 0.89, 0.92, and 0.78 for the 4-day-old, 8-day-old, and 10-day-old biofilms, respectively.
Figure 4.

In situ Drs profiles of three S. oneidensis MR-1 biofilms, shown from the bottom to the top of the biofilm: A) a 4-day-old biofilm, B) an 8-day-old biofilm, and C) a 10-day-old biofilm. Biofilms of different ages showed different profiles.
The link between the biofilm dry weight density (X) and Drs can be approximated by (Fan et al. 1990):
| Equation 4 |
We used this equation to reveal the trend that the diffusion coefficient decreases when the biofilm density increases. Consequently, we believe that the middle of the biofilm becomes denser as the biofilm age increases. For older biofilms (more than 8 days), less substrate is delivered to the bottom of the biofilm and the cells near the bottom starve due to diffusion limitations. Starvation can change cell phenotype and may lead to cell cluster hollowing (“seeding dispersal”). Cluster hollowing has been observed by previous researchers, for example Stewart et al. (2007), who noted hollowing in 2-day-old Staphylococcus epidermidis biofilms. Similarly, McLean et al. (2008a) monitored the hollowing effect in S. oneidensis MR-1 biofilms. They suggested the limitation of substrate, the buildup of metabolites, or both, were likely responsible for the hollowing effect. We should note that the tops of the cell clusters were detached at the end of the hollowing effect observed by Stewart et al. and McLean et al. In our case, the biofilm was still intact at the end of experimentation, but with decreasing cell density near the bottom of the biofilm.
Drs near the surfaces of the biofilms
Figure 5 shows the Drs profile between the free surface of each biofilm and the local minimum found in the middle of the biofilm, except for the 4-day-old biofilm, for which the entire profile is shown. The mean trend for all biofilms is shown as the gray trend line, where the value at the bulk liquid interface is set to 1. It is important to note that the bulk liquid interface of all biofilms starts with a Drs value of 1 (± 0.02) and that the profiles have an initially shallow slope. This is likely due to both the nature of the biofilm and the surface-averaging process. Biofilm surfaces are highly mottled regions with pockets, “finger-like” towers, and a rough morphology.
Figure 5.
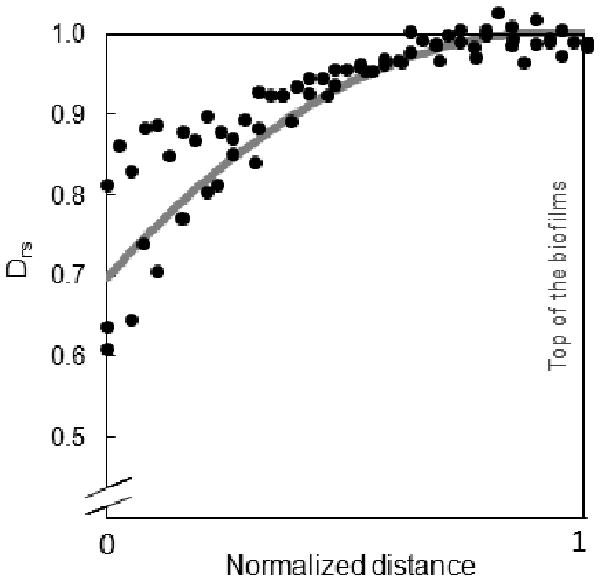
Superimposed Drs data points near the free surface of each biofilm. The data points were taken from the local minimum in the middle of each biofilm (normalized to 0) to its top (normalized to 1). An exponential decay fit to the data is shown in gray.
Figure 5 qualitatively shows that all biofilms had comparable smoothly decreasing and consistently concave-down profiles near the top, regardless of age. Our research group has repeatedly measured the metabolic activity of biofilms using a dissolved oxygen microelectrode. We found that, on average, oxygen is consumed in the first 100 μm from the top of the biofilm. Thus, it appears that the characteristic diffusion coefficient depth corresponds closely to the metabolically active region of the biofilm.
A smooth profile such as that depicted in Figure 5 is commonly used in biofilm modeling and may be appropriate for modeling young biofilms. However, when modeling older biofilms or biofilm growth over time, it appears that the variation of effective diffusion coefficient with distance should be considered. Modelers should take into account that biofilms can have variable densities and grow nonlinearly. Certain regions of a biofilm demonstrate higher diffusion limitations and receive limited amounts of nutrients, and complex mass transfer can be dominant in these regions. This can lead to complicated Drs profiles such as those shown in Figure 4.
Drs changes over time
In addition to age dependence, individual biofilms were monitored for Drs variation with time while they continued to grow in the NMR reactor. Figure 6 compares the profiles of the 8-day-old and the 10-day-old biofilms, directly after transfer to the NMR (marked as time = 0, for both) and 50 h and 97 h later, respectively. Although the numerical values of Drs are different, the initial profiles look similar. Both biofilms were around 350 μm thick, and there was a linear decrease of Drs near the surface. Both biofilms became less permeable with time and biofilm thickness increased, especially for the 10-day-old biofilm, for which the bulk liquid interface shifted from approximately 350 μm to 450 μm. The 10-day-old biofilm also showed a significant change near the middle region as Drs declined from 0.6 to 0.3. These results are consistent with the biomass density in this region increasing, causing a restriction in mass transfer through the biofilm. This is possibly due to bacterial growth, cell multiplication, and/or increased extracellular polymeric substances (EPS) formation.
Figure 6.

Drs profiles of the 8-day-old biofilm directly after harvest (time = 0 hours) and after growth in the NMR (time = 50 hours), and of the 10-day-old biofilm directly after harvest (time = 0 hours) and after growth in the NMR (time = 97 hours).
Figure 7 presents 3D MRI isocontour perspective images for the 8-day-old biofilm, which show the variation of biofilm structure in 3D over time. The protruding “fingers” present at time 0 h appear to be attached to the bulk biomass at t = 50 h. Also, many regions within the biofilm appear to be thicker and more uniform at t = 50 h. At the biofilm surface, cell clusters do not appear simply to grow uniformly in all directions. This type of nonuniform growth is common in recent biofilm models and it is believed that the mass transfer controls the shape of the cell clusters (Ebrahimi et al. 2005; Kreft et al. 2001; Picioreanu et al. 1998; Picioreanu et al. 2000; Xavier and Foster 2007). Our experimental data support the idea that the growth of a biofilm in three dimensions is not a simple (consistent and even) expansion. As demonstrated in Figure 6, internal structural changes are also very pronounced. These results (Figures 6 and 7) collectively demonstrate that physical changes affecting mass transfer occur both internally in the biofilm via increasing density, and externally as the biofilm-liquid interface expands.
Figure 7.
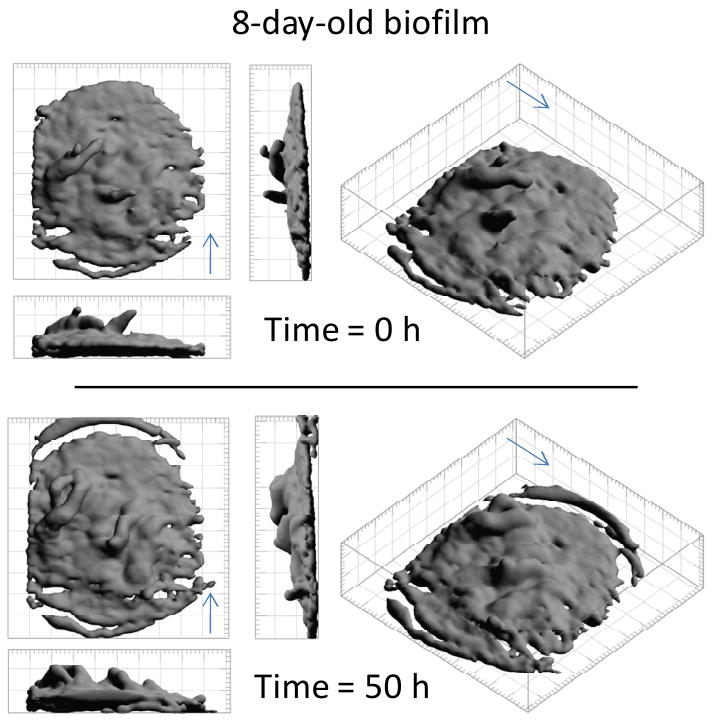
3D MRI isocontour images of the 8-day-old biofilm at 0 hours and 50 hours. The arrows show the direction of fluid flow.
Drs and biofilm structure
To understand how morphology relates to diffusion coefficients, a 2D MRI intensity image of each biofilm was acquired. Figure 8 shows the MRI water image overlaid with the corresponding Drs profile for each biofilm. On the coverslip surface (no signal) the base of the biofilm is clearly distinguishable from the monochromatic bulk liquid. A bright boundary layer is observed between the biofilm and the bulk liquid, with more signal intensity than the bulk liquid; this is a common effect caused by a biofilm surface-enhanced reduction of the T1 relaxation rate for water in conjunction with local water exchange (Hoskins et al. 1999). Within the interior of a biofilm, reduced signal is a qualitative indication of water being excluded by solid or gaseous objects (i.e. dense cellular biomass, EPS, bubbles, etc.). The middles of the biofilms appear denser than the regions near the interfaces of the coverslip and the bulk liquid, which is in agreement with the diffusion coefficient data.
Figure 8.
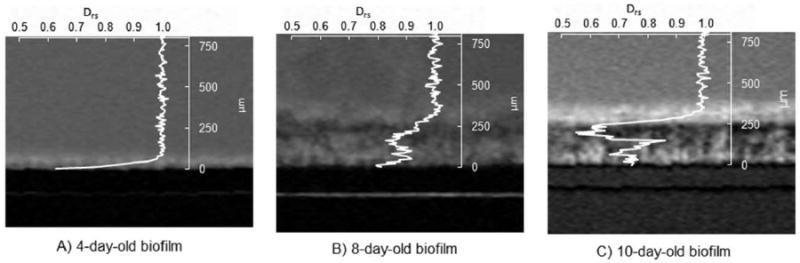
Drs profiles overlaid with the corresponding water-selective 2D MRI images of the flow chamber (and biofilms) for A) the 4-day-old biofilm, B) the 8-day-old biofilm, and C) the 10-day-old biofilm.
Several correlations between the MRI intensity images and the Drs profiles can be seen. One correlation is between the change in the Drs profile and the bulk liquid biofilm interface. Drs is constant in the bulk medium and decreases in the presence of the biofilm. Therefore we believe that diffusion coefficient measurements could be used to determine the surface of the biofilm in situations in which images of the biofilm are not available. They may be more reliable, as the boundary-layer relaxation contrast seen in the MRI does not influence the diffusion profiles. A second correlation is observed between the decrease in Drs near the middles of the two older biofilms and the low MRI intensity (darker contrast) for the same region.
Conclusions
In this study, we measured in situ surface-averaged relative effective diffusion coefficient profiles in living biofilms using a noninvasive technique. We conclude that 1) overall, Drs decreases from the top of the biofilm toward the bottom; 2) Drs profiles differ for biofilms of different ages, 3) Drs profiles change with time, generally decreasing with time, 4) all the biofilms showed very similar Drs profiles near the top of the biofilm, and 5) the Drs profile near the bottom of the biofilm was different for each biofilm. Further biofilm modeling using our findings may lead to the development of a governing model for estimating depth-dependent effective diffusion coefficients relating to the age of a particular biofilm.
Supplementary Material
Acknowledgments
This research was supported by the Office of Science (BER), U.S. Department of Energy, Grant No. DE-FG02-08ER64560. The custom-built NMR microscopy and biofilm reactor hardware development was supported by NIH (NIDCR) R21 DE017232. The work was performed in the Environmental Molecular Sciences Laboratory (a national scientific user facility sponsored by DOE Biological and Environmental Research) located at the Pacific Northwest National Laboratory and operated for DOE by Battelle. Ryan Renslow acknowledges NIH Training Grant T32-GM008336.
Nomenclature
- ∂
pulse gradient width (for diffusion tensor imaging measurements) [ms]
- Δ
diffusion time interval (for diffusion tensor imaging measurements) [ms]
- γ
gyromagnetic ratio [radian · s-1 · T-1]
- b
b-factor [s · m-2]
- D
diffusion coefficient [m2 · s-1]
- Daq
bulk liquid diffusion coefficient [m2 · s-1]
- De
effective diffusion coefficient [m2 · s-1]
- Dr
relative effective diffusion coefficient [dimensionless]
- Des
surface-averaged effective diffusion coefficient [m2 · s-1]
- Drs
surface-averaged relative effective diffusion coefficient [dimensionless]
- G
amplitude of gradient pulses [T/cm]
- M
observed NMR signal intensity [a.i.]
- M0
NMR signal intensity in the absence of gradients [a.i.]
- t
timing of gradient pulses [ms]
- T1
spin-lattice relaxation time [s]
- X
average biofilm dry weight density [kg · m-3]
Works Cited
- Bartacek J, Vergeldt FJ, Gerkema E, Jenicek P, Lens PNL, Van As H. Magnetic resonance microscopy of iron transport in methanogenic granules. Journal of Magnetic Resonance. 2009;200(2):303–312. doi: 10.1016/j.jmr.2009.07.013. [DOI] [PubMed] [Google Scholar]
- Beuling EE, van den Heuvel JC, Ottengraf SPP. Diffusion coefficients of metabolites in active biofilms. Biotechnology and Bioengineering. 2000;67(1):53–60. doi: 10.1002/(sici)1097-0290(20000105)67:1<53::aid-bit6>3.0.co;2-h. [DOI] [PubMed] [Google Scholar]
- Beuling EE, van Dusschoten D, Lens P, van den Heuvel JC, Van As H, Ottengraf SPP. Characterization of the diffusive properties of biofilms using pulsed field gradient-nuclear magnetic resonance. Biotechnology and Bioengineering. 1998;60(3):283–291. doi: 10.1002/(sici)1097-0290(19981105)60:3<283::aid-bit3>3.0.co;2-d. [DOI] [PubMed] [Google Scholar]
- Beyenal H, Lewandowski Z. Fundamentals of Biofilm Research. CRC; 2007. [Google Scholar]
- Beyenal H, Tanyolac A, Lewandowski Z. Measurement of local effective diffusivity in heterogeneous biofilms. Pergamon-Elsevier Science Ltd.; 1998. pp. 171–178. [Google Scholar]
- Bishop PL, Zhang TC, Fu YC. Effects of biofilm structure, microbial distributions and mass-transport on biodegradation processes. 1995;31:143–152. [Google Scholar]
- Bryers JD, Drummond F. Local macromolecule diffusion coefficients in structurally non-uniform bacterial biofilms using fluorescence recovery after photobleaching (FRAP) Biotechnology and Bioengineering. 1998;60(4):462–473. [PubMed] [Google Scholar]
- Chang I, Gilbert ES, Eliashberg N, Keasling JD. A three-dimensional, stochastic simulation of biofilm growth and transport-related factors that affect structure. Microbiology-Sgm. 2003;149:2859–2871. doi: 10.1099/mic.0.26211-0. [DOI] [PubMed] [Google Scholar]
- Converti A, Casagrande M, deGiovanni M, Rovatti M, DelBorghi M. Evaluation of glucose diffusion coefficient through cell layers for the kinetic study of an immobilized cell-bioreactor. Chemical Engineering Science. 1996;51(7):1023–1026. [Google Scholar]
- de Beer D, Stoodley P, Lewandowski Z. Liquid flow in heterogeneous biofilms. Biotechnology and Bioengineering. 1994;44(5):636–641. doi: 10.1002/bit.260440510. [DOI] [PubMed] [Google Scholar]
- de Beer D, Stoodley P, Lewandowski Z. Measurement of local diffusion coefficients in biofilms by microinjection and confocal microscopy. Biotechnology and Bioengineering. 1997;53(2):151–158. doi: 10.1002/(SICI)1097-0290(19970120)53:2<151::AID-BIT4>3.0.CO;2-N. [DOI] [PubMed] [Google Scholar]
- Ebrahimi S, Picioreanu C, Xavier JB, Kleerebezem R, Kreutzer M, Kapteijn F, Moulijn JA, van Loosdrecht MCM. Biofilm growth pattern in honeycomb monolith packings: Effect of shear rate and substrate transport limitations. Catalysis Today. 2005;105(3-4):448–454. [Google Scholar]
- Fan LS, Leyvaramos R, Wisecarver KD, Zehner BJ. Diffusion of phenol through a biofilm grown on activated carbon particles in a draft-tube 3-phase fluidized-bed bioreactor. Biotechnology and Bioengineering. 1990;35(3):279–286. doi: 10.1002/bit.260350309. [DOI] [PubMed] [Google Scholar]
- Hoskins BC, Fevang L, Majors PD, Sharma MM, Georgiou G. Selective imaging of biofilms in porous media by NMR relaxation. Journal of Magnetic Resonance. 1999;139(1):67–73. doi: 10.1006/jmre.1999.1747. [DOI] [PubMed] [Google Scholar]
- IUPAC. Compendium of Chemical Terminology, 2nd ed (the “Gold Book”) Oxford: Blackwell Scientific Publications; 1997. [Google Scholar]
- Kreft JU, Picioreanu C, Wimpenny JWT, van Loosdrecht MCM. Individual-based modelling of biofilms. Microbiology-Sgm. 2001;147:2897–2912. doi: 10.1099/00221287-147-11-2897. [DOI] [PubMed] [Google Scholar]
- Lawrence JR, Wolfaardt GM, Korber DR. Determination of diffusion-coefficients in biofilms by confocal laser microscopy. Applied and Environmental Microbiology. 1994;60(4):1166–1173. doi: 10.1128/aem.60.4.1166-1173.1994. [DOI] [PMC free article] [PubMed] [Google Scholar]
- Le Bihan D. Magnetic-resonance-imaging of perfusion. Magnetic Resonance in Medicine. 1990;14:283–292. doi: 10.1002/mrm.1910140213. [DOI] [PubMed] [Google Scholar]
- Manz B, Volke F, Goll D, Horn H. Measuring local flow velocities and biofilm structure in biofilm systems with magnetic resonance imaging (MRI) Biotechnology and Bioengineering. 2003;84(4):424–432. doi: 10.1002/bit.10782. [DOI] [PubMed] [Google Scholar]
- McLean JS, Majors PD, Reardon CL, Bilskis CL, Reed SB, Romine MF, Fredrickson JK. Investigations of structure and metabolism within Shewanella oneidensis MR-1 biofilms. Journal of Microbiological Methods. 2008a;74(1):47–56. doi: 10.1016/j.mimet.2008.02.015. [DOI] [PubMed] [Google Scholar]
- McLean JS, Ona ON, Majors PD. Correlated biofilm imaging, transport and metabolism measurements via combined nuclear magnetic resonance and confocal microscopy. Isme Journal. 2008b;2(2):121–131. doi: 10.1038/ismej.2007.107. [DOI] [PMC free article] [PubMed] [Google Scholar]
- Peters AC, Wimpenny JWT. A constant-depth laboratory model film fermentor. Biotechnology and Bioengineering. 1988;32(3):263–270. doi: 10.1002/bit.260320302. [DOI] [PubMed] [Google Scholar]
- Phoenix VR, Holmes WM. Magnetic resonance imaging of structure, diffusivity, and copper immobilization in a phototrophic biofilm. Applied and Environmental Microbiology. 2008;74(15):4934–4943. doi: 10.1128/AEM.02783-07. [DOI] [PMC free article] [PubMed] [Google Scholar]
- Picioreanu C, van Loosdrecht MCM, Heijnen JJ. Mathematical modeling of biofilm structure with a hybrid differential-discrete cellular automaton approach. Biotechnology and Bioengineering. 1998;58(1):101–116. doi: 10.1002/(sici)1097-0290(19980405)58:1<101::aid-bit11>3.0.co;2-m. [DOI] [PubMed] [Google Scholar]
- Picioreanu C, van Loosdrecht MCM, Heijnen JJ. Effect of diffusive and convective substrate transport on biofilm structure formation: A two-dimensional modeling study. Biotechnology and Bioengineering. 2000;69(5):504–515. doi: 10.1002/1097-0290(20000905)69:5<504::aid-bit5>3.0.co;2-s. [DOI] [PubMed] [Google Scholar]
- Pratten J. Growing Oral Biofilms in a Constant Depth Film Fermentor (CDFF) Current Protocols in Microbiology. 2007;6:1B.5.1–1B.5.18. doi: 10.1002/9780471729259.mc01b05s6. [DOI] [PubMed] [Google Scholar]
- Seymour JD, Gage JP, Codd SL, Gerlach R. Magnetic resonance microscopy of biofouling induced scale dependent transport in porous media. Advances in Water Resources. 2007;30(6-7):1408–1420. [Google Scholar]
- Simpson JH, Carr HY. Diffusion and Nuclear Spin Relaxation in Water. Physical Review. 1958;111(5):1201. [Google Scholar]
- Stejskal EO, Tanner JE. Spin Diffusion Measurements: Spin Echoes in the Presence of a Time-Dependent Field Gradient. The Journal of Chemical Physics. 1965;42(1):288–292. [Google Scholar]
- Stewart PS. A review of experimental measurements of effective diffusive permeabilities and effective diffusion coefficients in biofilms. Biotechnology and Bioengineering. 1998;59(3):261–272. doi: 10.1002/(sici)1097-0290(19980805)59:3<261::aid-bit1>3.0.co;2-9. [DOI] [PubMed] [Google Scholar]
- Stewart PS, Davison WM, Steenbergen JN. Daptomycin Rapidly Penetrates a Staphylococcus epidermidis Biofilm. Antimicrobial Agents and Chemotherapy. 2009;53(8):3505–3507. doi: 10.1128/AAC.01728-08. [DOI] [PMC free article] [PubMed] [Google Scholar]
- Stewart PS, Rani SA, Gjersing E, Codd SL, Zheng Z, Pitts B. Observations of cell cluster hollowing in Staphylococcus epidermidis biofilms. Letters in Applied Microbiology. 2007;44(4):454–457. doi: 10.1111/j.1472-765X.2007.02112.x. [DOI] [PubMed] [Google Scholar]
- Torrey HC. Bloch Equations with Diffusion Terms. Physical Review. 1956;104:563–565. [Google Scholar]
- Vogt M, Flemming HC, Veeman WS. Diffusion in Pseudomonas aeruginosa biofilms: a pulsed field gradient NMR study. Journal of Biotechnology. 2000;77:137–146. doi: 10.1016/s0168-1656(99)00213-8. [DOI] [PubMed] [Google Scholar]
- Wieland A, de Beer D, Damgaard LR, Kuhl M, van Dusschote D, Van As H. Fine-scale measurement of diffusivity in a microbial mat with nuclear magnetic resonance imaging. Limnology and Oceanography. 2001;46(2):248–259. [Google Scholar]
- Xavier JB, Foster KR. Cooperation and conflict in microbial biofilms. Proceedings of the National Academy of Sciences of the United States of America. 2007;104(3):876–881. doi: 10.1073/pnas.0607651104. [DOI] [PMC free article] [PubMed] [Google Scholar]
- Xia FH, Beyenal H, Lewandowski Z. An electrochemical technique to measure local flow velocity in biofilms. Water Research. 1998;32(12):3631–3636. [Google Scholar]
- Zhang SF, Splendiani A, dos Santos LMF, Livingston AG. Determination of pollutant diffusion coefficients in naturally formed biofilms using a single tube extractive membrane bioreactor. Biotechnology and Bioengineering. 1998;59(1):80–89. [PubMed] [Google Scholar]
Associated Data
This section collects any data citations, data availability statements, or supplementary materials included in this article.