Abstract
Background
Despite rapid advances in cardiac computed tomography (CT), a strategy for optimal visualization of perfusion abnormalities on CT has yet to be validated.
Objective
To evaluate the performance of several post-processing techniques of source data sets to detect and characterize perfusion defects in acute myocardial infarctions with cardiac CT.
Methods
Twenty-one subjects (18 men; 60 ± 13 years) that were successfully treated with percutaneous coronary intervention for ST-segment myocardial infarction underwent 64-slice cardiac CT and 1.5 Tesla cardiac MRI scans following revascularization. Delayed enhancement MRI images were analyzed to identify the location of infarcted myocardium. Contiguous short axis images of the left ventricular myocardium were created from the CT source images using 0.75mm multiplanar reconstruction (MPR), 5mm MPR, 5mm maximal intensity projection (MIP), and 5mm minimum intensity projection (MinIP) techniques. Segments already confirmed to contain infarction by MRI were then evaluated qualitatively and quantitatively with CT.
Results
Overall, 143 myocardial segments were analyzed. On qualitative analysis, the MinIP and thick MPR techniques had greater visibility and definition than the thin MPR and MIP techniques (p < 0.001). On quantitative analysis, the absolute difference in Hounsfield Unit (HU) attenuation between normal and infarcted segments was significantly greater for the MinIP (65.4 HU) and thin MPR (61.2 HU) techniques. However, the relative difference in HU attenuation was significantly greatest for the MinIP technique alone (95%, p < 0.001). Contrast to noise was greatest for the MinIP (4.2) and thick MPR (4.1) techniques (p < 0.001).
Conclusion
The results of our current investigation found that MinIP and thick MPR detected infarcted myocardium with greater visibility and definition than MIP and thin MPR.
Keywords: Cardiac computed tomography, post processing techniques, ST-segment myocardial infarction, minimum intensity projection
Introduction
Recent studies suggest that cardiac computed tomography (CT), a study commonly performed for the detection of coronary artery stenosis1 may afford the ability to assess myocardial perfusion. In preliminary work among patients with ST-elevation myocardial infarction (STEMI), Mahnken demonstrated excellent agreement of contrast-enhanced cardiac CT with cardiac magnetic resonance imaging (MRI)2. Using delayed enhancement (DE) MRI as a gold standard, agreement was seen in 92.6% of segments on DE-CT, 83.7% of segments with early phase CT, and 82.4% of segments with late enhancement CT. Moreover, there is an excellent correlation between early and delayed CT and MRI for infarct size (r = 0.93, r = 0.89, respectively) in both acute and chronic MI3.
Given the potential for CT evaluation of myocardial perfusion, an optimal strategy for optimal visualization of perfusion abnormalities on CT must be validated. Most analyses performed to date have empirically evaluated CT-based myocardial perfusion with thick (i.e., 5mm – 10mm) sliced multiplanar reconstructions (MPR)4,5. As cardiac perfusion abnormalities manifest as areas of hypoattentuation relative to the surrounding myocardium, thick MPR images or minimum intensity projection (MinIP) reconstructions might theoretically allow for better identification of perfusion abnormalities. In this study, we sought to compare different image post-processing techniques of source data sets in order to identify the best method to detect and characterize perfusion defects in acute myocardial infarction.
Methods
Patient Population
For our initial analysis, subjects that presented with ST-segment myocardial infarction and were successfully treated with percutaneous coronary intervention were prospectively enrolled from the cardiac intensive care unit of our institution as previously described6. The study protocol was approved by our institutional review board and was in compliance with the Health Insurance Portability and Accountability Act. All subjects provided written informed consent.
All subjects subsequently underwent 64-slice cardiac CT and 1.5 Tesla cardiac MRI scans on average 2.8 days (range 1 – 5 days) from reperfusion for research purposes.
Subjects were excluded if they had a known history of myocardial infarction, required the support of intraaortic balloon counterpulsation or intravenous inotropic therapy, had evidence of ongoing myocardial ischemia, had arrhythmia causing hemodynamic compromise or irregular heart rhythm, were pregnant, had impaired renal function, were claustrophobic, or if they had metal implants that contraindicated MR imaging.
CT Image Acquisition
Cardiac CT images were obtained on a 64-slice multidetector scanner (Sensation 64; Siemens, Forchheim, Germany) with a rotation time of 330 msec, temporal resolution of 165 msec, 32 × 0.6-mm-wide detector collimation, and double z-axis acquisition technology (Z-Sharp; Siemens)7. The CT was obtained following a 20mL test bolus using 75 -90 mL of iodixanol (Visipaque; GE Healthcare, Princeton, NJ), a tube voltage of 120 kV, mean tube current of 871± 29 mAs, and was timed to 4 seconds following peak aortic root enhancement to provide for myocardial enhancement. Tube current modulation was used in 17 subjects and the average heart rate during acquisition was 65 (± 8) beats per minute.
MR Image Acquisition
Cardiac MR images were obtained on a 1.5 Tesla scanner (Twin-Speed Excite; GE Healthcare, Milwaukee, WI.) with an eight-element phased-array cardiac coil and high-speed gradients (maximum amplitude, 40 mT/m; slew rate, 150 T/m/sec). Delayed enhancement images were obtained 10-15 minutes after the intravenous injection of 0.2 mmol/kg gadopentetate dimeglumine (Magnevist; Schering, Berlin, Germany) to diagnose myocardial infarction. Images were acquired as 8-mm thick consecutive short-axis images using an inversion-recovery prepared fast gradient-echo pulse sequence (20° flip angle; 180° inversion pulse, 150–300 msec inversion time).
MR Infarct Interpretation
MR images were interpreted on a dedicated cardiac MR (Advantage WS; GE Medical Systems) image processing workstation. The location of infarcted myocardium was recorded by an experienced reader (RCC, 5 years of cardiac MR imaging experience) as areas of hyperenhancement on delayed enhancement images in segments 1 – 16 of the myocardium using the AHA/ACC 17-segment model. DE-MR images were utilized as the reference given that this current analysis was conducted to identify areas of infarction and DE MR is regarded as the gold standard MR technique for infarct imaging.
Qualitative CT Interpretation
In this analysis, contiguous short axis stacks of the LV myocardium perpendicular to the interventricular septum were created from the CT source images using 0.75mm multiplanar reconstruction (MPR), 5mm MPR, 5mm maximal intensity projection (MIP), and 5mm minimum intensity projection (MinIP) techniques on a dedicated CT (Leonardo; Siemens) image processing workstation. The MinIP reformat is designed to translate the voxel with the lowest attenuation value in a given slice, thus would be expected to accentuate low attenuated infarcted segments from surrounding normal myocardium. Images were reconstructed by using a medium smooth reconstruction kernel (B35f).
CT images of segments with confirmed myocardial infarction on delayed enhancement MR (N = 143) were then examined qualitatively using segments 1 – 16 of the 17 segment model. Anatomic landmarks (e.g., right ventricular insertion sites and papillary muscle characteristics) were utilized to help ensure that the regions defined on the CT correspond to the same anatomical region on the MR images. Two experienced readers (SA, MDS) independently rated each segment with each technique for the presence of perfusion defect according to the following 0 to 3 image quality scale: 0 (not detectable), 1 (barely visible), 2 (visible but ill-defined), and 3 (clearly visible and well-defined).
The readers were blinded to the subjects’ clinical history and the coronary anatomy of the patient. Readers were also blinded to the reconstruction technique being evaluated to minimize reader bias for or against particular techniques given the subjective nature of the scale. Readers for evaluation of qualitative CT findings were different than the reader that performed evaluation of the MR acquisition and were blinded to the results of the quantitative CT evaluation. Reconstruction techniques were presented to the readers in a random fashion to minimize reader bias from recognition of particular techniques. Readers were permitted to adjust window width and level settings as desired.
Quantitative CT Interpretation
The CT images of the same 143 myocardial segments were then independently analyzed for quantitative evidence of myocardial infarction. The short axis stacks of the left ventricular myocardium created with each technique (0.75mm MPR, 5mm MPR, 5mm MIP, and 5mm MinIP) were used to sample each segment quantitatively by placing 5mm2 regions of interest within the hypoenhanced areas of apparent myocardial infarction. The average Hounsfield Unit value within each ROI was recorded. Regions of interest (5mm2) were also placed at the same left ventricular level in an area of remote myocardium in an unaffected coronary territory and the middle of the left ventricular cavity.
The intensity of each area of infarction was calculated as the difference between the average HU of the infarcted myocardium and the average HU of the normal myocardium, divided by the HU of the normal myocardium. Noise was defined as the standard deviation of the average HU of the normal myocardium. The contrast to noise ratio corresponding to each segment was calculated as the difference between the average HU of the infarcted myocardium and the average HU of the normal myocardium, divided by the standard deviation of the normal myocardium.
Statistical Analysis
Results are expressed as mean ± standard deviation unless stated otherwise. Qualitative assessment of perfusion defect intensity was compared among reconstruction techniques using analysis of variance (ANOVA) with Bonferroni correction. Quantitative averages in normal territories and infarcted segments were compared using ANOVA with Bonferroni correction. A two sided p-value <0.05 was considered to indicate statistical significance. Analyses were performed using SAS (Version 9.1, SAS Institute Inc., Cary, NC, USA).
Results
Subjects
Twenty-one subjects (18 men; 60 ± 13 years) were studied. Culprit lesions were treated in the right coronary artery (RCA) in 12 subjects, the left anterior descending (LAD) artery in 5 subjects, the left circumflex artery (LCx) in 3 subjects, and the ramus intermedius (RI) artery in 1 subject. All subjects underwent CT and MRI on average 2.8 days (range 1 – 5 days) from reperfusion. The CT and MRI exams were performed on the same day in 18 patients. In 3 patients, the MRI was performed 1 day following the CT. Subject characteristics are summarized in table 1.
Table 1.
Characteristics of Patients (n = 21)
| Characteristic | |
|---|---|
| Age (years) | 60 ± 13 |
| Men | 18 (86%) |
| Body mass index (kg/m2) | 27 ± 4 |
| Personal history of CAD | 4 (19%) |
| Infarct-related coronary artery | |
| Right coronary artery | 12 (57%) |
| Left anterior descending coronary artery | 5 (24%) |
| Left circumflex coronary artery | 3 (14%) |
| Ramus intermedius coronary artery | 1 (5%) |
| Median time: onset of symptoms to revascularization (hours) | 3.4 (1.0-22) |
| Median time: onset of symptoms to CT (days) | 2.6 ± 1.2 |
| Peak creatinine phosphokinase (μg/mL) | 2035 ± 1511 |
| Peak troponin T (μg/mL) | 5.5 ± 3.9 |
Age, BMI, and peak enzymes values are presented as mean ± standard deviation; median time from onset of symptoms to revascularization is presented as median with range; median time from onset of symptoms to CT is presented as median ± SD; binary variables are presented as number of patients with corresponding percentage.
Qualitative CT Results
Examples of CT and MRI images for two subjects are presented in Figure 1 and Figure 2. Following review of the 143 segments, the average qualitative ratings for both readers on the 0 to 3 scale were: 1.5 (thin MPR), 1.7 (MIP), 2.0 (thick MPR), and 2.0 (MinIP). A summary of reader ratings by technique is shown in Figure 3. On ANOVA, thick MPR and MinIP techniques were significantly different than the thin MPR and MIP techniques (P < 0.001). There was no difference between the thin MPR and MIP techniques. The areas of infarction on CT corresponded to the vascular territory treated with the acute percutaneous intervention for all subjects, as evidenced by CT angiographic correlation.
Figure 1.
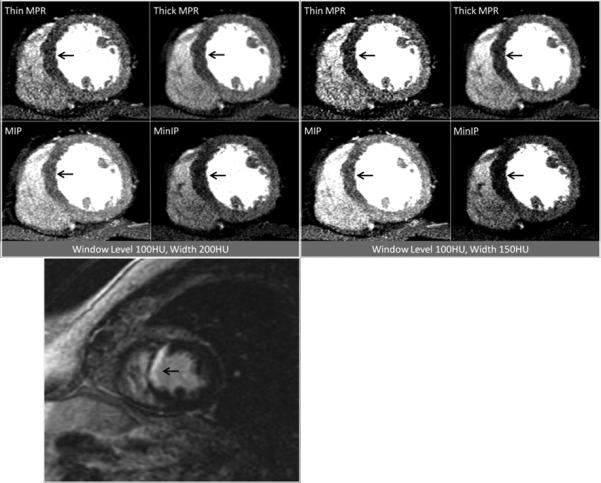
Contrast-enhanced short axis CT images at window level 100HU and width 200HU as well as window level 100HU and width 150HU demonstrating anteroseptal and inferoseptal myocardial infarction at the mid ventricular level (arrows), as visualized by the four post-processing techniques. The patient was a 63 year-old man with myocardial infarction. Corresponding delayed enhancement short axis MRI image are presented for correlation (bottom).
Figure 2.
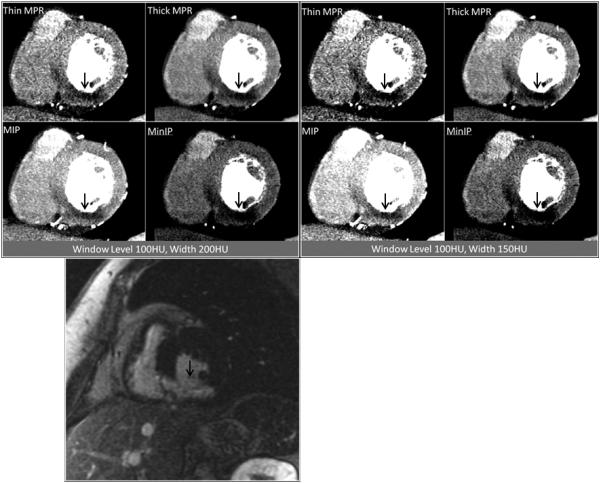
Contrast enhanced short axis CT images at window level 100HU and width 200HU as well as window level 100HU and width 150HU demonstrating inferior and inferoseptal myocardial infarction at the mid ventricular level (arrows), as visualized by the four post-processing techniques. The patient was a 67 year-old woman with myocardial infarction. Corresponding delayed enhancement short axis MRI image are presented for correlation (bottom).
Figure 3.
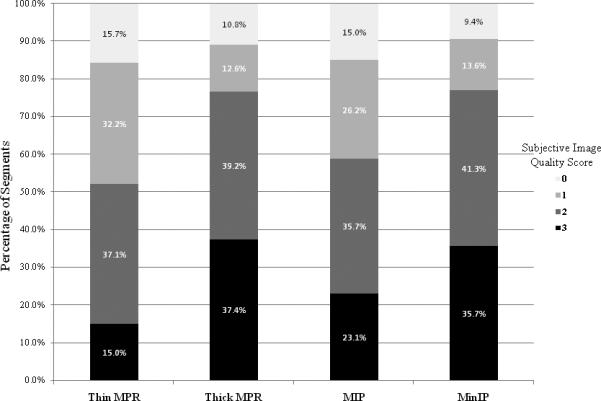
Distribution of qualitative ratings on the 0 to 3 scale: 0 (not detectable), 1 (barely visible), 2 (visible but ill defined), and 3 (clearly visible and well defined). A greater percentage of segments processed with the thick MPR and MinIP techniques were rated as clearly visible and well defined. A greater percentage of segments processed with the thin MPR and MIP reformats were rated as barely visible or not detectable.
Quantitative CT Results
The absolute difference in Hounsfield Unit attenuation between normal (remote) and infarcted segments was significantly greater for the MinIP (65 HU) and thin MPR (61 HU) techniques, than for the thick MPR (49 HU) and MIP (44 HU) techniques (P < 0.001). This data is displayed in Figure 4. However, accounting for the percentage change from the intensity of the normal myocardium, the intensity of infarcted segments was greatest for the MinIP technique alone (95.6%, P < 0.001). The other analysis techniques had statistically lower percentage differences: 60.5% (thin MPR), 51% (thick MPR), and 33.5% (MIP) (Figure 5).
Figure 4.
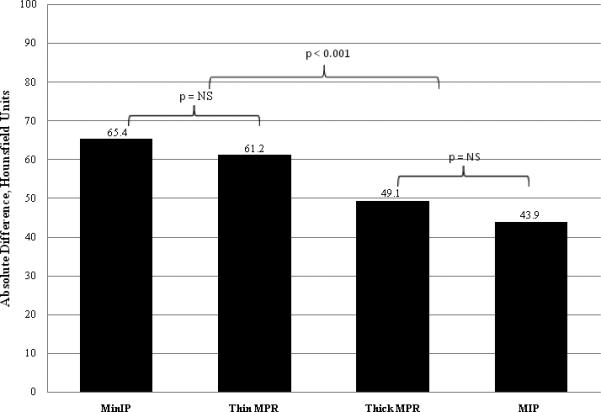
Average absolute difference in Hounsfield Unit attenuation between areas of infarcted myocardium and areas of remote normal myocardium. Segments processed with the MinIP and thin MPR techniques had a significantly greater difference than segments processed with the thick MPR and MIP techniques. There was no significant difference between segments processed with the MinIP and thin MPR techniques nor between segments processed with the thick MPR and MIP techniques.
Figure 5.
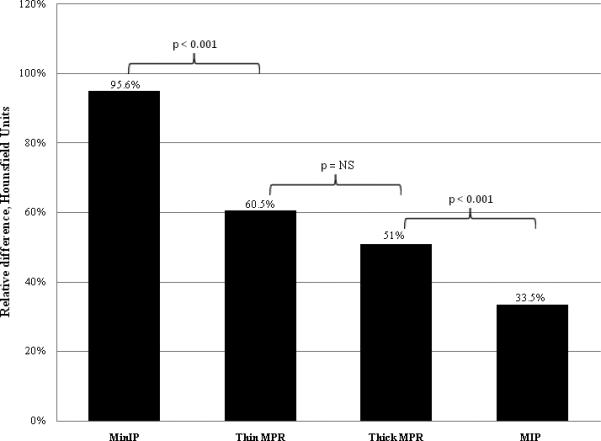
Average relative difference in Hounsfield Unit attenuation between areas of infarcted myocardium and areas of remote normal myocardium. Segments processed with the MinIP technique had a significantly greater relative difference than segments processed with thin MPR or thick MPR, which in turn had a significantly greater difference than segments processed with the MIP techniques. There was no significant difference between segments processed with the thin MPR and thick MPR techniques.
Noise was greatest (23.4) for the thin MPR and least for the thick MPR (13.5) (p < 0.001). There was no difference between the MIP and MinIP techniques. Contrast to noise ratio was significantly greater for the MinIP (4.2) and thick MPR (4.1) techniques than for the thin MPR (2.9) and MIP (2.7) techniques (P < 0.001). Quantitative CT results are summarized in Table 2.
Table 2.
Quantitative CT Results by Post-Processing Technique
| Thin MPR | Thick MPR | MIP | MinIP | p Value* | |
|---|---|---|---|---|---|
| Average HU of infarcted myocardial segments | 37.2 ± 27.0 | 45.8 ± 23.7 | 83.7 ± 24.7 | 4.4 ± 27.4 | < 0.001 |
| Standard deviation of HU in infarcted myocardial segments | 23.2 ± 10.5 | 12.1 ± 5.4 | 15.89 ± 6.5 | 18.9 ± 7.1 | < 0.001 |
| Average HU in normal remote myocardial segments | 98.4 ± 12.6 | 94.9 ± 13.9 | 127.6 ± 13.9 | 69.8 ± 15.2 | < 0.001 |
| Standard deviation of HU in normal remote myocardial segments | 23.4 ± 6.5 | 13.5 ± 5.7 | 17.8 ± 5.4 | 16.7 ± 4.3 | < 0.001 |
| Average HU in LV cavity at the level of infarcted segments | 313.3 ± 61.4 | 306.6 ± 64.7 | 347.1 ± 60.0 | 278.3 ± 65.4 | < 0.001 |
| Absolute difference in HU, infarcted vs. normal segments | 61.2 ± 27.5 | 49.1 ± 25.7 | 43.9 ± 24.7 | 65.4 ± 27.7 | < 0.001 |
| Relative difference in HU (%), infarcted vs. normal segments | 60.5 ± 26.2 | 51.1 ± 26.4 | 33.5 ± 19.5 | 95.6 ± 42.9 | < 0.001 |
| Contrast to noise ratio (CNR) | 2.9 ± 1.5 | 4.1 ± 2.6 | 2.7 ± 1.6 | 4.2 ± 2.1 | < 0.001 |
Values presented as mean ± SD for each post-processing technique. Relative difference in HU calculated as the difference between the average HU of the infarcted myocardium and the average HU of the normal myocardium, divided by the HU of the normal myocardium. Contrast to noise ratio calculated as the difference between the average HU of the infarcted myocardium and the average HU of the normal myocardium, divided by the SD of the normal myocardium.
p values represent significance of one-way analysis of variance (ANOVA) to test for a difference among the reformat techniques.
Discussion
The theoretical use of MinIP for assessment of infarcted myocardium relies upon the unproven ability for Minip to enhance distinction of the low attenuated infarcted segment from surrounding normal myocardium. In this study we compared thin slice MPR, 5mm MPR, 5mm MIP, and 5mm MinIP techniques for their utility in the detection of myocardial infarction. The results suggest that MinIP and thick MPR were the optimal image reformat methods.
A prior study by Bouvier studied MinIP reformats for the identification and quantification of aortic valvular stenosis8. The authors demonstrated a two stage process of planimetry of the aortic value, initially using MinIP to distinguish the aortic valve orifice from surrounding soft tissues, then using MIP to exclude calcifications from the planimetry. In contrast to cardiac CT, more research has been conducted on the application of MinIP methods for noncardiac imaging including the detection of emphysema, CT cholangiography, and in pancreatic imaging9,10,11. Following from the work of Napel12, Remy-Jardin and colleagues reported an analysis of 13 subjects in which thin slices were compared to 3-, 5-, and 8mm slices reconstructed with MinIP and compared to histology for the presence and extent of emphysema13. The sensitivity for the detection of emphysema was significantly greater with MinIP than with thin slices (82% vs. 61%, p < 0.01). The authors concluded that the 8mm MinIP slices provided the most optimal suppression of vascular structures, thus improving the detection of emphysematous pulmonary parenchymal changes. Satoh and colleagues showed that 10mmMinIP was superior to1mm high resolution CT slices for the quantification of emphysema as determined by histopathology and pulmonary function testing14.
Beyond use of cardiac CT for the detection of myocardial infarction, ongoing work provides promise for the application of CT for detection of inducible myocardial ischemia and prior infarction. Preliminary research in this area has been promising in the context of adenosine administration15,16, however such pharmacologic stress imaging protocols for the concomitant visualization of coronary stenosis and myocardial perfusion will be expected to benefit from scanners with high temporal resolution and/or greater volume coverage, given the relative limitations with single source 64-slice CT. Further research will be necessary to refine the optimal settings to evaluate perfusion, which may not necessarily be the same settings for inducible ischemia and infarction.
As investigation into the use of cardiac CT for the detection of myocardial perfusion defects continues, our analysis yielded several helpful findings. Qualitatively, infarcted segments viewed with the MinIP and thick MPR techniques were rated by the experienced reviewers as having significantly greater visibility and definition on both rating scales, as compared to the thin MPR and MIP techniques. When defects were evaluated on a quantitative basis, the absolute difference in Hounsfield Unit attenuation between normal and infarcted segments was significantly greater for the MinIP and thin MPR techniques. The intensity of infarcted segments was significantly greatest for the MinIP technique alone. Despite this methodological superiority, segments viewed with the thick MPR and MinIP still corresponded to a scale guide of “visible but ill defined” indicating further refinements in imaging techniques should be pursued.
The finding that the MinIP technique yielded segments with significantly greater relative difference is expected, given that infarction manifests as hypoattenuation and that the MinIP technique is designed to translate the voxel with the lowest attenuation value in a given slice. Similarly, it would have been expected that the MIP technique would perform poorly in the identification of hypoattenuation from infarction given that it is designed to translate the voxel with the greatest attenuation value in a given slice. In consideration of the thin slice (0.75mm) and thick slice average weighted (5mm) MPR techniques, it can be postulated that the thick slice technique was quantitatively less sensitive for infarction than the thin technique as the thick slices translate the average voxel attenuation, which may blunt identification of segments with low voxel values. The significantly greater CNR of the MinIP and thick MPR techniques likely helps to explain why the MinIP and thick MPR techniques were rated by the experienced reviewers as having significantly greater visibility and definition on both qualitative rating scales.
Beyond the post-processing technique utilized, several other considerations have been described as helpful in distinguishing infarcted myocardium 17,18. These considerations include presence of a regional wall motion abnormality in the same segment as the perfusion defect and persistence of the suspected defect across multiple different phases of the cardiac cycle (e.g., present in both systole and diastole). In addition, the presence of fatty infiltration, wall thinning, and/or myocardial calcification of an infarcted segment can support the chronic nature of an infarction. The presence of fatty infiltration can be quantified as attenuation discrepancies, as evidenced by our previous findings of significantly lower CT attenuation values in patients with long-standing MI (-13 ± 37 HU) than those with acute MI (26 ± 26 HU) and healthy controls (73 ± 14 HU; P < 0.001)6, and as analyzed in the quantitative portion of this manuscript.
In consideration of limitations, subjectivity is inherent in qualitative rating scales. A lack of precision may have been introduced by the comparison of five to eight 8mm-thick short-axis sections of the LV obtained with CMR with CT images of different slice thickness. Also of note, readers were permitted to adjust window width and level settings as desired during the qualitative assessment and the window width and level settings ultimately selected for each segment are not controlled for in this analysis. We and others have observed that use of a narrow window width and narrow window level (e.g. W 200, L 100) are helpful in the detection of infarcted myocardium18, as shown in figures 1 and 2. However the most accurate settings and their relation to other parameters have not yet been determined. Future analysis should consider window width and level settings in addition to the image reformation technique and slice thickness as well as a comparison of the precise extent of perfusion defect seen on CT with the various post-processing techniques to that seen on MR. Finally, it should be noted that this study was not designed to study diagnostic accuracy. Future analysis with a balanced number of controls will be needed to fully determine the performance characteristics of these techniques.
Conclusion
For the detection of infracted myocardium using cardiac CT, MinIP and thick MPR provide greater visibility and definition than MIP and thin MPR.
Acknowledgments
FUNDING SOURCES: Drs. Rogers, Blankstein, and Shapiro received support from National Institutes of Health grant T32HL076136.
Footnotes
Publisher's Disclaimer: This is a PDF file of an unedited manuscript that has been accepted for publication. As a service to our customers we are providing this early version of the manuscript. The manuscript will undergo copyediting, typesetting, and review of the resulting proof before it is published in its final citable form. Please note that during the production process errors may be discovered which could affect the content, and all legal disclaimers that apply to the journal pertain.
DISCLOSURES:
Abbara: Consulting: Partners Imaging, Magellan Healthcare, Perceptive Informatics; Research funding: Bracco.
REFERENCES
- 1.Ropers D, Rixe J, Anders K, Küttner A, Baum U, Bautz W, Daniel WG, Achenbach S. Usefulness of multidetector row spiral computed tomography with 64- × 0.6-mm collimation and 330-ms rotation for the noninvasive detection of significant coronary artery stenoses. Am J Cardiol. 2006;97(3):343–8. doi: 10.1016/j.amjcard.2005.08.050. [DOI] [PubMed] [Google Scholar]
- 2.Mahnken AH, Koos R, Katoh M, Wildberger JE, Spuentrup E, Buecker A, Günther RW, Kühl HP. Assessment of myocardial viability in reperfused acute myocardial infarction using 16-slice computed tomography in comparison to magnetic resonance imaging. J Am Coll Cardiol. 2005;45(12):2042–7. doi: 10.1016/j.jacc.2005.03.035. 21. [DOI] [PubMed] [Google Scholar]
- 3.Gerber BL, Belge B, Legros GJ, Lim P, Poncelet A, Pasquet A, Gisellu G, Coche E, Vanoverschelde JL. Characterization of acute and chronic myocardial infarcts by multidetector computed tomography: comparison with contrast-enhanced magnetic resonance. Circulation. 113(6):823–33. doi: 10.1161/CIRCULATIONAHA.104.529511. [DOI] [PubMed] [Google Scholar]
- 4.Habis M, Capderou A, Ghostine S, Daoud B, Caussin C, Riou JY, Brenot P, Angel CY, Lancelin B, Paul JF. Acute myocardial infarction early viability assessment by 64-slice computed tomography immediately after coronary angiography: comparison with low-dose dobutamine echocardiography. J Am Coll Cardiol. 2007;49(11):1178–85. doi: 10.1016/j.jacc.2006.12.032. [DOI] [PubMed] [Google Scholar]
- 5.Lessick J, Dragu R, Mutlak D, Rispler S, Beyar R, Litmanovich D, Engel A, Agmon Y, Kapeliovich M, Hammerman H, Ghersin E. Is functional improvement after myocardial infarction predicted with myocardial enhancement patterns at multidetector CT? Radiology. 2007;244(3):736–44. doi: 10.1148/radiol.2443061397. [DOI] [PubMed] [Google Scholar]
- 6.Nieman K, Shapiro MD, Ferencik M, Nomura CH, Abbara S, Hoffmann U, Gold HK, Jang IK, Brady TJ, Cury RC. Reperfused myocardial infarction: contrast-enhanced 64-Section CT in comparison to MR imaging. Radiology. 2008 Apr;247(1):49–56. doi: 10.1148/radiol.2471070332. [DOI] [PubMed] [Google Scholar]
- 7.Flohr T, Stierstorfer K, Raupach R, Ulzheimer S, Bruder H. Performance evaluationof a 64-slice CT system with z-flying focal spot. Rofo. 2004;176(12):1803–1810. doi: 10.1055/s-2004-813717. [DOI] [PubMed] [Google Scholar]
- 8.Bouvier E, Logeart D, Sablayrolles JL, Feignoux J, Scheublé C, Touche T, Thabut G, Cohen-Solal A. Diagnosis of aortic valvular stenosis by multislice cardiac computed tomography. Eur Heart J. 2006;27(24):3033–8. doi: 10.1093/eurheartj/ehl273. [DOI] [PubMed] [Google Scholar]
- 9.Kim HC, Park SJ, Park SI, Park SH, Kim HJ, Shin HC, Bae WK, Kim IY, Lee HK. Multislice CT cholangiography using thin-slab minimum intensity projection and multiplanar reformation in the evaluation of patients with suspected biliary obstruction: preliminary experience. Clin Imaging. 2005;29(1):46–54. [PubMed] [Google Scholar]
- 10.Park SJ, Han JK, Kim TK, Choi BI. Three-dimensional spiral CT cholangiography with minimum intensity projection in patients with suspected obstructive biliary disease: comparison with percutaneous transhepatic cholangiography. Abdom Imaging. 2001;26(3):281–6. doi: 10.1007/s002610000140. [DOI] [PubMed] [Google Scholar]
- 11.Kim HC, Park SI, Park SJ, Shin HC, Oh MH, Kim CH, Kim TY, Kim HH, Bae WK, Kim IY. Pancreatic carcinoid tumor with obstructive pancreatitis: multislice helical CT appearance: case report. Abdominal Imaging. 2005;30(5):601–4. doi: 10.1007/s00261-004-0285-1. Sep-Oct. [DOI] [PubMed] [Google Scholar]
- 12.Napel S, Rubin GD, Jeffrey RB. STS-MIP: a new reconstruction technique for CT of the chest. J Comput Assist Tomogr. 1993 Sep-Oct;17(5):832–8. [PubMed] [Google Scholar]
- 13.Remy-Jardin M, Remy J, Gosselin B, Copin MC, Wurtz A, Duhamel A. Sliding thin slab, minimum intensity projection technique in the diagnosis of emphysema: histopathologic-CT correlation. Radiology. 1996;200:665–671. doi: 10.1148/radiology.200.3.8756912. [DOI] [PubMed] [Google Scholar]
- 14.Satoh S, Kitazume Y, Taura S. Pulmonary emphysema: histopathologic correlation with minimum intensity projection imaging, high-resolution computed tomography, and pulmonary function test results. J Comput Assist Tomogr. 2008;32(4):576–82. doi: 10.1097/RCT.0b013e31814b276a. Jul-Aug. [DOI] [PubMed] [Google Scholar]
- 15.Blankstein R, Shturman LD, Rogers IS, Rocha-Filho JA, Okada DR, Sarwar A, Soni AV, Bezerra H, Ghoshhajra BB, Petranovic M, Loureiro R, Feuchtner G, Gewirtz H, Hoffmann U, Mamuya WS, Brady TJ, Cury RC. Adenosine-induced stress myocardial perfusion imaging using dual-source cardiac computed tomography. J Am Coll Cardiol. 2009 Sep 15;54(12):1072–84. doi: 10.1016/j.jacc.2009.06.014. [DOI] [PubMed] [Google Scholar]
- 16.George RT, Arbab-Zadeh A, Miller JM, Kitagawa K, Chang HJ, Bluemke DA, Becker L, Yousuf O, Texter J, Lardo AC, Lima JA. Adenosine stress 64- and 256-row detector computed tomography angiography and perfusion imaging: a pilot study evaluating the transmural extent of perfusion abnormalities to predict atherosclerosis causing myocardial ischemia. Circ Cardiovasc Imaging. 2009 May;2(3):174–82. doi: 10.1161/CIRCIMAGING.108.813766. [DOI] [PMC free article] [PubMed] [Google Scholar]
- 17.Cury RC, Nieman K, Shapiro MD, Butler J, Nomura CH, Ferencik M, Hoffmann U, Abbara S, Jassal DS, Yasuda T, Gold HK, Jang IK, Brady TJ. Comprehensive assessment of myocardial perfusion defects, regional wall motion, and left ventricular function by using 64-section multidetector CT. Radiology. 2008 Aug;248(2):466–75. doi: 10.1148/radiol.2482071478. [DOI] [PMC free article] [PubMed] [Google Scholar]
- 18.Blankstein R, Rogers IS, Cury RC. Practical tips and tricks in cardiovascular computed tomography: diagnosis of myocardial infarction. J Cardiovasc Comput Tomogr. 2009;3(2):104–11. doi: 10.1016/j.jcct.2008.10.014. Mar-Apr. [DOI] [PubMed] [Google Scholar]


