

Abstract
Palmitoylation is the post-translational addition of a palmitate moiety to a cysteine residue through a covalent thioester bond. The addition and removal of this modification is controlled by both palmitoyl acyl-transferases and thioesterases. Using bioinformatic analysis, we identified 22 DHHC family palmitoyl acyl-transferase homologs in the Drosophila genome. We used in situ hybridization, RT-PCR, and published FlyAtlas microarray data to characterize the expression patterns of all 22 fly homologs. Our results indicate that all are expressed genes, but several, including CG1407, CG4676, CG5620, CG6017/dHIP14, CG6618, CG6627, and CG17257 appear to be enriched in neural tissues suggesting that they are important for neural function. Furthermore, we have found that several may be expressed in a sex-specific manner with adult male-specific expression of CG4483 and CG17195. Using tagged versions of the DHHC genes, we demonstrate that fly DHHC proteins are primarily located in either the Golgi Apparatus or Endoplasmic Reticulum in S2 cells, except for CG1407, which was found on the plasma membrane. We also characterized the subcellular localization and expression of the three known thioesterases: Palmitoyl-protein Thioesterase 1 (Ppt1), Palmitoyl-protein Thioesterase 2 (Ppt2), and Acyl-protein Thioesterase 1 (APT1). Our results indicate that Ppt1 and Ppt2 are the major lysosomal thioesterases while APT1 is the likely cytoplasmic thioesterase. Finally, in vivo rescue experiments show that Ppt2 expression cannot rescue the neural inclusion phenotypes associated with loss of Ppt1, further supporting distinct functions and substrates for these two thioesterases. These results will serve as the basis for a more complete understanding of the protein palmitoylome's normal cellular functions in the fly and will lead to further insights into the molecular etiology of diseases associated with the mis-regulation of palmitoylation.
Keywords: Palmitoylation, Thioesterase, Acyl-transferase, DHHC Domain
Introduction
Palmitoylation is a post-translation modification that can occur on secreted, cytoplasmic, and integral membrane proteins. Currently, there are two known types of palmitoylation: N-palmitoylation and S-palmitoylation.1,2 N-palmitoylation is a permanent addition to a protein on N-terminal cysteines through a palmitoylamide bond. S-palmitoylation is a modification that occurs by the addition of palmitate to cysteine through a thioester bond. Unlike N-palmitoylation and other permanent lipidations like myristoylation, S-palymitoylation is a dynamic modification that can be used to alter protein function. The addition of the 16 carbon palmitate moiety to specific proteins can modulate trafficking, protein sub-cellular localization, vesicle fusion, and signal transduction mechanisms.1,2
Different palmitoyl transferase families facilitate the two independent palmitoylation mechanisms. The permanent N-terminal addition is thought to be catalyzed by enzymes that act within the lumen of the secretory pathway.1,2 This modification was first identified in Drosophila with the characterization of the Skinny Hedgehog and Porcupine proteins that have been shown to be required for the palmitoylation of secreted Hedgehog and Wnt, respectively.4,5 These proteins lack similarity to S-acyl transferases and have limited homology to O-acyltransferases.6 The S-palmitoylation cycle is controlled, in part, by the action of the second class of transferases that contain a highly conserved protein domain that is cysteine rich and contains a characteristic Aspartate-Histidine-Histidine-Cysteine motif (DHHC) for which the domain is named.1,2 First functionally characterized in the yeast Sacchromyces cerevisiae, the DHHC protein family directs the transfer of long chain fatty acids, primarily the 16-carbon palmitate group, to a cysteine residue through a transesterification reaction. 2,3 Along with the 7 identified DHHC proteins in yeast, 22 members of this family have been found in humans and 23 in mice.2, 7,8 The proteins within this family have at least 4 trans-membrane regions (TM) with the DHHC domain usually adjacent to the third TM domain on the cytoplasmic membrane face. Both the yeast and mammalian family members have been localized to the Endoplasmic Reticulum (ER), Golgi Apparatus, plasma membrane, and the yeast vacuole.8
The first protein acyl-transferases, Erf2 and Akr1, were identified using yeast genetic screens.9-11 Two proteins, Erf2 and Erf4, were isolated with an elegant screen for proteins responsible for the palmitoylation of Ras.9,12 Erf2 contains a DHHC motif that appears responsible for the acyl-transferase activity of this protein.10 Continued work identified several other palmitoyl acyl-transferases (PATs) and their substrates including Akr2, Swf1, Pfa3, Pfa4, and Pfa5.8,14-18 With the advent of new biotin substitution methodology, a proteomic approach can now be taken to examine the substrate repertoire of these proteins.19 Using this technology along with classical yeast genetics, 35 proteins and their cognate palmitoylating enzymes were recently identified.19 This pioneering work in yeast combined with work in mice and human cell lines has identified a vast list of palmitoylated proteins including non-receptor tyrosine kinases, G-protein coupled receptors, integrins, tetraspanins, Ras, Rho, and Rab G-proteins, caveolin, G alpha and gamma subunits of hetero-trimeric G-proteins, Synaptotagmin, and PSD-95, and many others (reviewed in 20, 21). This partial list demonstrates our growing understanding of the importance of palmitoylation in the regulation of a wide variety of cell biological processes.
The second aspect of the S-palmitoylation cycle is removal of the attached palmitate. There are three known acyl-thioesterases that are responsible for the removal of palmitate from modified cysteines: the primarily lysosomal Palmitoyl-protein Thioesterase 1 and 2 (PPT1 and PPT2) proteins and the cytoplasmic Acyl-protein thioesterase 1 (APT1).20 Work in mice and humans suggest that PPT1 and PPT2 are the two primary thioesterases involved in removing palmitoyl groups during the lysosomal degradative process.20 APT1 has been reported to be the thioesterase responsible for the dynamic modulation of protein palmitoylation states in the cytoplasm.20 In particular, it has been shown to have specificity for and be a possible regulator of heterotrimeric G-protein α-subunits, p21Ras, and eNOS.22-24
Finally, it is becoming clear that palmitoylation is important for the normal function of many cellular processes including those required for nervous system function. Biochemical and genetic approaches from systems as diverse as flies and mice have connected both palmitoyl transferases and thioesterases to synaptic development and function. Mutations in several genes have been associated with human neurological disease including Ppt1 (infantile neuronal ceroid lipofuscinosis), HIP14 (Huntington's Disease), DHHC8 (Schizophrenia) and DHHC15 (X-linked mental retardation).25-29 The powerful genetics and well-characterized nervous system of the fly has already made important contributions to the understanding of Ppt1 and dHIP14 function.30-34 Despite this progress, there is very little known about the role of protein palmitoylation in the fly. The work presented below builds on previous work and provides a further characterization of all the thioesterase and DHHC family transferases in the Drosophila genome. The genetics of the fly in addition to the likely conservation of signaling pathways modulated by palmitoylation will make Drosophila an important research tool. A more complete understanding of the protein palmitoylome's normal cellular functions in the fly will lead to further insights into basic palmitoylation biology and contribute to the characterization of disease etiology of a variety of human disease states related to palmitoylation.
We identified 22 Drosophila DHHC orthologs and isolated cDNA clones for 13 of the 14 genes for which cDNAs were not publicly available. We examined their developmental expression patterns and generated 6×Myc or YFP-tagged versions for 21 of the orthologs to examine their in vivo sub-cellular localization in S2 cells. In addition, we report the subcellular localization of the three thioesterases and examine the in vivo functional overlap between Ppt1 and Ppt2.
Materials and Methods
Fly Husbandry
All crosses were performed at 25°C on standard Drosophila media.
Transgenic Line
The full-length Ppt2 cDNA was obtained from Drosophila Genomics Resource Center. It was initially identified as EST GH02317 using the BDGP EST database. The insert was sequenced with 2× coverage and found to contain a complete open reading frame that matched the sequence reported for Ppt2 in Flybase. The cDNA was cloned into the XhoI site of the pUAST expression vector. Transgenic flies were produced by standard methods using the pP{Wc Δ2,3} helper plasmid. Transformants were identified using the white marker gene contained in the pUAST vector, and the insertions were mapped using standard techniques. We further confirmed that the transgenic lines were over-expressing the Ppt2 message through in situ hybridization on third instar eye imaginal disc and embryonic nervous system tissue. We used the GH02317 cDNA to in vitro transcribe sense and anti-sense RNA that were then used as probes on fixed tissues.
In situ Hybridization
In situ hybridization for Ppt1, Ppt2, CG18815, and all identified DHHC genes was performed on mixed stage embryos of larvae as previously described.35 Table 2 identifies which cDNA clones were used for production of sense and anti-sense probes. These clones were identified with the Berkeley Drosophila Genome Project database and obtained from the Drosophila Genomic Research Center. For genes without a publicly available cDNA clone, PCR amplification of coding sequence was performed on genomic DNA and cloned into the dual promoter pCRII vector for probe production (Invitrogen). To determine if our in situ probes would cross-hybridize to other mRNA sequences, we performed a BLASTn analysis of the Drosophila Genome using likely anti-sense probe sequences. Only the closely related CG17195, CG17196, CG17197, and CG17198 sequences showed alignments that would suggest that gene-specific anti-sense probes for these genes may cross-hybridize. The rest of the probe set showed no likelihood of significant cross-hybridization. All in situ probes were checked for robust synthesis by gel electrophoresis, hybridizations were done in duplicate, and all in situs that failed to give a significant signal were done in conjunction with positive controls.
Table 2. Drosophila Protein Palmitoylome Sub-cellular Localization in S2 Cells.
| Protein | Localization |
|---|---|
| Thioesterases | |
| Ppt1 | Lysosomal |
| Ppt2 | Lysosomal |
| CG18815/Apt1 | Cytoplasmic |
| Transferases | |
| CG1407 | Plasma Membrane |
| CG4483 | Endoplasmic Reticulum |
| CG4676 | Endoplasmic Reticulum |
| CG4956 | Endoplasmic Reticulum |
| CG5196 | Endoplasmic Reticulum |
| CG5620 | Endoplasmic Reticulum |
| CG5880 | Golgi Apparatus |
| CG6017 | Golgi Apparatus1 |
| CG6618 | Golgi Apparatus |
| CG6627 | Endoplasmic Reticulum |
| CG8314 | Golgi Apparatus |
| CG10344 | Endoplasmic Reticulum |
| CG13029 | Endoplasmic Reticulum |
| CG17075 | Endoplasmic Reticulum |
| CG17195 | Endoplasmic Reticulum |
| CG17196 | Endoplasmic Reticulum |
| CG17197 | Endoplasmic Reticulum |
| CG17198 | Endoplasmic Reticulum |
| CG17257 | Golgi Apparatus |
| CG17287 | Endoplasmic Reticulum |
| CG18810 | Golgi Apparatus |
also reported in references 30 and 31
cDNA Expression Panels
Expression of Ppt1, Ppt2, CG18815, and all identified DHHC genes was assayed on a panel of first-strand cDNA prepared from 12 Drosophila tissues and developmental stages (Origene Rapid Scan Gene Expression cDNA Panel). Gene specific PCR primers for each gene can be found in Table 3. The predicted amplification products were subjected to BLASTn analysis to determine if the primer pair set could non-specifically hybridize and amplify another cDNA sequence. No other sequences were recognized by our chosen primer sets suggesting that they were gene-specific. Each primer set was optimized on adult cDNA template using a gradient PCR amplification program. The Origene Panels are made to facilitate rapid semi-quantitative measurement of relative mRNA abundance in several Drosophila developmental stages. Briefly, the first strand cDNAs are normalized to RpL32 cDNA levels, serially diluted over a 4-log range, and arrayed into a 48 well plate. The serial dilutions ensure that an amplification reaction can be achieved that is in the linear range to facilitate comparisons. The set of primer pairs that we used in this study gave amplification products only with the most concentrated 1000× and 100× dilutions. Amplification protocols were performed as described in the Origene Rapid-Scan Panel Manual.
Northern Blot
Drosophila adult total RNA was isolated from w1118 adults using the Invitrogen PureLink Micro-to-Midi Total RNA Purification System. Approximately 10-20 μg of total RNA was run and transferred using Ambion NorthernMax protocols. A riboprobe was synthesized from BglII linearized GH02317 cDNA using Ambion MAXIscript In vitro Transcription kit, labeled using BrightStar Psoralen-Biotin Nonisotopic Labeling Kit and detected using BrightStar BioDetect Nonisotopic Detection Kit. The blot was visualized with a Kodak Image Station 440CF.
Tagging DHHC proteins
Ppt1, Ppt2, CG18815, and all identified DHHC genes were amplified and cloned into the pENTR/TOPO (Invitrogen) entry vector that is used with the Gateway cloning systems. The gene specific primers and templates used for gene amplification are shown in Table 1. All amplifications were done with PfuUltra II Fusion HS DNA Polymerase (Stratagene). For those genes for which genomic DNA or cDNA clones could not be used as templates, we performed RT-PCR on adult total RNA using the Cloned AMV First Strand Synthesis Kit (Invitrogen). The pAWM, pTWV, and pTGW Drosophila Gateway vectors were obtained from the Drosophila Genomics Research Center. For Myc-tagging, entry clones were recombined into pAWM in-frame with the C-terminal 6×Myc tag using the LR Clonase II kit (Invitrogen). For GFP/YFP labeling, entry clones were recombined in-frame into either pTWV (YFP) or pTGW (GFP). Ppt1 was cloned into pTGW, while Ppt2 and CG18815 were placed in pTWV. All clones were sequenced to confirm the open reading frame, orientation, and in-frame fusion.
Table 1. In situ Hybridization of DHHC and Thioesterase mRNA.
| Gene | Locus | Template | Embryo3 | Larval Brain4 | Adult1 |
|---|---|---|---|---|---|
| Thioesterases | |||||
| Ppt1 | 8A2 | cDNA:GM14257 | N | N | Mag |
| CG4851/Ppt2 | 32E2 | cDNA:GH02317 | N | N | H, Cr |
| CG18815/Apt1 | 68D1 | cDNA:GH04560 | Mat, Neu, End, Mes | Y | Br, H, Tg, Cr, Mg |
| DHHC Transferases | |||||
| CG1407 | 46D5-45D7 | cDNA:LD36375 | Mat | N | Br, H, Tg, Mg, Mag |
| CG4483 | 67A4 | cDNA:AT26975 | N | N | Tes2 |
| CG4676 | 49F11 | Genomic PCR | N | N | Br, Tes |
| CG4956 | 96F2 | Genomic PCR | n.d. | n.d. | Tes2 |
| CG5196 | 87B9 | cDNA:GH28414 | N | N | - |
| CG5620 | 69A2-69A4 | cDNA:RE02357 | Mat, Mes, End | Y | Mg, Mag, Tes |
| CG5880 | 97E2 | cDNA:LD25420 | N | N | Ov |
| CG6017 | 72C1 | cDNA:LD10758 | Mat, Neu, Mes | Y | Ov |
| CG6618 | 33C4 | cDNA:GH15747 | N | N | Br, H, Tg |
| CG6627 | 32B1-B2 | cDNA:LD14687 | Mat, Neu, End, SG | Y | Br, H, Ov |
| CG8314 | 52D9 | cDNA:GH13672 | N | N | Mg |
| CG10344 | 58E1 | cDNA:AT16443 | N | N | Tes, Ov |
| CG13029 | 73D3 | cDNA:AT31918 | N | N | Tes2 |
| CG17075 | 21B6 | Genomic PCR | N | N | Tes2 |
| CG17195 | 96F2 | Genomic PCR | n.d. | n.d. | Tes2 |
| CG17196 | 96F2 | Genomic PCR | N | N | Tes2 |
| CG17197 | 96F2 | Genomic PCR | N | N | Tes2 |
| CG17198 | 96F2 | Genomic PCR | n.d. | n.d. | Tes2 |
| CG17257 | 23C5 | cDNA:LD11027 | Mat, Neu, End | Y | Br, Tg |
| CG17287 | 54A2 | Genomic PCR | N | N | Tes2 |
| CG18810 | 38D2 | cDNA:AT08088 | N | N | Tes2 |
| CG34449 | 8D7-D8 | RT-PCR | N | N | Ov |
Adult Expression showing 2 fold or greater enrichment over whole fly was obtained from FlyAtlas (University of Glasgow) Affymetrix Chip Data (flyatlas.org). Abbreviations: Br, Brain; Cr, Crop; H, Head; TG, Thoracicoabdominal ganglion; Mg, Midgut; T, Tubule; H, Hindgut; Ov, Ovary; Tes, Testis; Mag, Male accessory gland
Adult Expression was only detected in Testes according to FlyAtlas (University of Glasgow) Affymetrix Chip Data (www.flyatlas.org).
Tissue enrichment during embryonic development. Abbreviations: End, Endoderm; Mat, Maternal; Mes, Mesoderm; Neu, Neural; SG, Salivary Gland; N: no observable expression, n.d.: not determined
Enrichment in the larval brain as determined by in situ hybridization. N: no observable expression, Y; observable enrichment in brain.
S2 Cell Growth and Protein Expression
S2 cells were grown at room temperature in Schneider's Drosophila Medium (GIBCO) supplemented with fetal bovine serum and antibiotics. A standard Calcium-phosphate transfection protocol (Invitrogen) was used to transiently transfect plasmid constructs for protein expression. To determine levels of protein expression, cells were harvested 2 days post-transfection and processed for immunoblotting with a rabbit anti-Myc antibody (Sigma) (data not shown).
S2 Cell Immunohistochemistry
S2 cells were fixed for 10 minutes at room temperature in PHEM buffer (60mM PIPES, 25mM HEPES, 10mM EGTA, 4mM MgCl2) containing 5% paraformaldehyde and 0.1% Triton X-100. The fixed cells were then washed briefly in PBS and then blocked for 1 hour in PBS containing 0.1% Triton X-100 and 1% BSA. The cells were incubated in primary antibody overnight at 4°C, secondary antibodies (Jackson) for 2 hours at room temperature, and then mounted on slides in Vectashield (Vector Laboratories). The following primary antibodies were used: Rabbit anti-Myc, 1:100 (Sigma), Mouse anti-Myc, 1:200 (Abcam), Mouse anti-Drosophila Golgi, 1:100 (EMD Chemicals), Rabbit anti-GM130, 1:100 (Abcam), and Mouse anti-KDEL, 1:100 (Stressgen). We used the following minimally cross reactive secondary antibodies: Texas Red-conjugated AffiniPure Goat Anti-Rabbit IgG and FITC-conjugated Affini-pure Goat Anti-Mouse IgG (Jackson). All images were acquired on an Olympus IX71 Spinning Disc Confocal Microscope and then deconvolved using Slidebook.
ER Tracker Staining of S2 Cells
We used YFP tagged clones combined with ER tracker-red (Molecular Probes) to visualize ER localization. The tagged constructs were co-transfected with pMT-Gal4 and Gal4 expression was induced using 100mM CuSO4 24 hours prior to visualization. The cells were incubated in media with 500nM ER tracker-red (Molecular Probes)/ DAPI (1μg/ml) for 30 minutes at room temperature and the cells were then fixed (without Triton X-100) as described above. All images were acquired on an Olympus IX71 Spinning Disc Confocal Microscope and then deconvolved using Slidebook.
Live Cell Lysosome Imaging
GFP-tagged Ppt1 and YFP-tagged Ppt2 constructs were co-transfected with pMT-Gal4. Gal4 expression was induced 24 hours prior to visualization using 100mM CuSO4. To visualize lysosomes, cells were incubated in 1μM Lysotracker-Red (Molecular Probes)/ DAPI (1μg/ml) /PBS for 5 minutes at room temperature, placed on a slide, and immediately imaged. All images were acquired on an Olympus IX71 Spinning Disc Confocal Microscope and then deconvolved using Slidebook.
Co-localization Statistics
We employed Pearson's Correlation to statistically analyze the co-localization of tagged transferases and thioesterases and the organellar markers used in this study. Pearson's Correlation compares the intensity in one channel to the intensity in a second channel for the same pixel. A value of -1.0 signifies no correlation, while a value of 1.0 signifies perfect correlation. In our experiments, we created a mask that encompassed the pixels representing the tagged proteins in all planes of a Z-section. The pixel intensities for the tagged proteins were then compared to the intensities of the cell markers we used to produce a correlation value (r). All statistical analyses were preformed using Slidebook.
Transmission Electron Microscopy
Dissected brains of Df(1)446-20; UAS:Ppt212.1/+; Elav-Gal4/+ and Df(1)446-20; UAS:Ppt212.1/+; H2/+ flies were fixed in 6.5% glutaraldehyde in 0.1 M sodium phosphate buffer at pH 7.4 for 3-3.5 hours. The fixed brains were washed in phosphate and 0.1 M sodium cacodylate buffers twice for 10 minutes at pH 7.4. After washing, the tissue was post-fixed in 1% osmium in cacodylate buffer for 1 hour and again washed for 5 minutes in water. Pre-staining was performed in 2% uranyl acetate for 30 minutes followed by an additional wash in water for 5 minutes. The brains were then dehydrated in an acetone series and embedded in Epon 812/Araldite. Sections of both genotypes were stained with uranyl acetate and Reynold's lead and viewed with a Zeiss 910 transmission electron microscope. Age-matched flies of each genotype were used for the analysis.
Ppt1 Enzyme Assay
Ppt1 enzyme activity levels were assayed as described in Hickey et al, 2006.31 The heads of single flies of the correct genotype were dissected and placed in individual wells of a 96-well plate on ice. Each well was then filled with 20μl of ddH20 and 10μl of substrate (0.375 mg/ml 4MU-6S-palm-β-Glc substrate (Moscerdam Substrates); 0.2 M Na phosphate/0.1 M citrate, pH 4.0; 15 mM DTT; 0.09% BSA, 5 U/ml β-glucosidase). The individual heads were homogenized in the substrate buffer using a 96-well plate homogenizer (Burkard Scientific, UK). The homogenate was incubated for two hours at 30°C. The reaction was stopped by adding 100μl of stop buffer (0.5M NaHCO3/Na2CO3 pH 10.7, 0.025% triton X-100) and then the amount of fluorescence at 460nm was read on a Perkin Elmer HTS7000 BioAssay Reader.
Results
Identification of Drosophila DHHC family transferases
We identified 22 DHHC-Cysteine Rich Domain (CRD) containing proteins in the Drosophila genome by using the Basic Local Alignment Sequence Tool (BLASTp) at NCBI. The same set of proteins were identified when we used the pfam consensus DHHC domain sequence (pfam01529) to perform a BLASTp search of the Drosophila reference sequence protein database and also with a TBLASTn analysis of the complete Drosophila genome sequence translated into six frames. Two isoforms were identified for six of the transferase proteins (CG1407, CG5196, CG5620, CG6618, CG10344, CG17257) and three were identified for CG34449. The variable regions are outside of the conserved DHHC-CRD domain and are based on electronic annotations of the genome that have not been empirically verified. Alignment of the CRD domain from all 22 proteins shows the conserved DHHC region of the domain as well as the multiple cysteine residues for which the domain is named (Figure 1A). One of the proteins, CG17197, has a Histidine to Arginine substitution to produce a DRHC sequence at the core of the domain consensus sequence. The significance of this change on the putative palmitoyl transferase activity is unknown; however, a yeast protein, Akr1, has a histidine to tyrosine change to produce a DHYC sequence that still retains activity.11 Consistent with previous work on this protein family, our analysis of the primary sequence of the fly family members indicated the presence of at least 4 TM regions with the DHHC domain being in close proximity to one of these membrane-spanning sequences (Figure 2). Furthermore, two of the proteins (CG6017/dHIP14 and CG6618) have ankryin repeat regions that are known to play a role in protein-protein interactions.33,34
Figure 1. Drosophila DHHC CRD alignment and Phylogenetic Analysis.
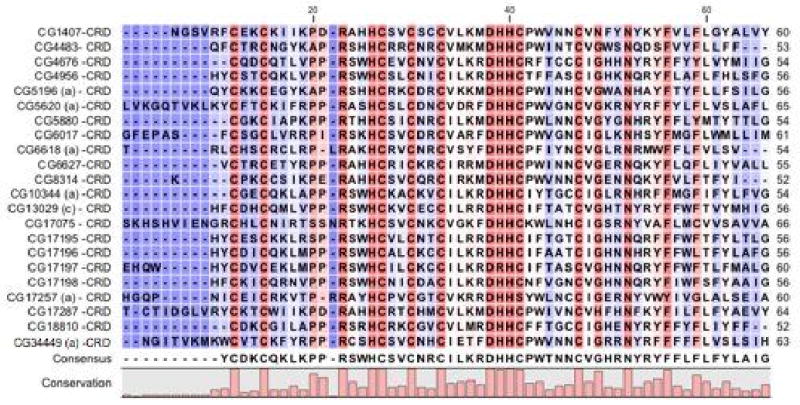
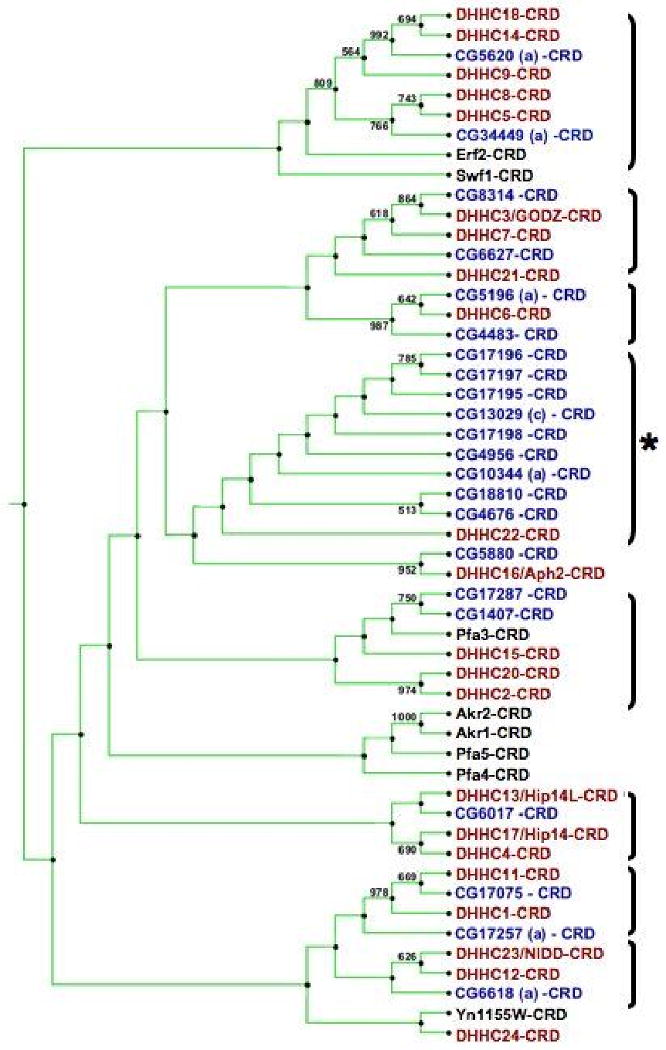
A. A ClustalX alignment of the DHHC Cysteine Rich Domains (CRD) found in twenty-two identified Drosophila DHHC proteins. The DHHC domain was defined by the region that showed high homology to the consensus DHHC domain sequence (pfam01529) found in the pfam database. The amino acid residue's background color indicates the degree of conservation within the Drosophila DHHC CRD domains: red is highly conserved and blue indicates no conservation. The accession numbers for the proteins used in this analysis are: CG1407 (NP_724868), CG4483 (NP_648294), CG4676 (NP_610853), CG4856 (NP_651428), CG5196-PA (NP_650191), CG5620-PA (NP_648561), CG5880 (NP_651539), CG6017 (NP_648824), CG6627 (NP_477449), CG6618-PA (NP_723724), CG8314 (NP_611070), CG10344-PA (NP_726201), CG13029-PC (NP_648928), CG17075 (NP_608508), CG17195 (NP__651427), CG17196 (NP_651426), CG17197 (NP_651425), CG17198 (NP_651424), CG17257-PA (NP_722869), CG17287 (NP_611197), CG18810 (NP_652670), CG34449 (NP_727339). For proteins that have multiple isoforms, only one was used in the alignment. B. A phylogenetic tree of the 22 Drosophila proteins (labeled in blue), 23 human proteins (labeled in red) and 8 yeast proteins (labeled in black) made using nearest neighbor joining analysis on the CRD domain sequences. The Drosophila sequences used are shown in A. The human and yeast sequences were defined based on the analysis done in Mitchell et al. Brackets indicate possible subfamilies within the DHHC domain containing proteins. The asterisk indicates a subfamily that consists of Drosophila proteins that have a testes specific enrichment in the adult. The analysis was done with 1000 bootstraps and only those nodes with bootstrap values higher than 500 (50%) are indicated on the tree. The value is calculated by creating a new data set from a randomly chosen site in the original alignment to create a pseudoalignment. It represents the number of the 1000 bootstrap iterations that supported the branching relationship shown. Phylogenetic analysis was done with CLC Combined Workbench 2.
Figure 2. Drosophila DHHC family structural features.
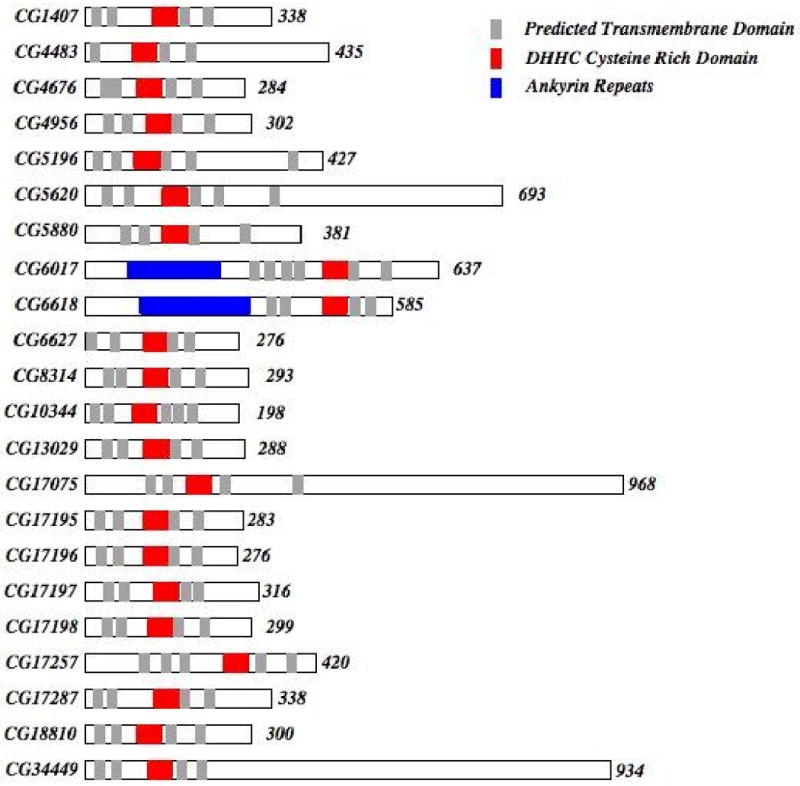
A schematic representation of all 22 identified DHHC domain proteins from N to C terminus showing protein size, conserved protein domains and putative transmembrane domains. The transmembrane domains were predicted using TMHMM (www.cbs.dtu.dk/services/TMHMM-2.0/). Only those transmembrane regions with a probability of 1 as defined by this prediction algorithm are shown. The predicted number of amino acids in each protein is indicated at the end of each protein.
A neighbor joining phylogenetic analysis of aligned yeast, human, and Drosophila DHHC proteins suggests, as reported by several other groups, possible subfamilies of transferase proteins. (Figure 1B). Bootstrapping with 1000 bootstrap repetitions was used to assess the reliability of the tree produced by this method. Figure 1B indicates which relationships had greater than a 50% bootstrap value. Overall, the relationships identified in our tree analysis are consistent with previously published work on the mouse and human DHHC family.2,7,8 CG6017 has previously been demonstrated to be the Drosophila homolog of HIP14 and it falls into the same group in our tree. Also, the Ras palmitoyl transferases Erf2 (yeast) and DHHC9 (Human) group together. The fly proteins CG5620 and CG34449 fall within this group suggesting that one may be the fly Ras PAT ortholog.
While most of the fly proteins are similar to one or more human DHHC proteins, there is a group of Drosophila DHHC proteins that cluster together and, according to FlyAtlas, share a distinct adult expression pattern of high expression in the testes (Table 1).36 Five of these proteins (CG17195, CG17196, CG17197, CG17198, and CG4956) are arranged adjacent to one another in the 96F2 region of the third chromosome and may represent an ancestral gene duplication event. Analysis of the Sophophora subgenus genomes indicates that the duplication event likely occurred after the split between the melanogaster group and the obscura group. Within the melanogaster subgroup, D. melanogaster, D. erecta, D. yakuba have all 5 genes, D. simulans and D. sechellia have 4 and D. ananassae has 3 of the genes. D. pseudoobscura from the obscura group has only the CG4956 ortholog suggesting that this gene was the ancestral gene before the duplication events. Further supporting this idea is the fact that D. grimshawi, a representative genome of the Drosophila subgenus, also has only the CG4956 ortholog.
Drosophila DHHC Gene Expression Patterns
We took several approaches to begin to elucidate the cellular function of this family of proteins during fly development. Often, genes that show high levels of transcription in particular tissues play an important functional role in those cell types. To determine if particular DHHC genes were enriched in a subset of cell types, in situ hybridizations were done with probes specific for all 22 genes on mixed-stage embryo collections and larval brains (Table 1). Only the closely related CG17195, CG17196, CG17197, and CG17198 sequences showed alignments that would suggest that gene-specific anti-sense probes for these genes may cross-hybridize (see Materials and Methods). Four of the twenty-two genes gave a robust and tissue-specific staining pattern on these tissues (Figure 3A). CG5620 showed maternal expression and enrichment within the somatic musculature and gut throughout embryonic development. High expression was observed in the embryonic central nervous system (CNS) and the gut for CG6627. A similar expression pattern was also observed for CG17257 although with reduced intensity, particularly in the CNS in later stages (Figure 3A). Finally, the fly HIP14 homolog CG6017, showed tissue-specific staining of both the developing embryonic CNS and the somatic musculature, as has been reported. 33,34 The anti-sense probes for CG5620 and CG17257 are not isoform specific and thus would not discriminate between differential expression patterns for alternate forms of these two genes. Those genes with enrichment in the embryonic CNS (CG6017, CG6627, and CG17257) and several without (CG1407 and CG6618) showed continued high expression levels in the larval brain and/or the adult CNS (Figure 3B and Table 1). As has been found for the drosophila HIP14 homolog CG6017, these genes are likely to be ubiquitously expressed but may play an important role in the development of the nervous system and musculature.33,34 The other DHHC genes did not have levels of expression in embryos or larval brain/discs that were detectable with the resolution of standard in situ hybridization methods.
Figure 3. Tissue-specific enrichment of palmitoylome genes.
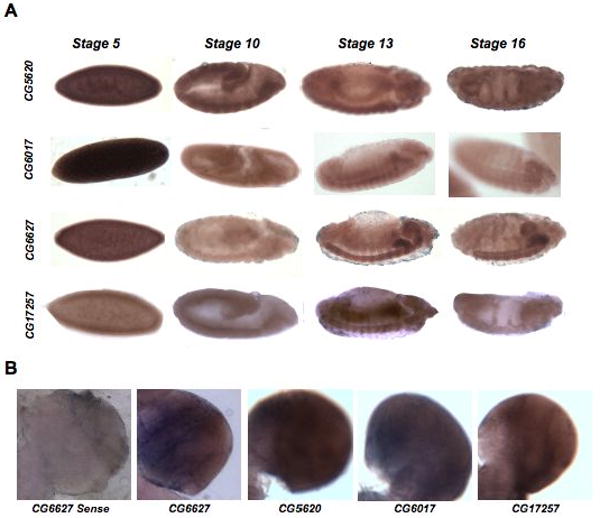
A. This figure catalogs distinct tissue-specific patterns of expression for several of the DHHC proteins as determined by in situ hybridization on mixed-stage Drosophila embryos. The anti-sense staining for four different DHHC genes at four stages of embryonic development is shown. Lateral views of a developmental expression series for each gene proceed from left to right across the figure. A ventral view is shown for the stage 16 CG5620 in situ. Anterior is to the right. Only the DHHC genes that showed obvious enrichment in particular tissues are presented. The rest of the in situ hybridization results are shown in Table 3. B. The anti-sense staining of 3rd instar larval brains for four different DHHC genes is shown. Each image is a close-up of one brain lobe. An example of a sense control for CG6627 is also shown.
Since the lack of an in situ signal does not necessarily rule out gene expression during these stages, we used gene-specific primers to semi-quantitatively detect the expression of all 22 genes on first strand cDNA prepared from 12 Drosophila developmental stages/tissues (Figure 4). In addition, we examined the FlyAtlas microarray database for the adult expression levels of the DHHC genes. These analyses taken together suggest that almost all of the 22 DHHC genes show expression throughout Drosophila development and, at least in the adult, they show enrichment in particular subsets of tissues (Table 1). The RT-PCR assay was performed using Origene Rapid Scan Panels that contain normalized, stage-specific first strand cDNAs that are four-fold serially diluted to ensure both a linear amplification range and a reproducibility of relative amplification levels (see Materials and Methods). All our primer sets produced amplification products only with the most concentrated 1000× and 100× dilution series. We were not able to produce amplification products for CG4956, CG17198, and CG17287 using the Origene panels. However, when we produced our own mixed-sex adult total RNA, RT-PCR analysis demonstrated that these three genes are expressed during adulthood (data not shown). The combination of in situ hybridization, RT-PCR, and published work shows that all 22 DHHC homologs present in the fly genome are expressed genes. 33,34,36
Figure 4. Stage-specific RT-PCR expression panels.
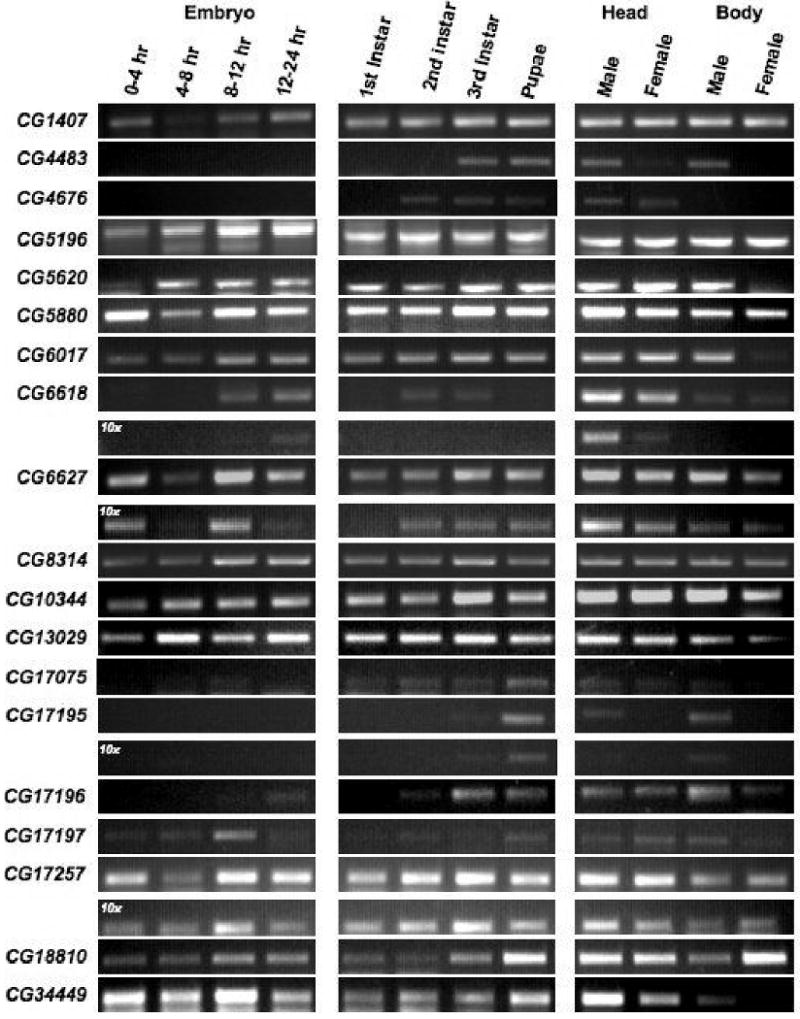
DHHC transferase developmental expression levels were assayed using gene-specific PCR primers on a panel of first-strand cDNA prepared from 12 Drosophila developmental stages/tissues. Those genes (CG4956, CG17198, and CG17287) that failed to give a signal are not shown. The primer sets used in this analysis are shown in Table 2. The 10-fold dilution series for several genes that gave stage or sex specific signals is also shown. This amplification series is labeled as 10×.
Most of the DHHC genes showed relatively uniform expression levels across the developmental PCR panel and any slight relative differences in expression were not repeatable between dilution series. However, several transferase genes did show stage or sex-specific expression levels that were repeatable and maintained in 10-fold dilution amplification reactions (Figure 4). As described previously, the FlyAtlas experiments indicate that a particular subset (indicated by the asterisk in Figure 1B) is highly expressed in adult testes; some of them were restricted to the testes in their analysis (CG4483, CG4946, CG17195, CG17196, CG17197, and CG17198) (Table 1). Our own RT-PCR analysis suggests that the testes enrichment is likely, since all of these genes show male body amplification and little to no female body amplification. However, we found that expression also occurs in male and female heads, demonstrating that there is expression outside of the testes for all of the genes within this group. Two genes in particular, CG4483 and CG17195, have a male-specific enrichment using the RT-PCR assay (Figure 4). CG4483 only gave an amplification product with the most concentrated cDNA array so we could not compare the relative stage specific levels to a ten-fold diluted sample. CG17195 shows adult male-specific amplification products that suggest a high expression in the male head and body. The relative levels of this expression are maintained in the 10-fold dilution amplification products (Figure 4).
Our in situ results and the FlyAtlas microarray database indicate that there are a series of DHHC genes that are highly expressed in neural tissue (Table 1). The RT-PCR results support this for several DHHC genes. CG4676, CG6618, CG6627, and CG17257 show high relative levels of cDNA expression in the adult head versus body suggesting enrichment in neural tissue. We were not able to generate amplification products with a 10-fold dilution for CG4676. For CG6618, CG6627 and CG17257 this relative expression level is maintained in a 10-fold dilution of the first strand cDNA (Figure 4).
DHHC Sub-cellular Localization
To determine the sub-cellular localization of the Drosophila DHHC family of proteins, we tagged the carboxy terminus of each protein with a 6×Myc or YFP tag using the Drosophila Gateway Vector Collection. We were able to obtain full-length cDNAs or amplify our own full-length coding sequences for 21 of the 22 DHHC genes. There are no available cDNAs for CG34449, and we were unable to amplify a full-length cDNA for this gene; therefore, we did not examine the sub-cellular localization of this protein. Constructs for each of the DHHC proteins were transiently transfected into S2 cells and then co-stained with markers for the Golgi and the ER. The Golgi was marked with a mouse-anti Drosophila Golgi monoclonal antibody, and the ER was marked with either a mouse anti-KDEL antibody, which recognizes the KDEL sequence of the ER resident protein BiP, or the live cell dye ER-Tracker Red. To determine our ability to separate the two compartments, we stained S2 cells with the mouse anti-KDEL antibody and a rabbit anti-Drosophila GM 130 cis Golgi marker. Deconvolved images and 3D volume reconstructions of these cells show that the ER and cis Golgi can be differentiated in S2 cells (Figure 5 C-D). These results indicate that the co-localization studies presented below should discern whether the DHHC proteins are found in the Golgi, ER, or both compartments.
Figure 5. DHHC proteins localized to the Golgi.
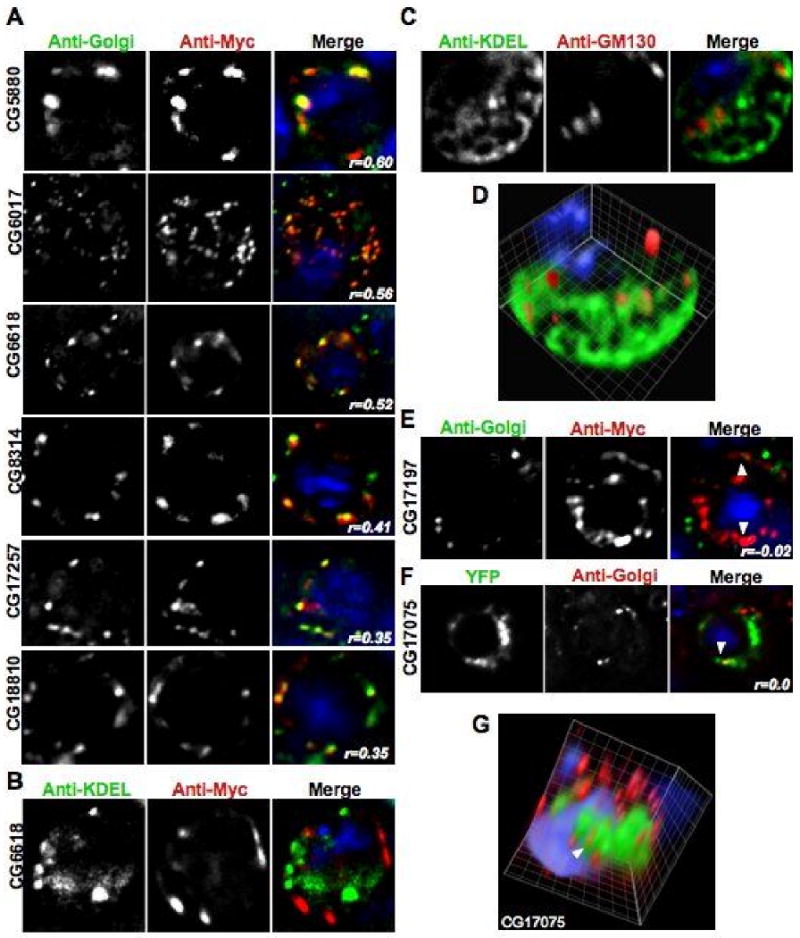
All of the panels show images acquired in each channel and then a merged view. The blue DAPI stain is only shown in the merged view. Unless otherwise noted, the images shown are one section of a deconvolved Z-stack through the cell. A. Representative images of transiently transfected S2 cells that were triple stained with DAPI, anti-Myc, and an anti-Golgi antibody. The Pearson's Correlation statistic (r) for the pixel intensity correlation between the red Myc channel and the anti-Golgi green channel is shown in the merge panel. B. A representative image of a transiently transfected S2 cell that was triple stained with DAPI, anti-Myc, and an anti-KDEL antibody showing a lack of co-localization between CG6618 and the ER marker. C. A representative image of an untransfected S2 cell that was triple stained with DAPI, the cis Golgi marker anti-GM130, and an anti-KDEL antibody showing that the Golgi and ER compartments can be visually separated in S2 cells. D. A volume view produced from a deconvolved Z-stack of the cell shown in C that shows compartment separation in a single S2 cell. E. A representative image of a S2 cell transiently transfected with a CG17197-6×Myc construct. The cell was triple stained with DAPI, an anti-Golgi antibody, and anti-Myc antibody to show that the ER-localized CG17197 is distinct from the anti-Golgi marker. Arrowheads label areas of close association of the two signals. F. A representative image of a S2 cell transiently transfected with a CG17075-YFP construct. The cell was stained with DAPI, and an anti-Golgi antibody to show that the ER-localized CG17075 is distinct from the anti-Golgi marker. An arrowhead labels an area of close association of the two signals. G. A volume view produced from a deconvolved Z-stack of the cell shown in F. An arrowhead labels the same area of close association that is shown in panel F. The volume reconstruction demonstrates that the Golgi signal is distinct from the ER-localized CG17075-YFP protein.
Localization of each tagged DHHC protein was determined by screening the transfected cells with both ER and Golgi organelle markers independently (Table 2). As has been seen with the mammalian homologs, we found that a majority of the fly proteins were primarily located either in the ER or the Golgi with one appearing at the plasma membrane. 8 6×Myc-tagged versions of CG5880, CG6017, CG6618, CG8314, CG17257, and CG18810 all predominantly co-localized with the Golgi marker (Figure 5A). Staining of these same transfected cells showed a lack of co-localization with the anti-KDEL ER marker (Figure 5B). In contrast, CG4483, CG4676, CG5196, CG5620, CG8314, CG10344, CG17195, CG17196, CG17197, CG17198, and CG17287 predominantly co-localized with markers for the ER (Figure 6A). Staining of these same transfected cells showed a lack of co-localization with the anti-Golgi marker (Figure 5E-G). We initially used 6×-Myc tagged versions with the anti-KDEL antibody for ER co-localization, but found that the KDEL staining was not as robust as a live cell dye such as ER-Tracker Red. In light of this, we switched to using GFP tagged versions of the proteins in conjunction with ER-tracker Red. Aberrant ER structures, such as large round ER-positive compartments, were observed in cells expressing CG17195 suggesting that over-expression of this protein has detrimental effects on ER function (data not shown). Work on the human DHHC genes reported similar ER structures when several of the human proteins are expressed in HEK 293T cells.8 Finally, we found that after transient transfection, CG1407-6×Myc was localized to the plasma membrane and lacked any colocalization with either the ER or the Golgi markers (Figure 6B).
Figure 6. DHHC proteins localized to the ER and the Plasma Membrane.
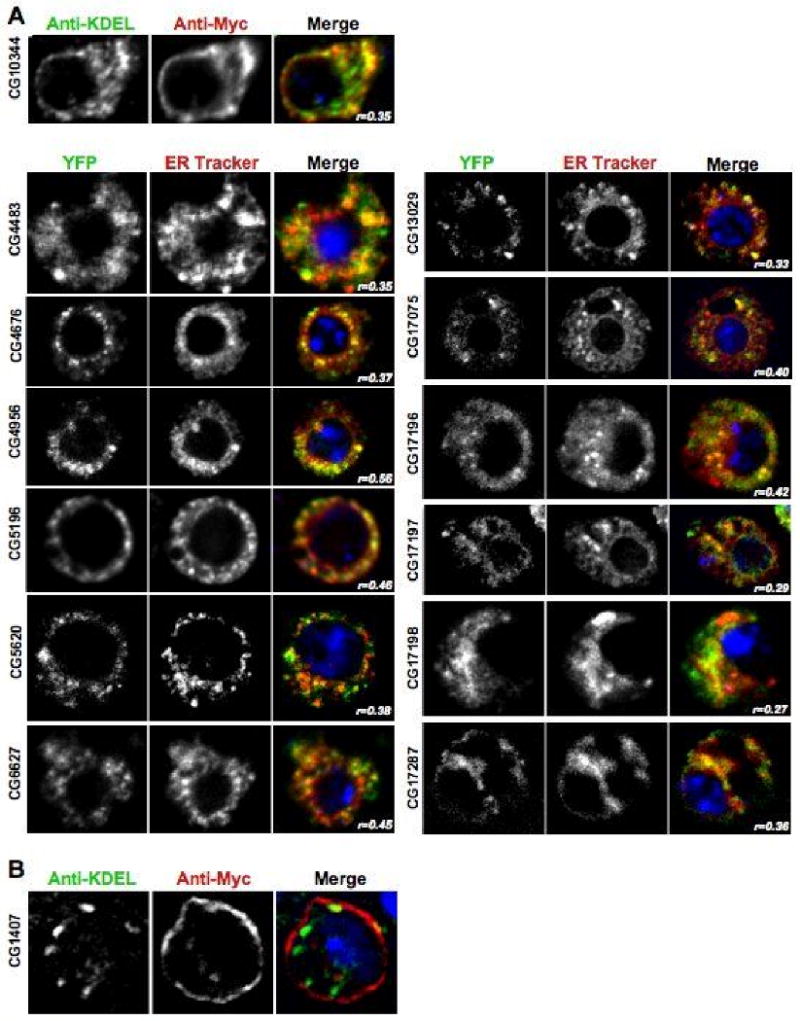
A. Representative images of transiently transfected S2 cells that were triple stained with DAPI, anti-Myc, and an anti-KDEL antibody or cells imaged with DAPI, YFP, and ER-Tracker Red. The panel for each DHHC gene shows the image acquired in each channel and then a merged view. The blue DAPI stain is only shown in the merged view. The images shown are one section of a deconvolved Z-stack through the cell. The Pearson's Correlation statistic (r) for the pixel intensity correlation between the green channel and the red channel is shown in the merge panel. B. Representative image of a S2 cell transiently transfected with a CG1407-6×Myc construct that was triple stained with DAPI, anti-Myc, and an anti-KDEL antibody to demonstrate the plasma membrane localization of the protein. The panel shows the image acquired in each channel and then a merged view. The blue DAPI stain is only shown in the merged view. The image shows one section of a deconvolved Z-stack through the cell.
We used Pearson's Correlation statistic to analyze the co-localization of the tagged proteins with the organellar markers (see Materials and Methods). This statistical approach analyses the pixel intensity correlation between two channels; an r value of -1.0 signifies no correlation, while a value of 1.0 signifies perfect correlation. All the tagged DHHC proteins showed significant positive, although not perfect, r-values using this approach (Figures 5 and 6). This analysis indicates that a significant amount, although not one hundred percent, co-localized with either the Golgi marker or the ER marker. This discrepancy is likely due to differences in expression of the two channels and not localization to another organelle. For example, CG17195 and CG17075 are predominantly ER resident proteins (Figure 6A) that have a negative correlation with the anti-Golgi antibody (Figure 5E-F). Imaging through individual cells indicates regions of close proximity between the Golgi marker and the DHHC protein expression (arrowheads in Figure 5E-F). A volume reconstruction of the double labeled cell shown in Figure 5F indicates that the Golgi signal is distinct from the YFP ER-localized signal (arrowhead in Figure 5G). This is consistent with controls that demonstrate the ability to visually separate the two compartments. Finally, since the YFP tagging was done with the pTWV vector, a Gateway-based variation of the pUAST transformation vector, the results described here also represent a library of YFP-tagged DHHC constructs that can be used to create transgenic flies to examine their in vivo localization.
Drosophila palmitoyl thioesterases
There are three known acyl-thioesterases: the soluble lysosomal enzymes PPT1 and PPT2, and the cytoplasmic APT1. 20 All three proteins have homologs in the fly, but only Ppt1 has been studied in great detail. Loss-of-function mutations in Ppt1 are viable but with a reduced lifespan and, like the Infantile NCL causing human Ppt1 mutations, the flies show a CNS-specific accumulation of autoflourescent material and a cytoplasmic storage phenotype.31 Unlike the human disease, there is no observable neurodegeneration found in the adult flies.31 Over-expression of Ppt1 in the adult visual system produces a degenerative phenotype that was recently used to demonstrate a connection between Ppt1 function and synaptic vesicle cycling and endocytosis.32,37 As part of the elucidation of the Drosophila protein palmitoylome, we further characterized Drosophila Ppt1, Ppt2 and Apt1.
Drosophila Ppt2
The second conserved lysosomal thioesterase, Ppt2 (CG4851), is 29% identical and 43% similar to Ppt1 at the amino acid level.30 The full-length Ppt2 cDNA, EST GH02317 was obtained from the Berkeley Drosophila Genome Project and sequenced. Alignment of our cDNA sequence with the Drosophila genome sequence predicts 5 exons in concurrence with the Flybase annotation of the gene. Translation of the largest open reading frame in GH02317 identifies a protein that is 40% identical and 57% similar to human Ppt2.30 ClustalX alignment of the fly, bovine, and human protein demonstrates the conservation of the catalytic triad between all three species (Figure 7B). Superimposition of the Drosophila amino acid sequence onto the bovine PPT2 crystal structure indicates homology through the active site and palmitate-binding groove between fly and bovine PPT2 (figure 7C).
Figure 7. The Drosophila PPT2 homolog.
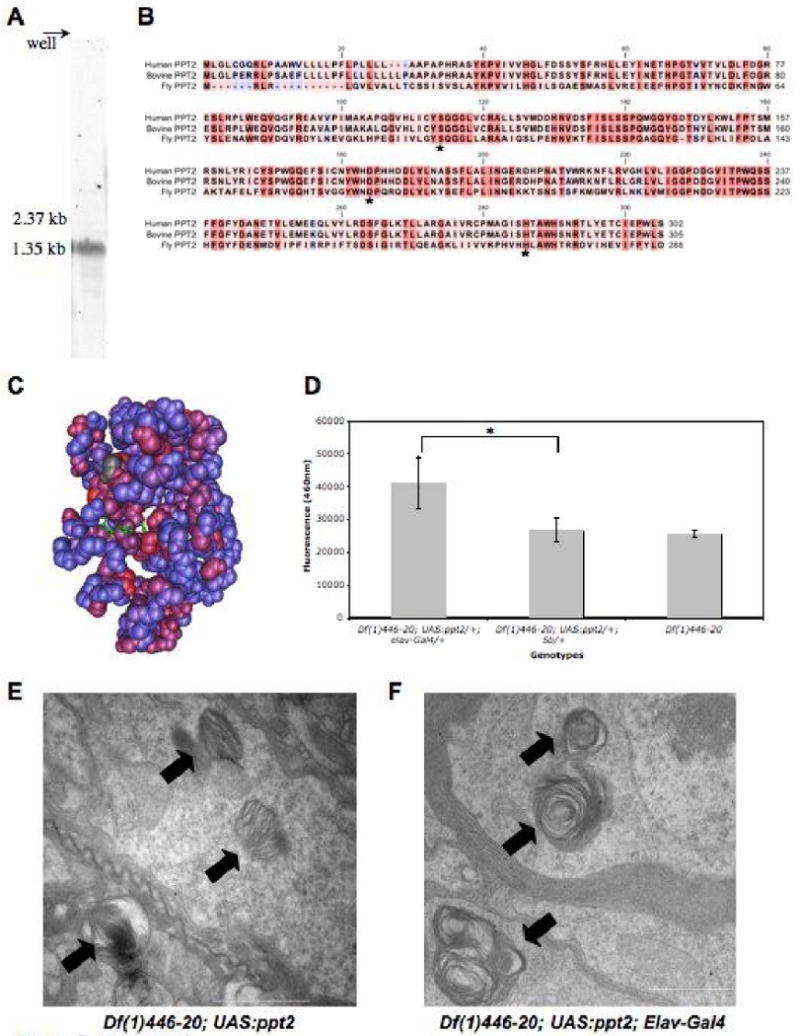
A. A northern blot of adult total RNA showing the ∼1.5kb transcript highlighted by a Ppt2 specific riboprobe. B. Sequence alignment of human, bovine, and fly PPT2 amino acid sequence generated with ClustalX. The amino acid residue's background color indicates the degree of conservation between the proteins: red is highly conserved and blue indicates no conservation. The conserved catalytic triad is indicated with an asterisk. C. Drosophila sequence conservation was mapped onto the PPT2 bovine crystal structure using Cn3D (NCBI). The crystal structure shows conserved regions in red, non-conserved regions in blue, and the conserved catalytic triad in green. D. A graph demonstrating that Ppt2 over-expression in a Ppt1 null background produces significant (*=p<0.0002, t-test) cleavage activity of the PPT1 substrate, 4MU-6S-palm-β-Glc. PPT2 enzyme activity was measured as the mean total fluorescence emitted at 460nm per head.E. Transmission electron micrograph (TEM) image of a Df(1)446-20; UAS:ppt2/+ brain showing inclusions of abnormal storage material. Laminar deposits typical of Ppt1 mutants are indicated with an arrow. F. TEM images of Df(1)446-20; UAS:ppt2/+; Elav-Gal4/+ brains show similar deposits (arrows). Scale bars are 1μm.
To examine Ppt2 expression and transcript size in the fly, northern analysis was performed on total RNA isolated from adult males and females. A riboprobe generated from the GH02317 cDNA detects a single prominent 1.5 Kb transcript with no apparent major splice variants present in the adult (Figure 7A). BLASTn analysis of the Drosophila annotated gene sequence database with the sequence used for the riboprobe shows no other significant matches. This suggests that the very faint lower bands present on the blot may represent degradation products rather than cross-hybridization to other transcripts. The transcript length we observed is consistent with the GH02317 sequence and the predicted exon structure of the Ppt2 gene (http://flybase.bio.indiana.edu). Several approaches were taken to determine the pattern of Ppt2 expression during Drosophila development. Consistent with a lysosomal housekeeping enzyme, in situ hybridization on a collection of mix staged embryos revealed a ubiquitous and low-level of expression during embryonic development with no distinct tissue specific enrichment of the transcript (Table 1). Expression during a range of developmental stages was also semi-quantitatively assayed on a panel of first-strand cDNA prepared from 12 Drosophila developmental stages/tissues using Ppt2 specific PCR primers (Figure 8A). When the expression of Ppt2 was compared to that of Ppt1, the two thioesterases showed similar relative expression across the 12 developmental stages using this assay. The apparent increased expression of Ppt2 in male bodies is consistent with the notion that Ppt2 may be responsible for the residual thioesterase activity observed in adult Ppt1 null mutants.30 Similar to their mammalian counterparts, both Drosophila Ppt1 and Ppt2 are localized to the lysosomes of S2 cells in culture. We determined their localization by transiently transfecting GFP-Ppt1 or Ppt2-YFP into S2 cells and visualizing their co-localization with Lysotracker-Red in live cells. (Figure 8B-C, Table 2). We also demonstrated that the GFP-Ppt1 fusion is functional using a Ppt1-specific flourogenic substrate assay (data not shown).
Figure 8. Expression and localization of the Drosophila thioesterases, Ppt1 and Ppt2.
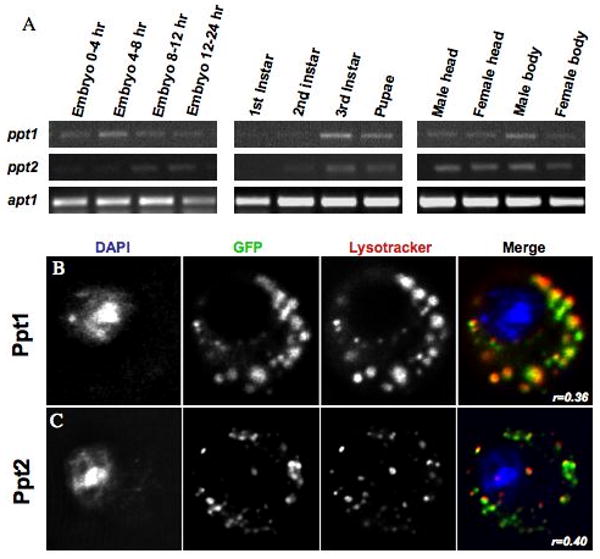
A. Thioesterase developmental expression levels were assayed using gene-specific PCR primers on a panel of first-strand cDNA prepared from 12 Drosophila tissues and developmental stages. B. Live cell imaging of an S2 cell transiently transfected with a GFP-Ppt1 fusion protein. Cells were co-stained with Lysotracker-red and DAPI. C. Live cell imaging of an S2 cell transiently transfected with a Ppt2-YFP fusion protein. Cells were co-stained with Lysotracker-red and DAPI. The Pearson's Correlation statistic (r) for the pixel intensity correlation between the GFP channel and the Lysotracker Red channel is shown in the merge panel.
Over-expression of Ppt2 fails to rescue Ppt1 cellular inclusion phenotypes
At the amino acid level, PPT2 is 27% homologous to PPT1 in mice. 38 Despite the low level of identity, the two proteins have comparable tertiary structures and share the conserved catalytic triad characteristic of lipases.39 Recent structural and biochemical analysis of bovine PPT2 has demonstrated distinct substrate specificity and little functional overlap with bovine PPT1 in vitro. The crystal structure shows that this is due to conformational differences between the two proteins that includes tertiary structure differences that prevent PPT2 from binding fatty acids with bulky head groups and permits the hydrolysis of a wider range of fatty acid chain lengths as compared to PPT1.39 The functional difference between the two proteins is further supported by the failure of endocytosed PPT2 to rescue the lipid metabolic defects in cultured ppt1- patient cells and the divergent phenotypes observed in Ppt1 and Ppt2 knockout mice. 38,40,41 To determine if the two enzymes have divergent substrate specificity in vivo, we examined whether Drosophila Ppt2 could substitute for Ppt1 function using the Gal4/UAS system. We created several independent UAS:Ppt2 lines that were used in conjunction with elav:GAL4 to determine if over-expression of Ppt2 could rescue the CNS cellular inclusion phenotypes associated with loss of Ppt1 in the adult fly. Neural-specific expression of Ppt2 failed to reduce the presence of the CNS-specific inclusion bodies produced in the null Ppt1 mutant, Df(1)446-20 (Figure 8E and F). Expression of the UAS:Ppt2 transgene was confirmed with in situ hybridization on a mixed stage collection of embryos expressing Ppt2 under the control of elav:GAL4 (data not shown). A fluorometric enzyme assay developed for Ppt1 was also used to demonstrate the expression of functional Ppt2 protein by the UAS:Ppt2 line. The biochemical characterization of bovine PPT2 indicates that the enzyme has a very low but significant activity on the Ppt1 substrate 4MU-6S-palm-βglc in vitro.39 A modified version of the assay was done on adult head lysates isolated from flies expressing Ppt2 in a Ppt1 null background. The absence of Ppt1 activity permitted the observation of substrate cleavage by over-expressed Ppt2 protein. Consistent with Ppt2 thioesterase activity overexpression, lysates showed a small but statistically significant increase in substrate cleavage as compared to Ppt1 null lysates alone (Figure 7D). This result also confirms the functional conservation of Ppt2 thioesterase activity in the fly. Finally, over-expression of Ppt1 in the adult visual system produces a degenerative rough eye phenotype and imaginal disc expression is larval lethal. Similar experiments done with UAS:Ppt2 show no adverse affects of high Ppt2 levels further supporting distinct cellular substrates for the two lysosomal thioesterases in vivo (data not shown).
CG18815 is the Drosophila APT1 homolog
APT1, also known as lysophospholipase I, is an evolutionarily conserved cytoplasmic thioesterase. A search of the fly genome identified CG18815 (NP_652674) as the likely Drosophila homolog of this protein. Analysis of the primary protein sequence indicates that CG18815 is 54% identical and 66% similar to the human APT1 protein (NP_006321) (Figure 9A). To initially characterize the expression of the fly homolog, we performed in situ hybridization and RT-PCR. We observed high levels of expression throughout Drosophila development using the RT-PCR panel (Figure 8A) demonstrating that CG18815 is an expressed gene. This expression pattern is also consistent with CG18815 being the major cytoplasmic thioesterase responsible for the cycling of palmitate on modified proteins. In situ hybridization on embryos shows a high level of expression throughout embryonic development with enrichment in neural, endodermal, and somatic mesoderm (Table 1; Figure 9B-E). The neural enrichment is maintained in larval brains and the adult CNS (Figure 9F-G; Table 1).
Figure 9. CG18815 thioesterase is the putative Drosophila APT1 ortholog.
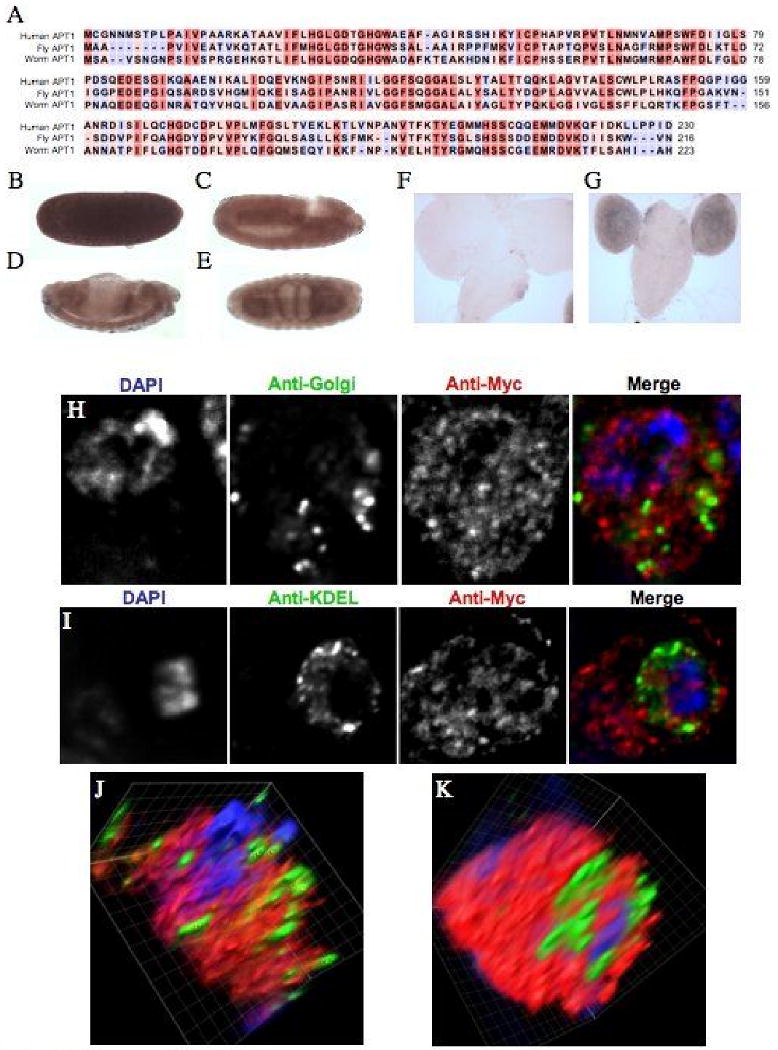
A. Sequence alignment of the human, Drosophila, C. elegans APT1 amino acid sequence generated with ClustalX. The amino acid residue's background color indicates the degree of conservation between the proteins: red is highly conserved and blue indicates no conservation. B-E. The anti-sense staining for CG18815 at four stages of embryonic development is shown. B. Stage 5. C. Stage 10. D. Stage 13. E. Stage 16. Lateral views of a developmental expression series are shown except for the ventral view that is shown for the stage 16 CG18815 in situ. Anterior is to the right. F. A sense probe image of a 3rd instar larval brain CG18815 in situ. G. An image showing specific brain lobe staining in 3rd instar larvae for the CG18815 anti-sense probe. H. Images of fixed S2 cells transiently transfected with a CG18815-6×Myc fusion protein and co-stained with DAPI and an anti-Golgi antibody. I. Images of fixed S2 cells transiently transfected with a CG18815-Myc fusion protein and co-stained with DAPI and an anti-KDEL antibody to mark the ER. J. A volume view produced from a deconvolved Z-stack of the cell shown in C. K. A volume view produced from a deconvolved Z-stack of the cell shown in D.
We analyzed the cellular localization of the CG18815 protein in S2 cells using a myc-tagged version of the protein. Transient transfection of this construct was used in conjunction with Golgi and ER antibodies to determine the localization of the myc-tagged protein. There was no observable co-localization between the CG18815-6×Myc protein with either an anti-Golgi or an anti-KDEL antibody (Figure 9H-I). Three dimensional volume reconstructions of deconvolved Z-stacks from individual cells demonstrate the likely cytoplasmic localization of this protein (Figure 9J-K). In addition, the deconvolved Z-stacks show a punctate vesicle-like localization that also may indicate localization to an endosomal compartment. Live cell imaging of a CG18815-YFP version of the protein in S2 cells further supports these observations (data not shown).
Discussion
This work presents the first extensive expression and localization analysis of the Drosophila proteins involved in S-palmitoylation. The localization pattern of the PAT proteins in S2 cells is consistent with findings in higher eukaryotic systems and confirms the important role for the cytoplasmic face of the Golgi and ER in regulating the addition of palmitate.8 The use of transient transfection of over-expression constructs can produce misleading results if high levels of the proteins induce mislocalization of the tagged protein. At present we cannot address this possibility, but our results indicating CG6017/dHIP14 Golgi localization are consistent with previously published work in the fly.33,34 Furthermore, our demonstration of ER localization for CG6627 is supported by previous work showing this gene's mRNA is down regulated during the ER unfolded protein response in Drosophila S2 cells.42 Future studies of these proteins will require the production of antibodies to examine the endogenous levels and localization of this family of proteins during fly development.
Our RT-PCR analysis reveals that a majority of the DHHC genes in Drosophila are ubiquitously expressed during development. There is an interesting subset of genes that appear to be exclusively or highly expressed in the male testes based on the microarray analysis available at FlyAtlas (Table 1). Our work suggests this may be true for CG4483, CG17195, and CG17075. It also may be likely for CG4956, CG17198, and CG17287 since we were only able to get an RT-PCR signal from adult mRNA and saw no signal with the developmental expression panel. However, we were able to observe female specific signal with CG13029, CG17196, CG17197, and CG18810. Previous work on the thioesterase Ppt1 revealed a very high level of thioesterase activity in male testes lysates as compared to other adult tissues.30 The expression of a subset of DHHC genes combined with high levels of thioesterase activity suggests an important role for palmitoylation in the testes. This idea is supported by the specific expression of human DHHC11 and DHHC19 in human testes.8
Current work on Ppt1 and dHIP14 points to the importance of palmitoylation in normal neural function. dHIP14 is a ubiquitously expressed protein with enrichment in the embryonic and larval CNS. Recent analysis of dHIP14 function and localization in the fly demonstrates that while the protein is Golgi localized in non-neuronal tisses, it is localized to the presynaptic compartment possibly in the plasma membrane. 33,34 Furthermore, the lethality of dHip14 homozygotes is completely rescued by neural-specific expression of the wildtype protein. 33,34 This builds on previous work that demonstrated that dHIP overexpression affects axon-pathfinding in the developing Drosophila embryo.43 Finally, CG17257 has been previously identified as a head transcript that is under circadian regulation.44 In light of these results, it will be important to pursue those DHHC proteins that appear enriched in neural tissue (CG1407, CG6627, and G17257) to determine whether their neuron-specific localization is different from the S2 cell localization presented in this study and whether there are any neuronal loss-of-function phenotypes associated with mutations in these genes.
We have also shown that CG18815 is a ubiquitously expressed gene that is the likely homolog of APT1 in the fly. Its high expression throughout development and cytoplasmic location in S2 cells is consistent with this protein being the major cytoplasmic thioesterase responsible for palmitate cycling. An EP line (EP344) that drives over-expression of CG18815 was identified in a mis-expression screen for alterations in thoracic development indicating that the modulation of palmitoylation by this thioesterase is important for specific developmental signaling events.45 In addition, we were able to demonstrate for the first time that Drosophila Ppt1 and Ppt2 likely reside in lysosomes. Previous attempts by our group and others to produce antibodies that recognize the endogenous Ppt1 protein in Drosophila tissues have failed to generate a useable reagent for immuno-histochemistry. The lysosomal localization and normal enzyme activity of a UAS driven GFP-Ppt1 fusion in S2 cells suggests that this reagent, despite being an over-expression construct, will be useful for analyzing the in vivo localization of the protein. Specifically, it will be important to examine the localization of GFP-Ppt1 in the nervous system which is the primary tissue affected by loss of Ppt1 function in flies, mice, and humans. Our work is also the first demonstration that wildtype Ppt2 activity fails to rescue the in vivo Ppt1 mutant cellular inclusion phenotypes, confirming the likely substrate differences between Ppt1 and Ppt2 that have been postulated based on mouse knock-outs and human cell culture experiments. These data indicate that rather than being general thioesterases, these two proteins regulate the degradation of a specific substrate set.
In addition to pursuing mutational analysis for many of these proteins, the technology has now developed to the point where we can begin to ask about the substrate specificity of Drosophila DHHC genes. In the future, it should be possible to elucidate the full complement of Drosophila palmitoylated proteins and their cognate transferases through the use of defined genetic mutations and biochemistry. More specifically, the opportunity to define the more restricted neural palmitoylome, both transferases and substrate proteins, that are required for normal neural function will provide further insight into how palmitoylation regulates particular cellular processes and how alterations can lead to neural dysfunction.
Supplementary Material
Acknowledgments
We would like to thank Jennifer Genova for help with microscopy and the Wadsworth Center's Electron Microscopy Core Facility. We received materials through the Drosophila Genomics Resource Center. Douglas Rennie at the CBRC Drosophila Core Facility provided embryo injection services. We would also like to thank an anonymous reviewer for insightful comments during the review process. Finally, we would like to thank the students of Biology 312 for helping to construct several of the YFP tagged proteins used in this study. Specifically, we want to acknowledge the contributions of David Williams, Kristin Martin, Ashton Haney, Mark Hutto, Annalise Rahman, Rosetta Derrick, Christopher Louviere, Bronwym Harper, Louisa Young, and Michelle Mejia. This work was supported by funds from National Institutes of Health grant #'s P20-RR16461, R15-HD052362 (CK), and NS44572 (RLG).
Abbreviations
- ppt1
palmitoyl-protein thioesterase 1
- ppt2
palmitoyl-protein thioesterase 2
- apt1
acyl-protein thioesterase 1
- PAT
palmitoyl acyl-transferase
- DHHC
Aspartate-Histidine-Histidine-Cysteine
- CRD
Cysteine Rich Domain
References
- 1.Nadolski MJ, Linder ME. Protein lipidation. FEBS Journal. 2007;274:5202–5010. doi: 10.1111/j.1742-4658.2007.06056.x. [DOI] [PubMed] [Google Scholar]
- 2.Mitchell DA, Vasudevan A, Linder ME, Duchenes RJ. Protein palmitoylation by a family of DHHC protein S-acyltransferases. J Lipid Res. 2006;47:1118–1127. doi: 10.1194/jlr.R600007-JLR200. [DOI] [PubMed] [Google Scholar]
- 3.Linder ME, Deschenes RJ. Model organisms lead the way to protein palmitoyltransferases. J Cell Sci. 2004;117:521–526. doi: 10.1242/jcs.00989. [DOI] [PubMed] [Google Scholar]
- 4.Chamoun Z, Mann RK, Nellen D, von Kessler DP, Bellotto M, Beachy PA, Basler K. Skinny Hedgehog, an Acyltransferase Required for Palmitoylation and Activity of the Hedgehog Signal. Science. 2001;293:2080–2084. doi: 10.1126/science.1064437. [DOI] [PubMed] [Google Scholar]
- 5.Zhai L, Chaturvedi D, Cumberledge S. Drosophila wnt-1 undergoes a hydrophobic modification and is targeted to lipid rafts, a process that requires porcupine. J Cell Biol. 2004;279:33220–33227. doi: 10.1074/jbc.M403407200. [DOI] [PubMed] [Google Scholar]
- 6.Hofmann K. A superfamily of membrane-bound O-acyl-transferases with implications for wnt signaling. Trends Biochem Sci. 2000;25:111–112. doi: 10.1016/s0968-0004(99)01539-x. [DOI] [PubMed] [Google Scholar]
- 7.Fukata M, Fukata Y, Adesnik H, Nicoll RA, Bredt DS. Identification of PSD-95 palmitoylating enzymes. Neuron. 2004;44:987–996. doi: 10.1016/j.neuron.2004.12.005. [DOI] [PubMed] [Google Scholar]
- 8.Ohno Y, Kihara A, Sano Takamitsu, Igarashi Y. Intracellular localization and tissue-specific distribution of human and yeast DHHC cysteine-rich domain-containing proteins. BBA. 2006;1761:474–483. doi: 10.1016/j.bbalip.2006.03.010. [DOI] [PubMed] [Google Scholar]
- 9.Bartels DJ, Mitchell DA, Dong X, Deschenes RJ. Erf2, a novel gene product that affects the localization and palmitoylation of Ras2 in Saccharomyces cerevisiae. Mol Cell Biol. 1999;19:6775–6787. doi: 10.1128/mcb.19.10.6775. [DOI] [PMC free article] [PubMed] [Google Scholar]
- 10.Feng Y, Davis NG. Akr1p and the type I casein kinases act prior to the ubiquitination step of yeast endocytosis: Akr1p is required for kinase localization to the plasma membrane. Mol Cell Biol. 2000;20:5350–5359. doi: 10.1128/mcb.20.14.5350-5359.2000. [DOI] [PMC free article] [PubMed] [Google Scholar]
- 11.Roth AF, Feng Y, Chen L, Davis NG. The yeast DHHC cysteine-rich domain protein Akr1p is a palmitoyl transferase. J Cell Biol. 2002;159:23–28. doi: 10.1083/jcb.200206120. [DOI] [PMC free article] [PubMed] [Google Scholar]
- 12.Zhao L, Lobo S, Dong X, Ault AD, Deschenes RJ. Erf4p and Erf2p form an endoplasmic reticulum-associated complex involved in the plasma membrane localization of yeast Ras proteins. J Biol Chem. 2002;277:49352–49359. doi: 10.1074/jbc.M209760200. [DOI] [PubMed] [Google Scholar]
- 13.Lobo S, Greentree W, Linder M, Deschenes R. Identification of a Ras palmitoyltransferase in Saccharomyces cerevisae. J Biol Chem. 2002;277:41268–41273. doi: 10.1074/jbc.M206573200. [DOI] [PubMed] [Google Scholar]
- 14.Kihara A, Kurotsu F, Sano T, Iwaki S, Igarashi Y. Long-chain base kinase Lcb4 Is anchored to the membrane through its palmitoylation by Akr1. Mol Cell Biol. 2005;25:9189–9197. doi: 10.1128/MCB.25.21.9189-9197.2005. [DOI] [PMC free article] [PubMed] [Google Scholar]
- 15.Valdez-Taubas J, Pelham H. Swf1-dependent palmitoylation of the SNARE Tlg1 prevents its ubiquitination and degradation. EMBO J. 2005;24:2524–2532. doi: 10.1038/sj.emboj.7600724. [DOI] [PMC free article] [PubMed] [Google Scholar]
- 16.Smotrys JE, Schoenfish MJ, Stutz MA, Linder ME. The vacuolar DHHC-CRD protein Pfa3p is a protein acyltransferase for Vac8p. J Cell Biol. 2005;170:1091–1099. doi: 10.1083/jcb.200507048. [DOI] [PMC free article] [PubMed] [Google Scholar]
- 17.Hou H, Subramanian K, LaGrassa TJ, Markgraf D, Dietrich LEP, Urban J, Decker N, Ungermann C. The DHHC protein Pfa3 affects vacuole-associated palmitoylation of the fusion factor Vac8. Proc Natl Acad Sci USA. 2005;102:17366–71. doi: 10.1073/pnas.0508885102. [DOI] [PMC free article] [PubMed] [Google Scholar]
- 18.Lam KKY, Davey M, Sun B, Roth AF, Davis NG, Conibear E. Palmitoylation by the DHHC protein Pfa4 regulates the ER exit of Chs3. J Cell Biol. 2006;174:19–25. doi: 10.1083/jcb.200602049. [DOI] [PMC free article] [PubMed] [Google Scholar]
- 19.Roth AF, Wan J, Bailey AO, Sun B, Kuchar JA, Green WN, Phinney BS, Yates JR, Davis NG. Global analysis of protein palmitoylation in yeast. Cell. 2006;125:1003–1013. doi: 10.1016/j.cell.2006.03.042. [DOI] [PMC free article] [PubMed] [Google Scholar]
- 20.Smotrys J, Linder ME. Palmitoylation of intracellular signaling proteins: regulation and function. Annu Rev Biochem. 2004;73:559–587. doi: 10.1146/annurev.biochem.73.011303.073954. [DOI] [PubMed] [Google Scholar]
- 21.El Husseini A, Bredt DS. Protein palmitoylation: a regulator of neuronal development and function. Nat Rev Neurosci. 2002;3:791–802. doi: 10.1038/nrn940. [DOI] [PubMed] [Google Scholar]
- 22.Duncan JA, Gilman AG. A cytoplasmic acyl-protein thioesterase that removes palmitate from G protein alpha subunits and p21(RAS) J Biol Chem. 1998;273:15830–15837. doi: 10.1074/jbc.273.25.15830. [DOI] [PubMed] [Google Scholar]
- 23.Duncan JA, Gilman AG. Characterization of Saccharomyces cerevisiae acyl-protein thioesterase 1, the enzyme responsible for G protein alpha subunit deacylation in vivo. J Biol Chem. 2002;277:31740–31752. doi: 10.1074/jbc.M202505200. [DOI] [PubMed] [Google Scholar]
- 24.Yeh DC, Duncan JA, Yamashita S, Michel T. Depalmitoylation of endothelial nitric-oxide synthase by acyl-protein thioesterase 1 is potentiated by Ca(2+)-calmodulin. J Biol Chem. 1999;274:33184–33154. doi: 10.1074/jbc.274.46.33148. [DOI] [PubMed] [Google Scholar]
- 25.Vesa J, Hellsten E, Verkruyse LA, Camp LA, Rapola J, Santavuori P, Hofmann SL, Peltonen Mutations in the palmitoyl protein thioesterase gene causing infantile neuronal ceroid lipofuscinosis. Nature. 1995;376:584–587. doi: 10.1038/376584a0. [DOI] [PubMed] [Google Scholar]
- 26.Ducker CE, Stettler EM, French KJ, Upson JJ, Smith CD. Huntington interacting protein 14 is an oncogenic human protein: palmitoyl acyltransferase. Oncogene. 2004;23:9230–9237. doi: 10.1038/sj.onc.1208171. [DOI] [PMC free article] [PubMed] [Google Scholar]
- 27.Huang K, Yanai A, Kang R, Arstikaitis P, Singaraja RR, Metzler M, Mullard A, Haigh B, Gauthier-Campbell C, Gutekunst CA, Hayden MR, El-Husseini A. Huntington interacting protein HIP14 is a palmitoyl transferase involved in palmitoylation and trafficking of multiple neuronal proteins. Neuron. 2004;44:977–986. doi: 10.1016/j.neuron.2004.11.027. [DOI] [PubMed] [Google Scholar]
- 28.Mukai J, Liu H, Burt RA, Swor DE, Lai WS, Karayiorgou M, Gogos JA. Evidence that the gene encoding ZDHHC8 contributes to the risk of schizophrenia. Nat Genet. 2004;36:725–731. doi: 10.1038/ng1375. [DOI] [PubMed] [Google Scholar]
- 29.Mansouri MR, Marklund L, Gustavsson P, Davey E, Carlsson B, Larsson C, White I, Gustavson KH, Dahl N. Loss of ZDHHC15 expression in a woman with a balanced translocation t(X;15)(q13.3;cen) and severe mental retardation. Eur J Hum Genet. 2005;13:970–977. doi: 10.1038/sj.ejhg.5201445. [DOI] [PubMed] [Google Scholar]
- 30.Glaser RL, Hickey AJ, Chotkowski HL, Chu-Lagraff Q. Characterization of Drosophila palmitoyl-protein thioesterase 1. Gene. 2003;312:271–279. doi: 10.1016/s0378-1119(03)00623-1. [DOI] [PubMed] [Google Scholar]
- 31.Hickey AJ, Chotkowski HL, Singh N, Ault JG, Korey CA, MacDonald ME, Glaser RL. Palmitoyl-protein thioesterase 1 deficiency in Drosophila melanogaster causes accumulation of abnormal storage material and reduced life span. Genetics. 2006;172:2379–2390. doi: 10.1534/genetics.105.053306. [DOI] [PMC free article] [PubMed] [Google Scholar]
- 32.Buff H, Smith AC, Korey CA. Genetic modifiers of Drosophila palmitoyl-protein thioesterase 1-induced degeneration. Genetics. 2007;176:209–220. doi: 10.1534/genetics.106.067983. [DOI] [PMC free article] [PubMed] [Google Scholar]
- 33.Ohyama T, Verstreken P, Ly CV, Rosenmund T, Rajan A, Tien AC, Haueter C, Schulze KL, Bellen HJ. Huntingtin-interacting protein 14, a palmitoyl transferase required for exocytosis and targeting of CSP to synaptic vesicles. J Cell Biol. 2007;179:1481–1496. doi: 10.1083/jcb.200710061. [DOI] [PMC free article] [PubMed] [Google Scholar]
- 34.Stowers R, Isacoff E. Drosophila Huntingtin-Interacting Protein 14 Is a Presynaptic Protein Required for Photoreceptor Synaptic Transmission and Expression of the Palmitoylated Proteins Synaptosome Associated Protein 25 and Cysteine String Protein. J Neurosci. 2007;27:12874–12883. doi: 10.1523/JNEUROSCI.2464-07.2007. [DOI] [PMC free article] [PubMed] [Google Scholar]
- 35.Van Vactor D, Kopczynski C. Anatomical techniques for analysis of nervous system development in the Drosophila embryo. In: Richter J, editor. A Comparative Methods Approach to the Study of Oocytes and Embryos. New York, NY: Oxford University Press; 1999. pp. 490–513. [Google Scholar]
- 36.Chintapalli VR, Wang J, Dow JAT. Using FlyAtlas to identify better Drosophila melanogaster models of human disease. Nature Genetics. 2007;39:715–720. doi: 10.1038/ng2049. [DOI] [PubMed] [Google Scholar]
- 37.Korey CA, MacDonald ME. An over-expression system for characterizing Ppt1 function in Drosophila. BMC Neuroscience. 2003;4:30. doi: 10.1186/1471-2202-4-30. [DOI] [PMC free article] [PubMed] [Google Scholar]
- 38.Soyombo AA, Hofmann SL. Molecular Cloning and Expression of Palmitoyl-protein Thioesterase 2 (PPT2), a Homolog of Lysosomal Palmitoyl-protein Thioesterase with a Distinct Substrate Specificity. J Biol Chem. 1997;272:27456–27463. doi: 10.1074/jbc.272.43.27456. [DOI] [PubMed] [Google Scholar]
- 39.Calero G, Gupta P, Nonato MC, Tandel S, Biehl ER, Hofmann SL, Clardy J. The crystal structure of palmitoyl protein thioesterase-2 (PPT2) reveals the basis for divergent substrate specificities of the two lysosomal thioesterases, PPT1 and PPT2. J Biol Chem. 2003;278:37957–37964. doi: 10.1074/jbc.M301225200. [DOI] [PubMed] [Google Scholar]
- 40.Gupta P, Soyombo AA, Atashband A, Wisniewski KE, Shelton JM, Richardson JA, Hammer RE, Hofmann SL. Disruption of PPT1 or PPT2 causes neuronal ceroid lipofuscinosis in knockout mice. Proc Natl Acad Sci USA. 2001;98:13566–13571. doi: 10.1073/pnas.251485198. [DOI] [PMC free article] [PubMed] [Google Scholar]
- 41.Gupta P, Soyombo AA, Shelton JM, Wilkofsky IG, Richardson JA, Wisniewski KE, Hofmann SL. Disruption of PPT2 in mice causes an unusual lysosomal storage disorder with neurovisceral features. Proc Natl Acad Sci USA. 2003;100:12325–12330. doi: 10.1073/pnas.2033229100. [DOI] [PMC free article] [PubMed] [Google Scholar]
- 42.Hollien J. Decay of Endoplasmic Reticulum-Localized mRNAs During the Unfolded Protein Response. Science. 2006;313:104–107. doi: 10.1126/science.1129631. [DOI] [PubMed] [Google Scholar]
- 43.Kraut R, Menon K, Zinn K. A gain-of-function screen for genes controlling motor axon guidance and synaptogenesis in Drosophila. Curr Biol. 2001;11:417–430. doi: 10.1016/s0960-9822(01)00124-5. [DOI] [PubMed] [Google Scholar]
- 44.Claridge-Chang A, Wijnen H, Naef F, Boothroyd C, Rajewsky N, Young MW. Circadian regulation of gene expression systems in the Drosophila head. Neuron. 2001;32:657–71. doi: 10.1016/s0896-6273(01)00515-3. [DOI] [PubMed] [Google Scholar]
- 45.Pena-Rangel MT, Rodriguez I, Riesgo-Escovar JR. A misexpression study examining dorsal thorax formation in Drosophila melanogaster. Genetics. 2002;160:1035–1050. doi: 10.1093/genetics/160.3.1035. [DOI] [PMC free article] [PubMed] [Google Scholar]
Associated Data
This section collects any data citations, data availability statements, or supplementary materials included in this article.