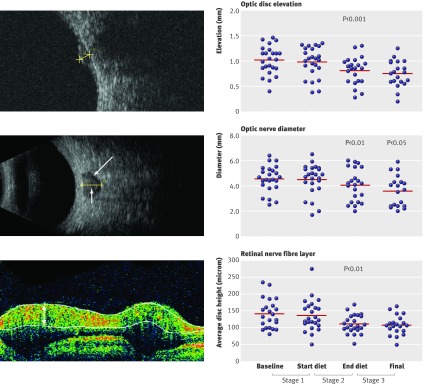
Fig 3 Quantification of papilloedema. Optic disc elevation: in ultrasound image, callipers measure from maximum disc height to lamina cribrosa; scatter plot shows means. Optic nerve diameter: in ultrasound image, callipers mark maximum pial diameter, short arrow indicates cross section through optic nerve, long arrow marks distended cerebrospinal fluid; scatter plot shows means. Retinal nerve fibre layer: in optical coherence tomogram image, arrow marks peripapillary distension; scatter plot shows means. P values are for changes from previous time point

An official website of the United States government
Here's how you know
Official websites use .gov
A
.gov website belongs to an official
government organization in the United States.
Secure .gov websites use HTTPS
A lock (
) or https:// means you've safely
connected to the .gov website. Share sensitive
information only on official, secure websites.
