

Abstract
It is well established that the primate parietal cortex plays an important role in visuospatial processing. Parietal cortex damage in both humans and monkeys can lead to behavioral deficits in spatial processing, and many parietal neurons, such as in the macaque lateral intraparietal area (LIP), are strongly influenced by visual–spatial factors. Several recent studies have shown that LIP neurons can also convey robust signals related to nonspatial factors, such as color, shape, and the behavioral context or rule that is relevant for solving the task at hand. But what is the relationship between the encoding of spatial factors and more abstract, nonspatial, influences in LIP? To examine this, we trained monkeys to group visual motion patterns into two arbitrary categories, and recorded the activity of LIP neurons while monkeys performed a categorization task in which stimuli were presented either inside each neuron's receptive field (RF) or at a location in the opposite visual field. While the activity of nearly all LIP neurons showed strong spatial dependence (i.e., greater responses when stimuli were presented within neurons' RFs), we also found that many LIP neurons also showed reliable encoding of the category membership of stimuli even when the stimuli were presented away from neurons' RFs. This suggests that both spatial and nonspatial information can be encoded by individual LIP neurons, and that parietal cortex may be a nexus for the integration of visuospatial signals and more abstract task-dependent information during complex visually based behaviors.
Introduction
Neuropsychological and neurophysiological studies have established that the cortical areas in and around the intraparietal sulcus (IPS) are important for spatial perception and spatial behaviors such as reaching and saccadic eye movements. Damage or inactivation of these areas often results in deficits in visuospatial processing or visually guided actions (Critchley, 1953; Wardak et al., 2002).
Neurophysiological studies in nonhuman primates have also given considerable support for parietal cortex's role in spatial processing. The macaque lateral intraparietal area (LIP) has been studied with particular intensity. While its precise role in visuospatial and visuomotor processing is debated, it is widely agreed that neuronal responses in LIP seem well suited for a role in spatial processing, and are neither purely sensory nor purely motor in nature. For example, most LIP neurons show short latency responses to visual stimuli presented within their receptive field (RF), but many LIP neurons also fire persistently when the animals covertly attend to or plan saccades to the location of the RF, even in the absence of an explicit visual target (Mountcastle et al., 1975; Gnadt and Andersen, 1988; Bisley et al., 2004).
Other studies have found neuronal encoding in the intraparietal sulcus that is difficult to explain based on a purely spatial processing framework. For example, in our laboratory we trained monkeys to perform a categorization task in which they grouped 360° of visual motion directions into two arbitrary groups, or “categories,” that were separated by a learned category boundary. Neurophysiological recordings from LIP neurons revealed encoding of the category membership of visual stimuli: neurons showed stronger and more uniform responses to all the directions in one category, and weaker responses to stimuli in the other category, with a sharp difference in activity between directions on different sides of the category boundary (Freedman and Assad, 2006). This suggested a plasticity of direction selectivity that depended on the behavioral relevance of those motion directions. Thus category selectivity in LIP could not be easily explained by differences in spatial attention or planned eye movements between the two categories, because stimuli from both categories were always presented at the same location within the RF, and because the categories were not paired with unique, spatially distinct behavioral responses (Freedman and Assad, 2006).
Other studies have also shown that LIP neurons can reflect a variety of factors, such as value- and decision-related variables (Platt and Glimcher, 1999; Shadlen and Newsome, 2001; Gold and Shadlen, 2007). However, these previous studies generally required the animals to signal their behavioral report in a manner that was inherently spatial, such as an eye movement toward or away from the RF, making it difficult to dissociate the influences of spatial and nonspatial factors (Maunsell, 2004). More generally, the relationship between spatial factors and nonspatial influences in parietal cortex is unclear. Is nonspatial encoding independent of spatial encoding, or are the two related in some way? This question is central to understanding how parietal cortex integrates or associates information from different parts of the brain. For example, nonspatial information could be forwarded to LIP from neurons with discrete RFs that overlap the RFs of LIP neurons, so that spatial and nonspatial encoding would be closely intertwined. Alternatively, nonspatial information could be fed to LIP from neurons with nonoverlapping or less precise RFs, perhaps by feedback from frontal brain areas.
In this study, we have addressed these issues by examining the spatial dependence of the nonspatial motion-category effects in LIP that we had observed in our previous studies (Freedman and Assad, 2006). We trained monkeys to perform a task in which they again had to identify and match the category of motion stimuli. Previously, the stimuli were always presented within each neuron's RF. Here, we examined the relationship between spatial effects and nonspatial category effects in LIP by placing the stimuli either inside the RF or outside the RF.
Materials and Methods
Physiological techniques.
Two male rhesus monkeys (Macaca mulatta, ∼14.5 kg) were implanted with a head post, scleral search coil, and recording chamber. Recording chambers were centered at coordinates posterior 3.0 mm, lateral 10.0 mm relative to the intra-aural line and allowed access to the intraparietal sulcus via a dorsal approach. All surgical and experimental procedures followed Harvard Medical School and National Institutes of Health guidelines. Electrophysiological recordings were made from single neurons using tungsten microelectrodes (FHC, 75 μm shaft diameter) and a guide-tube/grid system. Spike times were recorded with 1 ms resolution, and waveforms were sorted online using a dual amplitude–time window discriminator (BAK Electronics). Horizontal and vertical eye positions were measured using the sclera search coil technique (Robinson, 1963; Judge et al., 1980) (Riverbend Instruments) and sampled at 200 Hz.
During LIP recordings, electrode penetrations sequentially encountered both the medial and lateral banks of the IPS. IPS neurons were tested with a delayed memory-saccade task, and most were also tested with a spot of light flashed over a grid of locations while the animal passively fixated (grid width: 25.0°, grid spacing: 5.0°) to generate a detailed spatial map of each neuron's RF. Neurons were considered to be in LIP if they showed spatially selective delay activity during the memory-saccade task or were located between such neurons in that electrode penetration. LIP neurons were not prescreened for direction selectivity.
Delayed match-to-category task.
Over the course of several weeks of training, monkeys learned to group 360° of motion directions into two categories that were separated into two arbitrary groups by a learned category boundary (Fig. 1a). During training, stimuli were chosen in 1.0° increments, but for neurophysiological recordings, monkeys were tested with six evenly spaced motion directions that were either 30° or 90° from the category boundary. Two monkeys were trained to perform a delayed match-to-category (DMC) task in which they had to indicate (by releasing a lever) whether a sample and a test stimulus (separated by a 1 s delay) were in the same category (Fig. 1b). If the test stimulus was not a category match to the sample, a second test stimulus that was always a match to the sample was presented after a brief delay. The motor response (the lever release) indicated “match” and was thus not rigidly associated with either category. On each trial, the directions of both sample and test stimuli were selected randomly, and the monkeys could not predict (during the sample or delay periods) whether a trial would require a lever release to the first test stimulus. Because of this task design, any neuronal selectivity observed during the sample and delay epochs could not be attributed to differences in motor planning and is due to selectivity among the sample stimuli themselves.
Figure 1.

DMC task. a, Monkeys were trained to group six evenly spaced directions of random-dot motion into two categories (corresponding to the red and blue arrows) separated by a learned “category boundary.” b, Monkeys performed a DMC task. A sample stimulus was followed by a delay and test stimulus. If the sample and test were in the same category (a match), the monkey was required to release a lever before the test disappeared. If the test was a nonmatch, there was a second delay followed by a match (that required a lever release). Note that two directions could be visually dissimilar but belong on the same category, while visually similar directions could belong to different categories. Match and nonmatch trials were randomly interleaved.
The monkeys were initially trained to perform the DMC task with stimuli in the visual hemifield that was contralateral to their LIP recording chamber, and on a given trial, sample and test stimuli were always presented in the same location on the display monitor. After this initial training and subsequent neurophysiological recordings (these were the same two monkeys used in our previous study with the DMC task), the monkeys were given considerable practice (>1 month of daily training sessions) on the DMC task with sample and test stimuli presented at different locations from one another within a trial, and at any location on the display monitor (the previously untrained visual hemifield was emphasized during these training sessions). During LIP recordings, we used a memory delayed saccade task and a “passive” RF-mapping task (see above) to identify two locations on the display monitor (one inside and one outside the RF) for further testing. Monkeys performed the DMC task in four blocks of 54 trials (on average, nine trials for each of the six sample-stimulus directions in each block), which tested each of the four possible combination of sample and test stimuli presented inside and outside of that neuron's RF (Fig. 2a). Because separate blocks were used for the four spatial conditions, the animals could come to expect the stimuli to fall either inside or outside the RF on a given trial. During recording sessions, monkeys performed at least two cycles (and often three) through each of the four blocks. Monkeys typically completed a block of 54 trials in ∼5–6 min, resulting in ∼20–25 min per block cycle. The relatively rapid progression through the four blocks and repeated cycles allowed us to minimize and evaluate differences in behavioral and neurophysiological parameters between the four blocks. These factors could include changes in the animal's motivation and quality of neuronal recording. For each neuron in our population, we took care to only include neurons with high recording quality and stable isolation. In addition, we examined peristimulus time histograms for each neuron separately in each block cycle to verify stable neuronal responses and selectivity across cycles.
Figure 2.
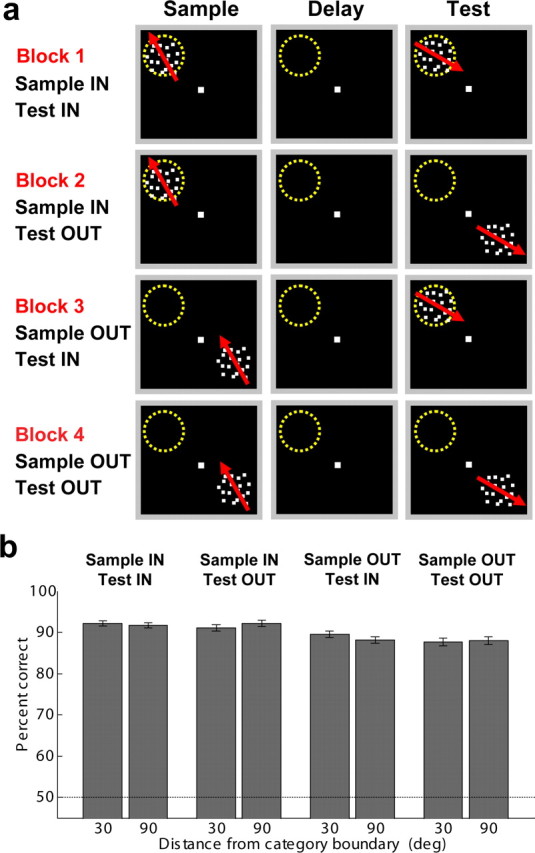
Spatial location of stimuli relative to LIP RFs and behavioral performance. a, Sample and test stimuli were presented either inside or outside LIP RFs in four blocks of 54 trials, and monkeys typically worked for two or more cycles through the four blocks. Sample stimuli were presented inside the RF in blocks 1 and 2, while test stimuli were presented inside the field in blocks 1 and 3. b, The monkeys' average DMC-task performance across all recording sessions was greater than chance (50%) both for sample stimuli that were close to (30°) and farther from (90°) the category boundary. Behavioral performance was >85% correct when sample and test stimuli were presented either inside or outside LIP RFs, although performance was slightly worse when stimuli were presented in the ipsilateral hemifield (where the monkeys had less experience and training on the task). Error bars indicate the standard error of the mean. deg, Degress.
Stimuli were circular patches (9.0° diameter) of ∼300 high contrast 0.1° square dots that moved in one of six directions (evenly spaced at 60° apart) with 100% motion coherence and at a speed of 12.0°/s. For the majority of recordings (n = 22 neurons from monkey S and 47 neurons from monkey H), directions between 45° and 225° were in one category while the remaining directions were in another. For the remaining sessions (n = 15 neurons from monkey H), directions between −45° and 135° were in one category while the remaining directions were in another. Trials began with the onset of a 0.25° spot that monkeys were required to fixate within a ±1.5° square window for the duration of the trial. Trials were followed by a ∼1.5 s intertrial interval, and monkeys typically performed >1500 correct trials each day.
Data analysis.
All analyses were conducted across correct trials. The pattern of behavioral and neuronal results was similar, and all main effects were observed in both monkeys. Thus we have combined the two datasets for all population analyses. For population analyses, firing rates were computed for each neuron in three time windows corresponding to the three phases of the task—sample, delay, and test. The sample epoch was a 650 ms window that began 75 ms after sample onset (to account for neuronal response latencies). The delay epoch was the final 650 ms of the delay period, and the test epoch was 300 ms in duration beginning at test onset. The test epoch was necessarily shorter since the “match” trials ended with the monkey's reaction.
To assess whether and how the firing of individual neurons reflected the learned direction categories, we computed two parameters for each neuron: a between-category difference (BCD) in firing rate between pairs of stimuli in different categories and a within-category difference (WCD) in activity for stimuli in the same category. For both BCD and WCD, we computed the difference in firing rate between all possible pairs of motion directions that were either 60° or 120° apart, and these two intervals (60° and 120°) were equally weighted in the BCD and WCD calculation. From these values, we constructed a selectivity index by calculating the difference between BCD and WCD divided by their sum, which gave values between −1 and 1. Positive values of the index indicate larger differences in activity between categories and more similar activity within each category, while values near zero indicate that there was no difference in average firing between and within categories.
The time courses of category and spatial selectivity were evaluated and compared using a receiver-operating characteristic (ROC) analysis (Green and Swets, 1966; Tolhurst et al., 1983) with a sliding analysis window. The area under the ROC curve was computed and returned a value between 0.5 and 1.0, indicating the performance of an ideal observer in discriminating between firing rates of the two groups (i.e., the two spatial locations or the two categories). In both cases, we used a 50 ms analysis window that was stepped in 5 ms intervals over the course of the trial. Qualitatively similar results were observed with ROC windows of a variety of widths. The time course of category selectivity was determined by computing ROC values using the firing rates on trials in which the sample stimulus was in category 1 versus trials in which the sample was in category 2. The time course of spatial selectivity was determined by comparing firing rates between trials in block 1 (sample and test stimuli in the RF) and those in block 4 (sample and test stimuli outside the RF). Across the LIP population, the latency of selectivity was defined as the time at which the mean ROC value during the fixation period was exceeded by 5 SDs for three consecutive time epochs.
Results
Across all behavioral sessions during which we successfully recorded from an LIP neuron (n = 84), the monkeys performed the DMC task with a high level of accuracy (mean 90.0% correct, excluding fixation breaks) on all four spatial blocks (see Materials and Methods), although performance was slightly higher when sample stimuli were presented in the contralateral visual hemifield (91.7% correct on average during blocks 1 and 2) than when they were presented in the ipsilateral hemifield (88.3% correct on average during blocks 3 and 4) (Fig. 2b) according to a paired t test comparing average performance with sample stimuli presented in the contralateral versus ipsilateral visual hemifields (p = 3.0 × 10⁻⁹). This difference in behavioral performance is likely due to the animals' training history, as both monkeys were subjects in our previous study using the DMC task in which stimuli were typically presented in the hemifield contralateral to the recording chamber. The two monkeys' average reaction time during the DMC task were 347.2 ms and 394.9 ms, respectively.
We recorded from 84 LIP neurons from two monkeys (monkey H, n = 62; monkey S, n = 22) during performance of the DMC task, in four blocks of trials with sample and test stimuli presented both inside and outside each neuron's RF, as described above. Stability of neuronal isolation was monitored in real time during recordings, as we recorded from only one neuron at a time with a single electrode (see Materials and Methods). We also conducted a one-way ANOVA (with the block cycle number as the factor) to evaluate whether neurons showed statistically similar baseline firing rates across repeated block cycles. Indeed, we found that a majority of LIP neurons (60% or n = 50/84) showed consistent baseline firing rates across repetitions of the same block type (i.e., did not show a main effect of block cycle; p > 0.01). We also verified that all analyses yielded qualitatively similar results when applied only to this subset of the neuronal population. Before running the DMC task, we estimated the RF location and size using a delayed-saccade task and a simple RF-mapping protocol using a flashed stimulus while the animals passively fixated. The size of LIP RFs was approximately proportional to their eccentricity, although their shapes were often irregular (noncircular).
Not surprisingly, LIP activity during the DMC task depended greatly on whether stimuli were presented inside or outside the neurons' RFs. This is clearly evident in the population peristimulus time histograms averaged across the entire population of LIP neurons (Fig. 3). When sample stimuli were presented within LIP neurons' RFs (during blocks 1 and 2), the population showed a strong visual response during the sample period and persistent elevated firing rates during the delay period (Fig. 3a, Table 1). In contrast, the LIP population did not show elevated firing rates during the sample or delay periods when stimuli were presented away from each neuron's RF (Fig. 3b, Table 1). Similar effects were also observed during the test period: average neuronal responses were strong when test stimuli were presented inside the RF and much weaker when test stimuli were presented away from the RF (Fig. 3a,b).
Figure 3.

LIP population activity depended on stimulus location relative to neurons' RFs. Population histograms (averaged across correct trials and all motion directions) across the entire LIP population from both monkeys (n = 84 neurons) show the strength and time course of neuronal activity when sample stimuli were presented inside (a) and outside (b) LIP RFs. In both plots, the darker and lighter traces correspond to test stimuli presented inside and outside neurons' RFs, respectively. Neuronal activity for these plots was smoothed by convolving the raw firing rates with a Gaussian with a width of 10 ms. The three vertical dotted lines on each panel indicate (from left to right) the times of sample onset, sample offset, and test onset.
Table 1.
Incidence of visual responsiveness above baseline in LIP
| In–in (block 1) | In–out (block 2) | Out–in (block 3) | Out–out (block 4) | |
|---|---|---|---|---|
| Sample | 66 | 64 | 9 | 5 |
| Delay | 43 | 37 | 19 | 15 |
| Test | 70 | 18 | 71 | 18 |
Numbers indicate number of neurons with significant effects (paired t test, p < 0.01). n = 84 neurons.
As in our previous study using the DMC task, many LIP neurons showed activity during the sample or delay periods that reflected the category membership of the sample stimuli when those stimuli were presented within the neurons' RFs. This effect is evident in the single-neuron examples in Figure 4, a and b. When sample stimuli were presented inside the RF (during blocks 1 and 2), each neuron showed a relatively uniform level of responses to stimuli within each category and a sharp difference in activity between categories during the sample and/or delay periods. When sample stimuli were presented outside the RF (during blocks 3 and 4), each of these neurons responded more weakly on average; however, they still showed clear selectivity between the two categories, and that selectivity reflected the same category preference as when the stimuli were presented inside the RF. The third single-neuron example (Fig. 4c) also showed clear category selectivity for the remotely presented sample stimuli, even though its activity was suppressed during the sample period when sample stimuli were presented inside the RF (as for all of our LIP recordings, the RF location for this neuron was defined as the location that selectively elicited delay-period activity during the memory-saccade task).
Figure 4.

Many LIP single neurons reflected stimulus category membership when stimuli were presented both inside and outside their RFs. The activity of three LIP neurons (a–c) is shown for all four blocks of trials (with sample and test stimuli presented inside and outside the field). The red and blue traces indicate the three directions in category 1 and category 2, respectively. Each of these neurons showed stronger responses during the sample and/or delay epochs when stimuli were presented inside the RF, but maintained significant category selectivity (and the same category preference) when stimuli were presented outside the field. The three vertical dotted lines on each panel indicate (from left to right) the times of sample onset, sample offset, and test onset. Category index (CI) values for the sample, delay, and test epochs are shown for each neuron for each of the four blocks. ep, Epoch.
The tendency for LIP neurons to show category selectivity for stimuli presented either inside or outside their RFs was also evident across the neuronal population. To analyze these effects across the population, we computed neuronal firing rates in three nonoverlapping time epochs (see Materials and Methods), which corresponded to the sample, delay, and test phases of the task. We evaluated the selectivity for sample-stimulus category and location (i.e., inside or outside the field) by computing a three-way ANOVA (factor 1: stimulus category; factor 2: sample location; factor 3: test location) for each LIP neuron. As shown in Table 2, a substantial fraction of LIP neurons showed a main effect (at p < 0.01) of sample category during the sample (39/84 or 46%), delay (39/84 or 46%), and test (40/84 or 48%), indicating category-selective activity that was consistent across all blocks, regardless of whether the stimuli were inside or outside the RF (23/84 or 27% of LIP neurons had a main effect of category during the sample and delay; 16/84 or 19% were category selective in all three time periods). In addition, a majority of LIP neurons had activity that varied with stimulus location (inside vs outside the RF) during the sample (79/84 or 94%) and delay (59/84 or 70%). During the sample and delay epochs, there was a greater tendency for a main effect of location than for a main effect of category. Interestingly, this pattern reversed during the test epoch, in that fewer neurons showed a main effect of sample location (34/84) than sample category (40/84). In fact, the incidence of main effects of sample location was significantly lower during the test period than sample period (χ2 test, p < 0.001). This suggests a trend toward spatially independent category encoding during the later phases of the task.
Table 2.
Category and spatial selectivity in LIP
| Main effects |
Interactions |
||||||
|---|---|---|---|---|---|---|---|
| Categ | Samp Loc | Test Loc | Cat × S Loc | Cat × T Loc | S Loc × T Loc | Three-way | |
| Sample | 39 | 79 | 17 | 45 | 3 | 17 | 2 |
| Delay | 39 | 59 | 27 | 31 | 2 | 26 | 6 |
| Test | 40 | 34 | 81 | 11 | 23 | 34 | 5 |
Numbers indicate number of neurons with significant effects (three-way ANOVA, p < 0.01; factor 1: category; factor 2: sample location; factor 3: test location). n = 84 neurons. Categ, Category; Samp, sample; Loc, location; S, sample; T, test.
To quantify the strength of neuronal category selectivity, we computed a category-tuning index that measured, for each neuron, the average difference in firing rate between pairs of stimuli in the same category and between those in different categories (see Materials and Methods). Values of the category index could vary from −1.0 to 1.0. Positive values indicate a greater difference between directions in different categories and more similar activity with each category, while negative values indicate the opposite. Index values near zero indicate that neuronal responses between sample directions show a similar degree of discrimination for within- and between-category pairs. For each of the four blocks, we focused our analysis on a population of 66/84 neurons (monkey H: n = 52, monkey S: n = 14) that were selective with respect to the six sample stimulus directions during any of the four blocks or in any time epoch (one-way ANOVA; p < 0.01, uncorrected) (Table 3). While category selectivity was weaker for sample stimuli presented outside the RF, we found significantly positive values of the category index in all four blocks across the LIP population during the sample period (mean index values, block 1: 0.16, block 2: 0.12, block 3: 0.10, block 4: 0.12; greatest p value = 0.005), delay period (block 1: 0.25, block 2: 0.27, block 3: 0.10, block 4: 0.09; greatest p value = 0.004), and test period (block 1: 0.23, block 2: 0.27, block 3: 0.14, block 4: 0.20; greatest p value = 0.00003) according to two-tailed paired t tests comparing the distribution of indices to a mean of zero. The distributions of category-tuning index values for each of the four blocks in the sample, delay, and test epochs are shown in Figure 5. On average, category-index values were reduced by 21% (sample), 64% (delay), and 32% (test) during blocks in which stimuli were presented outside versus inside the RF.
Table 3.
Incidence of sample-direction selectivity in LIP
| In–in (block 1) | In–out (block 2) | Out–in (block 3) | Out–out (block 4) | |
|---|---|---|---|---|
| Sample | 44 | 46 | 13 | 12 |
| Delay | 26 | 34 | 10 | 8 |
| Test | 22 | 25 | 15 | 17 |
Numbers indicate number of neurons with significant effects (one-way ANOVA, six directions, p < 0.01). n = 84 neurons.
Figure 5.

Distributions of category-tuning index values across LIP population. A category-tuning index was computed that measured the strength of category selectivity of individual neurons (see Materials and Methods). Positive values of the index indicate larger activity differences between categories and/or more similar activity within categories. The light gray bars show index values across the entire population of LIP neurons, whereas the dark gray bars show those for neurons that were direction selective (in any block and any time epoch). The sample is shown in a–d, delay in e–h, and test in i–l. In each time epoch, the distribution of indices is shown for each of the four spatial blocks (block 1: sample in RF, test in RF; block 2: sample in, test out; block 3: test out, sample in; block 4: sample out, test out).
We characterized the time course of category selectivity in more detail by computing the category index using a sliding analysis window (window width = 150 ms, step size = 50 ms) across the same population of 66 direction-selective LIP neurons. As shown in Figure 6, category selectivity in all four blocks emerged with a relatively short latency (<200 ms) after sample onset. When sample stimuli were presented in the RF during blocks 1 and 2 (Fig. 6a,b), index values remained high throughout the delay and reached peak values toward the end of the delay and early test epoch. When sample stimuli were presented outside the RF during blocks 3 and 4 (Fig. 6c,d), the strength of category selectivity waned during the early delay, but showed a sharp increase during the late delay and early test epochs.
Figure 6.

Time course of category selectivity across LIP population. The time course of category selectivity was determined for each of blocks 1–4 (a–d) by computing a “sliding” version of the category-tuning index (window width = 150 ms, step size = 50 ms) averaged across the 66/84 neurons that were direction selective during any of the three time epochs (sample, delay, and test) and in any of the four blocks. The gray area around the solid black trace (the mean index value) indicates the SEM. The three vertical dotted lines on each panel indicate (from left to right) the times of sample onset, sample offset, and test onset.
As seen in the single-neuron examples in Figure 4, the latency of category selectivity following sample onset appeared to be somewhat longer than the visual-response latency. Many LIP neurons, such as those in Figure 4, a and b, showed a strong, short-latency visual response that was initially nonselective for the sample directions, followed by strong category selectivity. To evaluate this trend across the population, we computed the time course and latency of both category selectivity and spatial selectivity using an ROC analysis (see Materials and Methods). To do so, we computed two sliding ROC analyses. For category selectivity, we compared firing rates between the two categories during block 1 (sample and test inside the RF). For spatial selectivity, we compared firing rates between block 1 (sample and test stimuli inside the RF) and block 4 (sample and test outside the RF), pooling all trials within each block. A 50-ms-wide analysis window was stepped every 5 ms. The analysis was applied to the population of 53 LIP neurons that were direction selective during block 1. The latency of selectivity for both category and spatial position was defined as the point at which the ROC value exceeded that observed during the fixation period by 5 SDs for at least three consecutive time bins. As shown in Figure 7, spatial selectivity in LIP appeared with a shorter latency (40 ms) than motion-category selectivity (80 ms).
Figure 7.

Time course of spatial selectivity and category selectivity across LIP population. The time courses of spatial selectivity (black trace) and category selectivity (gray trace) are shown for the population of 53 LIP neurons that were determined to be direction selective during block 1. In both cases, selectivity was measured using an ROC analysis. To measure category selectivity, firing rates to the two categories were compared during block 1 (both sample and test stimuli presented in the RF). For spatial selectivity, firing rates were compared between all trials in block 1 (stimuli presented in the RF) and block 4 (stimuli presented outside the RF). The three vertical dotted lines on each panel indicate (from left to right) the times of sample onset, sample offset, and test onset.
In addition to showing category selectivity for stimuli presented both inside and outside LIP neurons' RFs, we also found that neurons tended to maintain consistent category preferences for sample stimuli across blocks 1–4. For this analysis, we focused on neurons in each time epoch (sample: n = 39; delay: n = 39; test: n = 40) that showed a main effect of sample category according to a three-way ANOVA (described above and in Table 2). We found that a greater percentage of neurons than expected by chance (chance = 12.5%) showed the same category preference in each of the blocks 1–4, during the sample (16/39 or 41%), delay (24/39 or 62%), and test (28/40 or 70%) epochs. To evaluate whether neurons tended to show the same category preferences across multiple time epochs, we first determined that 23/84 neurons showed a main effect of sample category during both the sample and delay epochs (according to the three-way ANOVA; see above and Table 2). Of these neurons, the numbers of neurons that showed the same category preferences during both epochs (computed separately in each of the four blocks) were as follows: block 1: 19/23, block 2: 20/23, block 3: 13/23, and block 4: 11/23. Since 50% of neurons would be expected to show the same category preference in the two epochs by chance, this indicates a greater tendency for LIP neurons to maintain consistent category selectivity across multiple time epochs when sample stimuli were presented inside the RF (blocks 1 and 2).
We also found that neurons that showed strong category selectivity when sample stimuli were presented within their RFs also tended to show strong effects when stimuli were presented outside the field. This was particularly evident during the test epoch (Fig. 8), although a weaker but significant trend was also evident during the sample and delay epochs. For each neuron (n = 84), we measured the strength and reliability of sample-category selectivity using an ROC analysis that captured the degree of overlap between the distributions of firing rates obtained when the sample stimulus was in category A versus category B. The results of this analysis indicated the probability (ranging from 0.5 to 1.0) with which an ideal observer could correctly report the sample category on each trial given the firing rates from an individual LIP neuron (Green and Swets, 1966; Tolhurst et al., 1983). When we applied this analysis to the test epoch, we only compared test-epoch selectivity between blocks in which test stimuli were presented in the same location. We did so to eliminate response variability related to the presence or absence of a visual response to the test stimulus, because neurons responded more strongly when the test stimulus was presented in the RF. When the test stimulus was presented inside the RF (Fig. 8a), we found a clear positive relationship between the strength of sample-category selectivity when the sample stimulus had been presented inside (block 2) and outside (block 4) the neurons' RFs (linear regression: slope = 0.77, r2 = 0.38, p = 3 × 10⁻¹⁰). A similar relationship was observed when test stimuli were presented outside the RFs, as shown in Figure 8b (linear regression: slope = 0.57, r2 = 0.22, p = 8 × 10⁻⁶). This analysis was also applied to the LIP population during the sample (linear regression: slope = 0.41, r2 = 0.07, p = 0.015) and delay (linear regression: slope = 0.45, r2 = 0.08, p = 0.011). The consistency of category selectivity for sample stimuli that were presented inside versus outside LIP RFs (particularly during the test) suggests a spatially independent encoding of the sample stimulus (category membership) that was relevant for solving the task. These results also serve as a rigorous control for the unlikely possibility that these category effects were due to differences in spatial attention or planned eye movements (although the monkey's reported their category judgments with a lever release, not an eye movement) between the two categories, since placing stimuli in the opposite quadrant of the display monitor should result in a reversal of such spatial relationships in the DMC task.
Figure 8.

Individual neurons maintained consistent category selectivity across spatial conditions. The strength and reliability of category selectivity was computed with an ROC analysis. During the test epoch (when category selectivity for the previously presented sample stimulus was strongest across the population), ROC values for all neurons (n = 84) were compared between blocks 1 and 3 (when the test stimulus was in the field) (a) and blocks 2 and 4 (when there was no test stimulus in the field) (b). Dashed lines have a slope of 1.
Discussion
We compared the relationship between the neuronal encoding of spatial and task-related, nonspatial information in the lateral intraparietal area. Monkeys were trained to perform a category-matching task in which they grouped motion directions into two categories that were defined by a learned category boundary. As in a previous study, we found that the activity of many individual LIP neurons reflected the learned category membership of the motion directions when those stimuli were presented in the neurons' RFs (Freedman and Assad, 2006). Here, we asked whether this abstract and learning-dependent category encoding was also present when stimuli were presented outside the neurons' RFs. We found that, while firing rates were substantially reduced when stimuli were presented outside the RFs, many neurons still maintained clear category selectivity for the remotely presented stimuli, although that selectivity was weaker than for stimuli presented in the RF. Across the neuronal population, LIP exhibited significant category selectivity with a relatively short latency following stimulus onset, both for stimuli presented inside and outside the RFs. In addition, category selectivity persisted following sample offset, and many LIP neurons showed category selectivity that increased in strength toward the end of the delay (perhaps in anticipation of the upcoming test stimulus) and early test period. This suggests a role for LIP in both rapid visual processing and short-term-memory-related encoding of nonspatial variables (e.g., category membership) that are relevant for solving the task at hand. This idea is also supported by our observation that the prevalence of spatial encoding was greatest during the sample period, but became less prevalent later in the trial, while categorical encoding became more prevalent. Overall our results suggest that nonspatial factors can exert a modulatory influence on LIP activity without a stimulus present in the RF, or if attention or planned action are directed away from the RF.
As in our previous study in LIP using the motion DMC task, neuronal encoding that reflects the learned categories cannot be explained by differences in motor planning among the sample directions during the sample or delay epochs. This is because the monkeys could not make their decision about whether or not to release the lever (which signaled that the test was a category match to the sample) until the presentation of the test stimulus. In addition, since the animal's performance was equally good for both categories, the two learned categories did not substantially differ from one another in their probability of leading to a reward. In our previous study, there was somewhat lower performance for directions very close to (15°) the category boundary that could, in principle, have led to lower reward expectation for those sample directions. However, we did not observe neuronal activity in LIP that tracked such a putative reward-expectation signal (Freedman and Assad, 2006).
These results are complementary to several recent studies that have demonstrated that LIP neurons can encode nonspatial factors, such as visual shape and color (Sereno and Maunsell, 1998; Toth and Assad, 2002; Sereno and Amador, 2006; Janssen et al., 2008), numerical quantity (Nieder and Miller, 2004; Nieder et al., 2006), and the rule that is relevant for solving the currently relevant task (Stoet and Snyder, 2004). However, several of these previous studies did not measure RF location and/or placed stimuli in random locations on the display, while others measured RF properties but then only tested conditions in which stimuli were presented within the RF of each neuron. Thus it was unclear whether LIP neurons conveyed information only about stimuli that were in close proximity to their RFs, or whether they might show a more spatially independent encoding, particularly for more abstract or task-dependent information. It is notable that, while spatial selectivity in LIP neurons is generally present throughout the entire duration of the trial, nonspatial selectivity in both our study and previous studies in dorsal-stream areas (Stoet and Snyder, 2004; Zaksas and Pasternak, 2006) is often present in somewhat shorter time periods that do not always span the entire trial or even an entire task period (e.g., sample or delay).
Our findings may be related to results from Oristaglio et al. (2006), who found that the activity of some LIP neurons is modulated by whether the animal used its right or left hand to report the orientation of a visual target, even when that target was placed outside the RF. In addition, our results are compatible with those from Zaksas and Pasternak (2005), who found that neuronal activity in the middle temporal (MT) area was informative about the direction of motion for stimuli presented outside neurons' RFs during a direction-matching task. However, in contrast with our LIP results presented here, MT direction selectivity in that study was observed almost exclusively during the visual response period. More broadly, our results may also be related to feature-based attention, particularly if the two categories in our study are considered as more abstract features than the concrete visual features typically used in neurophysiological studies of feature-based attention (Treue and Martínez Trujillo, 1999; Maunsell and Treue, 2006).
A better understanding of the origin of nonspatial selectivity in LIP will be essential for determining whether or not parietal cortex plays a direct functional role in nonspatial processing. One possibility is that the nonspatial signals (e.g., category selectivity) that we have observed in LIP are due to “top-down” inputs from brain areas, such as the prefrontal cortex (PFC), that are known to encode abstract nonspatial factors (Freedman et al., 2001, 2002, 2003; Wallis et al., 2001) and are interconnected with parietal cortex (Petrides and Pandya, 1984; Cavada and Goldman-Rakic, 1989; Felleman and Van Essen, 1991). In that case, nonspatial selectivity in LIP may be a “passive reflection” of selectivity in PFC, and may not play a direct role in nonspatial perception and behavior. On the other hand, LIP may be more directly involved in the generation of nonspatial selectivity. This is supported by the observation that LIP category selectivity arises with a relatively short latency, and is encoded strongly by LIP neurons when stimuli are presented within their RFs.
Additional work is needed to understand the origin of outside-the-RF selectivity and how spatial and nonspatial signals are combined by LIP neurons. LIP's encoding of remotely presented stimuli could arise by top-down inputs from PFC, or via interhemispheric connections with LIP neurons with RFs in the location at which stimuli were presented. While our study suggests that LIP neurons can combine spatial and nonspatial information that likely arise from separate inputs, the underlying mechanisms of this process (e.g., additive vs multiplicative combination of spatial and nonspatial signals) remain to be determined, and need to be studied in more detail (perhaps by parametrically varying both spatial and nonspatial factors).
It also remains to be determined whether the outside-the-RF effects that we have observed play a functional role in perception and behavior. The observation that LIP firing rates were much weaker for stimuli presented outside the RF is consistent with the possibility that these weaker firing may have little impact on the perception or actions of the monkey. Even so, an interesting hypothesis is that modulations of LIP activity due to nonspatial factors could, in principle, “interfere” with LIP spatial or saccadic encoding. In addition, since we also found nonspatial modulation for stimuli outside as well as inside the RFs (although it was weaker outside the RF), it follows that this information would have been encoded in a very large population of neurons, i.e., not limited to neurons with RFs in a particular location. This contrasts with spatial encoding in LIP, where stimulus-related information is assumed to be represented by a smaller fraction of neurons whose RFs overlap the spatial location of the stimulus. Thus, the possibility remains that these outside-the-RF effects in LIP may play a functional role in perception and behavior.
Footnotes
This work was supported by National Eye Institute (NEI) Grant EY02106, NEI Vision Core Grant EY12196, a Kirschstein postdoctoral National Research Service Award from NEI (D.J.F.), and a postdoctoral fellowship from the Charles H. Hood Foundation (D.J.F.). For their valuable comments, help, and discussions, we thank Jamie Fitzgerald, Constance Freedman, Todd Herrington, Camillo Padoa-Schioppa, Douglas Ruff, Sruthi Swaminathan, and Daniel Zaksas. We also thank Kimberly Irwin, Tim Lafratta, and John LeBlanc for providing excellent technical assistance.
References
- Bisley JW, Krishna BS, Goldberg ME. A rapid and precise on-response in posterior parietal cortex. J Neurosci. 2004;24:1833–1838. doi: 10.1523/JNEUROSCI.5007-03.2004. [DOI] [PMC free article] [PubMed] [Google Scholar]
- Cavada C, Goldman-Rakic PS. Posterior parietal cortex in rhesus monkey: II. Evidence for segregated corticocortical networks linking sensory and limbic areas with the frontal lobe. J Comp Neurol. 1989;287:422–445. doi: 10.1002/cne.902870403. [DOI] [PubMed] [Google Scholar]
- Critchley M. The parietal lobes. New York: Hafner; 1953. [Google Scholar]
- Felleman DJ, Van Essen DC. Distributed hierarchical processing in the primate cerebral cortex. Cereb Cortex. 1991;1:1–47. doi: 10.1093/cercor/1.1.1-a. [DOI] [PubMed] [Google Scholar]
- Freedman DJ, Assad JA. Experience-dependent representation of visual categories in parietal cortex. Nature. 2006;443:85–88. doi: 10.1038/nature05078. [DOI] [PubMed] [Google Scholar]
- Freedman DJ, Riesenhuber M, Poggio T, Miller EK. Categorical representation of visual stimuli in the primate prefrontal cortex. Science. 2001;291:312–316. doi: 10.1126/science.291.5502.312. [DOI] [PubMed] [Google Scholar]
- Freedman DJ, Riesenhuber M, Poggio T, Miller EK. Visual categorization and the primate prefrontal cortex: neurophysiology and behavior. J Neurophysiol. 2002;88:929–941. doi: 10.1152/jn.2002.88.2.929. [DOI] [PubMed] [Google Scholar]
- Freedman DJ, Riesenhuber M, Poggio T, Miller EK. A comparison of primate prefrontal and inferior temporal cortices during visual categorization. J Neurosci. 2003;23:5235–5246. doi: 10.1523/JNEUROSCI.23-12-05235.2003. [DOI] [PMC free article] [PubMed] [Google Scholar]
- Gnadt JW, Andersen RA. Memory related motor planning activity in posterior parietal cortex of macaque. Exp Brain Res. 1988;70:216–220. doi: 10.1007/BF00271862. [DOI] [PubMed] [Google Scholar]
- Gold JI, Shadlen MN. The neural basis of decision making. Annu Rev Neurosci. 2007;30:535–574. doi: 10.1146/annurev.neuro.29.051605.113038. [DOI] [PubMed] [Google Scholar]
- Green DM, Swets JA. Signal detection theory and psychophysics. New York: Wiley; 1966. [Google Scholar]
- Janssen P, Srivastava S, Ombelet S, Orban GA. Coding of shape and position in macaque lateral intraparietal area. J Neurosci. 2008;28:6679–6690. doi: 10.1523/JNEUROSCI.0499-08.2008. [DOI] [PMC free article] [PubMed] [Google Scholar]
- Judge SJ, Richmond BJ, Chu FC. Implantation of magnetic search coils for measurement of eye position: an improved method. Vision Res. 1980;20:535–538. doi: 10.1016/0042-6989(80)90128-5. [DOI] [PubMed] [Google Scholar]
- Maunsell JHR. Neuronal representations of cognitive state: reward or attention? Trends Cogn Sci. 2004;8:261–265. doi: 10.1016/j.tics.2004.04.003. [DOI] [PubMed] [Google Scholar]
- Maunsell JHR, Treue S. Feature-based attention in visual cortex. Trends Neurosci. 2006;29:317–322. doi: 10.1016/j.tins.2006.04.001. [DOI] [PubMed] [Google Scholar]
- Mountcastle VB, Lynch JC, Georgopoulos A, Sakata H, Acuna C. Posterior parietal association cortex of the monkey: command functions for operations within extrapersonal space. J Neurophysiol. 1975;38:871–908. doi: 10.1152/jn.1975.38.4.871. [DOI] [PubMed] [Google Scholar]
- Nieder A, Miller EK. A parieto-frontal network for visual numerical information in the monkey. Proc Natl Acad Sci U S A. 2004;101:7457–7462. doi: 10.1073/pnas.0402239101. [DOI] [PMC free article] [PubMed] [Google Scholar]
- Nieder A, Diester I, Tudusciuc O. Temporal and spatial enumeration processes in the primate parietal cortex. Science. 2006;313:1431–1435. doi: 10.1126/science.1130308. [DOI] [PubMed] [Google Scholar]
- Oristaglio J, Schneider DM, Balan PF, Gottlieb J. Integration of visuospatial and effector information during symbolically cued limb movements in monkey lateral intraparietal area. J Neurosci. 2006;26:8310–8319. doi: 10.1523/JNEUROSCI.1779-06.2006. [DOI] [PMC free article] [PubMed] [Google Scholar]
- Petrides M, Pandya DN. Projections to the frontal cortex from the posterior parietal region in the rhesus monkey. J Comp Neurol. 1984;228:105–116. doi: 10.1002/cne.902280110. [DOI] [PubMed] [Google Scholar]
- Platt ML, Glimcher PW. Neural correlates of decision variables in parietal cortex. Nature. 1999;400:233–238. doi: 10.1038/22268. [DOI] [PubMed] [Google Scholar]
- Robinson DA. A method of measuring eye movements using a scleral search coil in a magnetic field. IEEE Trans Biomed Eng. 1963;10:137–145. doi: 10.1109/tbmel.1963.4322822. [DOI] [PubMed] [Google Scholar]
- Sereno AB, Amador SC. Attention and memory related responses of neurons in the lateral intraparietal area during shape and spatial delayed match-to-sample tasks. J Neurophysiol. 2006;95:1078–1098. doi: 10.1152/jn.00431.2005. [DOI] [PubMed] [Google Scholar]
- Sereno AB, Maunsell JH. Shape selectivity in primate lateral intraparietal cortex. Nature. 1998;395:500–503. doi: 10.1038/26752. [DOI] [PubMed] [Google Scholar]
- Shadlen MN, Newsome WT. Neural basis of a perceptual decision in the parietal cortex (area LIP) of the rhesus monkey. J Neurophysiol. 2001;86:1916–1936. doi: 10.1152/jn.2001.86.4.1916. [DOI] [PubMed] [Google Scholar]
- Stoet G, Snyder LH. Single neurons in posterior parietal cortex (PPC) of monkeys encode cognitive set. Neuron. 2004;42:1003–1012. doi: 10.1016/j.neuron.2004.06.003. [DOI] [PubMed] [Google Scholar]
- Tolhurst DJ, Movshon JA, Dean AF. The statistical reliability of signals in single neurons in cat and monkey visual cortex. Vision Res. 1983;23:775–785. doi: 10.1016/0042-6989(83)90200-6. [DOI] [PubMed] [Google Scholar]
- Toth LJ, Assad JA. Dynamic coding of behaviorally relevant stimuli in parietal cortex. Nature. 2002;415:165–168. doi: 10.1038/415165a. [DOI] [PubMed] [Google Scholar]
- Treue S, Martínez Trujillo JC. Feature-based attention influences motion processing gain in macaque visual cortex. Nature. 1999;399:575–579. doi: 10.1038/21176. [DOI] [PubMed] [Google Scholar]
- Wallis JD, Anderson KC, Miller EK. Single neurons in prefrontal cortex encode abstract rules. Nature. 2001;411:953–956. doi: 10.1038/35082081. [DOI] [PubMed] [Google Scholar]
- Wardak C, Olivier E, Duhamel JR. Saccadic target selection deficits after lateral intraparietal area inactivation in monkeys. J Neurosci. 2002;22:9877–9884. doi: 10.1523/JNEUROSCI.22-22-09877.2002. [DOI] [PMC free article] [PubMed] [Google Scholar]
- Zaksas D, Pasternak T. Area MT neurons respond to visual motion distant from their receptive fields. J Neurophysiol. 2005;94:4156–4167. doi: 10.1152/jn.00505.2005. [DOI] [PubMed] [Google Scholar]
- Zaksas D, Pasternak T. Directional signals in the prefrontal cortex and in area MT during a working memory for visual motion task. J Neurosci. 2006;26:11726–11742. doi: 10.1523/JNEUROSCI.3420-06.2006. [DOI] [PMC free article] [PubMed] [Google Scholar]