Abstract
Placement of the acetabular cup during total hip arthroplasty is of great importance because usually every deviation from the ideal centre of rotation negatively influences endoprosthesis survival, polyethylene wear and hip load. Here we present hip load change in respect to various acetabular cup positions in female patients who underwent total hip replacement surgery due to hip dysplasia. The calculation suggests that, in the majority of cases, for every millimeter of lateral displacement of the acetabular cup (relative to the ideal centre of rotation) an increase of 0.7% in hip load should be expected and for every millimeter of proximal displacement an increase of 0.1% in hip load should be expected (or decreased if displacement is medial or distal). Also, for every millimeter of neck length increase, 1% decrease is expected and for every millimeter of lateral offset, 0.8% decrease is expected. Altogether, hip load decreases when the cup is placed more medially or distally and when the femoral neck is longer or lateral offset is used.
Résumé
Le positionnement de la cupule acétabulaire durant la réalisation d’une prothèse totale de hanche est très important car une déviation de la position idéale du centre de rotation peut influer de façon négative sur la survie, sur l’usure et sur les vecteurs de forces au niveau de la hanche. Nous présentons une étude qui permet de visualiser les vecteurs de forces en fonction des différentes positions de la cupule chez des patients de sexe féminin qui ont bénéficié d’une prothèse totale de hanche mise en place pour dysplasie. Les calculs permettent de penser que dans la majorité des cas chaque millimètre de latéralisation de la cupule augmente de 0,7% la charge au niveau de la hanche et que chaque déplacement proximal l’augmente de 0,1%. Ainsi chaque augmentation millimétrique de la longueur du col peut entraîner une diminution de 1% des forces, de même en ce qui concerne chaque millimètre d’offset latéral qui permet d’obtenir une diminution de 0,8%. En conclusion, les charges diminuent au niveau de la hanche quand la cupule est placée de façon plus médiane ou distale et quand les longueurs du col fémoral ou de l’offset son utilisées.
Introduction
Preoperative planning for total hip arthroplasty is of paramount importance [7]. It can be a demanding procedure in patients with hip dysplasia [7, 20]. To obtain sufficient acetabular cup coverage during hip arthroplasty in patients with hip dysplasia, we usually put the cup more medially, then more proximally, and eventually, we use superolateral bone grafting [5, 6, 20]. Such an algorithm is proposed based on the clinical results, supportive biomechanical analyses and dysplasia grades [3, 8, 11, 13, 14, 20, 25]. Biomechanical models tend to be complex, and although they are currently in use they have no place in daily practice since their burden in time and costs are considered too heavy [1, 16, 23]. A rather simple method based on plain anteroposterior (AP) X-rays of the pelvis was published recently and using that model as a starting point, we tried to construct a template and mnemonics which could be useful intraoperatively and for preoperative planning of total hip arthroplasty in female patients with secondary arthritis due to hip dysplasia [9]. We also constructed several typical case scenarios which could occur during hip arthroplasty and calculated hip load changes. Differences between hip load in the ideal centre of rotation (COR) and non-ideal postoperative positions of the COR, femoral offset and different femoral neck sizes were calculated. The idea of the template is to give the orthopaedic surgeon clear insight into hip load change regarding various positions of the acetabular cup and various positions of the femur during preoperative planning (with templates and formulas) and intraoperatively (with simple mnemonics).
Materials and methods
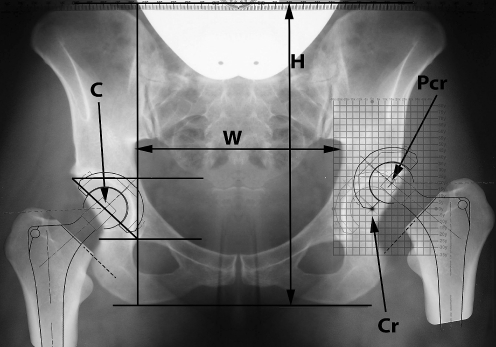
We retrospectively analysed 49 female patients (57 hips), consecutively operated upon between January 2003 and December 2007 for secondary arthritis due to hip dysplasia. Average values are given for all data, followed by ranges and then by mean ± standard deviation in parentheses. All hips were classified according to Crowe et al. [2]. In all patients, on a plain AP X-ray of the pelvis, the total pelvic height (from the top of the iliac crest to the lower end of the ischial tuberosity, Fig. 1) and largest width of the superior pelvic aperture (Fig. 1) were measured. An AP X-ray was selected and loaded into Adobe® Photoshop® graphics software where the X-ray was split vertically in the middle and the normal side was copied over the deformed side in order to have two symmetrical halves. The X-ray was then vertically and horizontally adjusted to represent average height and width of the female pelvis in hip dysplasia, 211 and 146 mm, respectively. Then, using Ranawat’s method, the ideal COR was calculated and this point was marked on the X-ray (point C and point Cr in Fig. 1) [18]. Based on this point as a starting point a grid was constructed with 5-mm steps going in the proximal-distal and mediolateral direction (Fig. 2). For every point of the grid a preoperative plan for implantation of the hip prosthesis was made. The grid point was used as the new COR of the endoprosthesis. For templating we used C2 standard femur, size 3 and size M femoral head (Lima-Lto, Udine, Italy). Every point was named and hip load was calculated, both graphically and mathematically [9]. This load was compared with the hip load measured if the endoprosthesis were to be implanted exactly in the ideal COR and was expressed with the following formula:  . In this way the F value gives the expected increase (or decrease) in percentage of the hip load if the endoprosthesis is not implanted in the ideal COR. We also constructed a series of case scenarios where we simulated lateralisation of the femoral component and different femoral neck sizes. For every scenario the hip load change was calculated. Finally we present three different cases to validate and compare exact hip load changes and values calculated using suggested mnemonics.
Fig. 1.
AP X-ray of the pelvis. W width of the superior pelvic aperture, H total pelvic height, C ideal COR, Cr ideal COR on the left side, Pcr postoperative COR. The right hip endoprosthesis is implanted in the ideal COR. On the left side the template is superimposed and centred with (0x, 0y) grid marker in the ideal COR and the left endoprosthesis is implanted in the postoperative COR (Pcr) which is 15 mm lateral and 20 mm proximal to ideal COR (grid point 15x, 20y)
Fig. 2.
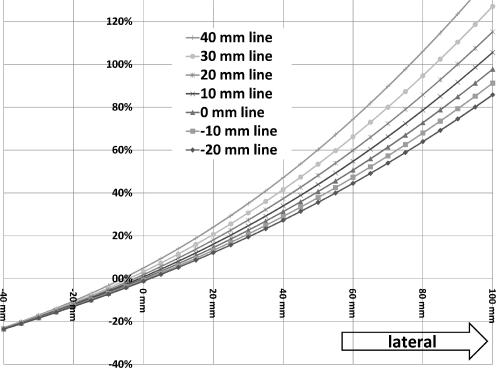
Changes of the hip load in relation to the postoperative position of the COR in the horizontal plane (medial to lateral direction). Every line represents different proximal positions of the COR. For example, the “20-mm line” represents hip load increase when the postoperative COR is moved exactly horizontally from 40 mm medial to 100 mm lateral but at the level which is 20 mm proximal to the ideal COR
Results
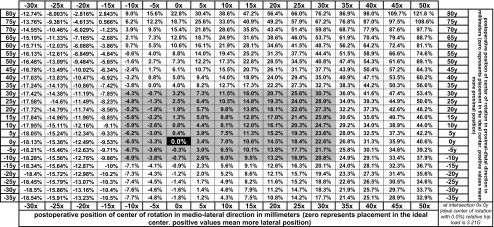
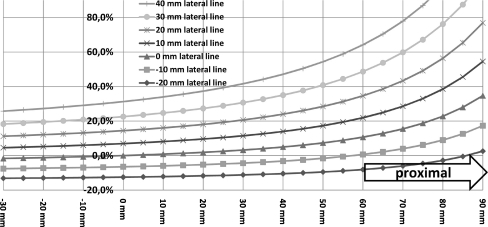
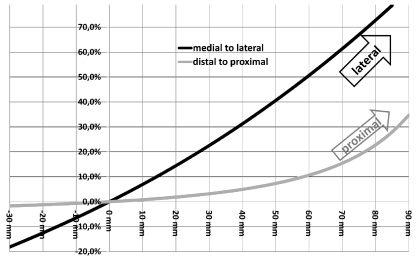
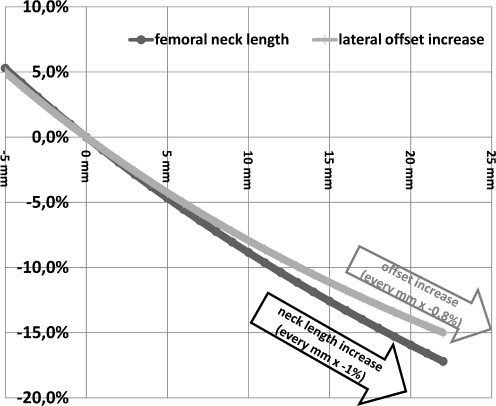
The average age of the patients at the time of surgery was 52 years (range: 24–72), all were female with an average height of 159 cm (range: 149–180; 158 ± 4.9), weight was 65 kg (range :47–88; 65 ± 9) and body mass index was 26.1 kg/m2 (range: 19–36; 26 ± 3.6). According to the classification of Crowe et al. [2] 16 hips were grade 1, 20 hips grade 2, 17 hips grade 3 and four hips grade 4. The average pelvic height was 211 mm (range: 185–237; 210 ± 10) and width was 146 mm (range: 131–165; 142 ± 9). Results with the calculated value F are given in Table 1. Hip load calculated exactly in the ideal COR is 3.21 G. The template includes value F for every grid point and it can be printed as an overhead or integrated into every hospital picture archiving and communication system (PACS) as a help in preoperative planning of total hip arthroplasty in female patients with hip dysplasia. In Fig. 2 changes of the hip load in relation to the postoperative position of the COR in the horizontal plane (medial to lateral direction) are presented and Fig. 3 shows changes of the hip load in correlation to the postoperative position of the COR in the sagittal plane (distal to proximal direction). Figure 4 represents a combined view of the hip load changes in two planes (horizontal and sagittal) in which the postoperative COR is moved exactly at the level of the ideal COR in the horizontal direction (medial or lateral) and in the vertical direction (distal to proximal). Figure 5 shows changes of hip load if the distal attachment of the abductors to the greater trochanter is moved laterally (with lateral femoral offset) and in line with the femoral neck (with different neck sizes). In all tables and figures the orientation was adjusted to simulate calculations of the left hip. Positive values always represent more proximal placement (vertical direction of displacement) or more lateral placement (horizontal direction of displacement). For the right hip Figs. 1, 2, 3, 4 and 5 should be flipped right-to-left.
Table 1.
Hip load change
F values, representing change in hip load relative to the hip load in the ideal COR (0x, 0y intersection in the grid). Hip load in the ideal COR is 3.21 G. For every grid point hip load could be calculated by adding (or subtracting) the calculated percentage to 3.21 G
Fig. 3.
Changes of the hip load in correlation to the postoperative position of the COR in the sagittal plane (distal to proximal direction). Every line represents different lateral positions of the COR. For example, the “10-mm lateral line” represents hip load increase when the postoperative COR is moved exactly vertically from 40 mm distal to 100 mm proximal but at the level which is 10 mm lateral to the ideal COR
Fig. 4.
Combined view of the hip load changes in two planes, medial to lateral and distal to proximal. Both lines pass through the ideal COR (0.0%, 0 mm). The black line represents the increase of the hip load change when the postoperative COR is moved exactly horizontally from 30 mm medial through the ideal COR and then 90 mm laterally. The grey line represents the increase of the hip load change when the postoperative COR is moved exactly vertically from 30 mm distal through the ideal COR and then 90 mm proximally
Fig. 5.
Combined view of hip load changes in relationship with increase of the neck length and increase of the lateral offset of the femoral neck. Both lines pass through the ideal COR (0,0). The grey line represents the decrease of hip load if the offset is increased exactly horizontally in line with the ideal COR. The black line represents the decrease of the hip load change if the femoral neck length is increased (abductor muscle attachment is moved laterally and distally)
Discussion
It is not always possible to implant the endoprosthesis in the ideal COR in patients with secondary hip arthritis due to hip dysplasia. Medialisation or proximalisation of the acetabular cup as well as various techniques for lateral bone graft augmentation can help during total hip replacement [2, 3, 5, 6, 20]. Soft tissue imbalance and leg length discrepancy even require special approaches and techniques [4]. Whether it is better to allow some proximalisation and medialisation to get the full acetabular coverage or whether it is better to place the cup more distally but with a bone graft is not always clearly obvious although it is the subject of much discussion in the literature [8, 11, 13, 14, 25]. There is also a problem of cup inclination because several studies have shown that cup inclination should be 45° or less because inclination greater than that is directly related to accelerated polyethylene wear [21, 24]. The influence of the hip COR, femoral offset and leg length equalisation on the hip load (hip contact stress) is also well documented [8, 9, 14, 25]. Here we present, based on the new mathematical model [9], exact changes of the hip load in total hip arthroplasty in relation to the ideal COR. The results show that displacement of the postoperative COR in the lateral direction increases hip load to a much greater level than displacement in the proximal direction. If, for calculation, the −10 mm to +30 mm zone is selected (square zone starting at 10 mm distal and 10 mm medial and ending at 30 mm lateral and 30 mm proximal; see Table 1), which we believe will represent the majority of the cases (suggested zone includes 55 of 57 of our cases), then the ratio between hip load increase between the lateral direction and proximal direction is 7:1. This means that for approximately every millimeter of lateral displacement an increase of 0.7% in hip load should be expected and for every millimeter of proximal displacement an increase of 0.1% in hip load should be expected (or decreased if displacement is medial or distal). This increase in hip load is relative to the hip load in the ideal COR.
For example in patient 1 where the postoperative COR is 7 mm lateral and 5 mm more proximal than the ideal COR, the exact hip load calculated mathematically and using the template is 3.38 G or 5.3% increase. When calculated using mnemonics: increase = 7 (mm lateral) 0.7 + 5 (mm proximal)0.1 = 5.4%. In patient 2 where the postoperative COR is 17 mm lateral and 25 mm more proximal than the ideal COR, the exact hip load calculated mathematically and using the template is 3.74 G or 16.6% increase. When calculated using mnemonics: increase = 17 (mm lateral) 0.7 + 25 (mm proximal)0.1 = 14.4%. In patient 3 where the postoperative COR is 4 mm medial and 15 mm more proximal than the ideal COR, the exact hip load calculated mathematically and using the template is 3.16 G or 1.5% decrease. When calculated using mnemonics: increase = −4 (mm medial) 0.7 + 15 (mm proximal)0.1 = −1.3%
These results are similar to the data of Heller et al. [11] who, using a different model, found a 1% increase in hip load for 10 mm of proximal displacement and 8% increase in hip load for 10 mm lateral displacement (or 2% increase and 7% increase during stair climbing). The postoperative position is important for endoprosthesis survival as well as for normal gait [3, 7, 14, 15, 19]. Rosler and Perka [19] showed that proximal migration of postoperative COR as well as proximalisation of the femur showed significant influence on gait kinematics after primary hip arthroplasty. Heller et al. [11] in their patient series with 9.3 years follow-up showed that the linear polyethylene wear rate is significantly lower when the acetabular cup is placed more medially and that proximal migration of the cup does not influence the wear rate (0.112 mm3/year for ideal COR group, 0.099 mm3/year for proximal COR group, 0.077 mm3/year for medial COR group). Wan et al. [24] found no correlation between wear rate and postoperative COR, but they found the cup inclination to be the single most significant β coefficient related to wear. For cups with an inclination of 45° or more 0.096 mm/year mean wear was observed and for cups with less than 45° a mean wear rate of 0.084 mm/year was observed (there was no significant difference between the two groups) (metal and ceramic heads on polyethylene liners). The influence of the hip COR on abductor muscle function is well documented by Jerosch et al. [12]. They found that under otherwise unchanged conditions a high hip centre (between 13 mm and 35 mm proximalisation) results in a decrease of muscle length in the abductor muscles and in a great increase of force necessary to keep the balance. This was especially the case for the gluteus minimus muscle and posterior section of the gluteus medius muscle. They also found that when the COR is lateralised (between 5 and 25 mm) the tensor fasciae latae loses its abductor function and physiological working becomes impossible [12]. Schmalzried et al. [22] showed in their study that male gender, height, weight, hip COR (especially horizontal), femoral offset and bearing surface significantly correlated to wear, but the single most important factor was patient activity. Based on the wear and activity data from the 24 hip replacements with standard polyethylene, the average volumetric wear rate per million cycles with a 70 kg patient weight was 30 mm3. In this paper the intention was to analyse the change of the hip load in association with postoperative COR, femoral offset and different femoral neck sizes using a newly developed mathematical model [9]. There is a significant number of biomechanical models already published but they tend to be complex and although they are currently in use, they have no place in daily practice since their burden in time and costs are considered too heavy [1, 3, 8, 11, 13, 14, 16, 19, 21, 23, 24]. A simple approximation for COR positions ranging from −10 mm to +30 mm shown in Table 2 could help orthopaedic surgeons to achieve a good approximation to correctly plan hip replacement procedures and to maximise the life of the endoprosthesis. The downside of this study is that it is a simple mathematical model based on the plain AP X-rays and changes of position of the COR in the AP direction are not taken into account (Heller et al. [11] found less than 3% change in hip load for various changes in AP direction of the COR). It also does not take into account length and strength of the abductor muscles as well as patients’ activity level. Nevertheless, since even this simplified model closely reproduces results which are attainable by more complex studies, we propose simple mnemonics for everyday use (Table 2).
Table 2.
Mnemonics
| 1 mm ↑ lateral displacement = 0.7% ↑ hip load |
| 1 mm ↑ proximal displacement = 0.1% ↑ hip load |
| 1 mm ↑ lateral offset = 0.8% ↓ hip load |
| 1 mm ↑ neck length = 1% ↓ hip load |
Mnemonics which could be used for the majority of cases. This approximation is calculated for values between −10 mm and +30 mm in the mediolateral and proximal-distal direction
Conclusion
For female patients with secondary osteoarthritis due to hip dysplasia we suggest that the technique for optimal cup placement should include acetabular placement as far medially as possible which is then followed by more proximal placement. If this is not possible, lateral placement of the COR should be avoided by using techniques such as cotyloplasty, use of small acetabular cup and augmentation with bone grafting [6, 10, 17, 20, 25]. This is necessary to prevent the increase in hip load and to allow a good biomechanical environment for longer hip arthroplasty survival.
References
- 1.Brinckmann P, Frobin W, Hierholzer E. Stress on the articular surface of the hip joint in healthy adults and persons with idiopathic osteoarthrosis of the hip joint. J Biomech. 1981;14:149–156. doi: 10.1016/0021-9290(81)90021-X. [DOI] [PubMed] [Google Scholar]
- 2.Crowe JF, Mani VJ, Ranawat CS. Total hip replacement in congenital dislocation and dysplasia of the hip. J Bone Joint Surg Am. 1979;61:15–23. [PubMed] [Google Scholar]
- 3.Dearborn JT, Harris WH. High placement of an acetabular component inserted without cement in a revision total hip arthroplasty. Results after a mean of ten years. J Bone Joint Surg Am. 1999;81:469–480. doi: 10.2106/00004623-199904000-00004. [DOI] [PubMed] [Google Scholar]
- 4.Delimar D, Bicanic G, Korzinek K. Femoral shortening during hip arthroplasty through a modified lateral approach. Clin Orthop Relat Res. 2008;466:1954–1958. doi: 10.1007/s11999-008-0292-6. [DOI] [PMC free article] [PubMed] [Google Scholar]
- 5.Delimar D, Bicanic G, Pecina M, Korzinek K. Acetabular roof reconstruction with pedicled iliac graft: early clinical experience. Int Orthop. 2004;28:319–320. doi: 10.1007/s00264-004-0555-0. [DOI] [PMC free article] [PubMed] [Google Scholar]
- 6.Delimar D, Cicak N, Klobucar H, Pecina M, Korzinek K. Acetabular roof reconstruction with pedicled iliac graft. Int Orthop. 2002;26:344–348. doi: 10.1007/s00264-002-0381-1. [DOI] [PMC free article] [PubMed] [Google Scholar]
- 7.Della Valle AG, Padgett DE, Salvati EA. Preoperative planning for primary total hip arthroplasty. J Am Acad Orthop Surg. 2005;13:455–462. doi: 10.5435/00124635-200511000-00005. [DOI] [PubMed] [Google Scholar]
- 8.Doehring TC, Rubash HE, Shelley FJ, Schwendeman LJ, Donaldson TK, Navalgund YA. Effect of superior and superolateral relocations of the hip center on hip joint forces. An experimental and analytical analysis. J Arthroplasty. 1996;11:693–703. doi: 10.1016/S0883-5403(96)80008-8. [DOI] [PubMed] [Google Scholar]
- 9.Erceg M (2008) The influence of femoral head shift on hip biomechanics: additional parameters accounted. Int Orthop. doi:10.1007/s00264-008-0544-9 [DOI] [PMC free article] [PubMed]
- 10.Hartofilakidis G, Stamos K, Karachalios T. Treatment of high dislocation of the hip in adults with total hip arthroplasty. Operative technique and long-term clinical results. J Bone Joint Surg Am. 1998;80:510–517. doi: 10.2106/00004623-199804000-00007. [DOI] [PubMed] [Google Scholar]
- 11.Heller MO, Schröder JH, Matziolis G, Sharenkov A, Taylor WR, Perka C, Duda GN. Musculoskeletal load analysis. A biomechanical explanation for clinical results–and more? (in German) Orthopade. 2007;36:188, 190–194. doi: 10.1007/s00132-007-1054-y. [DOI] [PubMed] [Google Scholar]
- 12.Jerosch J, Steinbeck J, Stechmann J, Guth V. Influence of a high hip center on abductor muscle function. Arch Orthop Trauma Surg. 1997;116:385–389. doi: 10.1007/BF00433996. [DOI] [PubMed] [Google Scholar]
- 13.Johnston RC, Brand RA, Crowninshield RD. Reconstruction of the hip. A mathematical approach to determine optimum geometric relationships. J Bone Joint Surg Am. 1979;61:639–652. [PubMed] [Google Scholar]
- 14.Lengsfeld M, Bassaly A, Boudriot U, Pressel T, Griss P. Size and direction of hip joint forces associated with various positions of the acetabulum. J Arthroplasty. 2000;15:314–320. doi: 10.1016/S0883-5403(00)90624-7. [DOI] [PubMed] [Google Scholar]
- 15.Müller ME. Lessons of 30 years of total hip arthroplasty. Clin Orthop Relat Res. 1992;274:12–21. [PubMed] [Google Scholar]
- 16.Noble PC, Sugano N, Johnston JD, Thompson MT, Conditts MA, Engh CA, Sr, Mathis KB. Computer simulation: how can it help the surgeon optimize implant position? Clin Orthop Relat Res. 2003;417:242–252. doi: 10.1097/01.blo.0000096829.67494.dc. [DOI] [PubMed] [Google Scholar]
- 17.Papachristou G, Hatzigrigoris P, Panousis K, Plessas S, Sourlas J, Levidiotis C, Chronopoulos E. Total hip arthroplasty for developmental hip dysplasia. Int Orthop. 2006;30:21–25. doi: 10.1007/s00264-005-0027-1. [DOI] [PMC free article] [PubMed] [Google Scholar]
- 18.Ranawat CS, Dorr LD, Inglis AE. Total hip arthroplasty in protrusio acetabuli of rheumatoid arthritis. J Bone Joint Surg Am. 1980;62:1059–1065. [PubMed] [Google Scholar]
- 19.Rosler J, Perka C. The effect of anatomical positional relationships on kinetic parameters after total hip replacement. Int Orthop. 2000;24:23–27. doi: 10.1007/s002640050006. [DOI] [PMC free article] [PubMed] [Google Scholar]
- 20.Sanchez-Sotelo J, Berry DJ, Trousdale RT, Cabanela ME. Surgical treatment of developmental dysplasia of the hip in adults: II. Arthroplasty options. J Am Acad Orthop Surg. 2002;10:334–344. doi: 10.5435/00124635-200209000-00005. [DOI] [PubMed] [Google Scholar]
- 21.Schmalzried TP, Guttmann D, Grecula M, Amstutz HC. The relationship between the design, position, and articular wear of acetabular components inserted without cement and the development of pelvic osteolysis. J Bone Joint Surg Am. 1994;76:677–688. doi: 10.2106/00004623-199405000-00008. [DOI] [PubMed] [Google Scholar]
- 22.Schmalzried TP, Shepherd EF, Dorey FJ, Jackson WO, dela Rosa M, Fa’vae F, McKellop HA, McClung CD, Martell J, Moreland JR, Amstutz HC. The John Charnley Award. Wear is a function of use, not time. Clin Orthop Relat Res. 2000;381:36–46. doi: 10.1097/00003086-200012000-00005. [DOI] [PubMed] [Google Scholar]
- 23.The B, Hosman A, Kootstra J, Kralj-Iglic V, Flivik G, Verdonschot N, Diercks R. Association between contact hip stress and RSA-measured wear rates in total hip arthroplasties of 31 patients. J Biomech. 2008;41:100–105. doi: 10.1016/j.jbiomech.2007.07.010. [DOI] [PubMed] [Google Scholar]
- 24.Wan Z, Boutary M, Dorr LD. The influence of acetabular component position on wear in total hip arthroplasty. J Arthroplasty. 2008;23:51–56. doi: 10.1016/j.arth.2007.06.008. [DOI] [PubMed] [Google Scholar]
- 25.Zupanc O, Antolic V, Iglic A, Jaklic A, Kralj-Iglic V, Stare J, Vengust R. The assessment of contact stress in the hip joint after operative treatment for severe slipped capital femoral epiphysis. Int Orthop. 2001;25:9–12. doi: 10.1007/s002640000213. [DOI] [PMC free article] [PubMed] [Google Scholar]


