Abstract
We analysed the functional adaptation of the first and second metatarsal bones to altered strain in flexible flatfoot. Fifty consecutive women (20–40 years of age) were enrolled: 31 patients with a flexible flatfoot and metatarsalgia (59 feet) and 19 controls with asymptomatic feet (37 feet). They were compared for cortical thickness (medial, lateral, dorsal and plantar) of the two bones. The null hypothesis of no overall difference between the deformed and healthy feet with regard to cortical thicknesses of the two bones was rejected in a multivariate test (p = 0.046). The groups differed significantly only regarding dorsal cortical thickness of the second metatarsal, which was around 18.1% greater in the deformed feet (95% confidence interval: 7.7–28.4%, p < 0.001). Hypertrophy of the dorsal corticalis of the second metatarsal bone appears to be the main metatarsal adaptive reaction to altered strain in the flexible flatfoot.
Résumé
L’auteur analyse l’adaptation fonctionnelle des premiers et deuxième métatarsien dans le pied plat souple. 50 patientes consécutives âgées de 20 à 40 ans ont été étudiées, 31 patientes avec des pieds souples et des métatarsiens douloureux (59 pieds) et 19 contrôles avec pied asymptomatiques (37 pieds). Ont été comparés l’épaisseur corticale de deux métatarsiens dont le deuxième. L’hypothèse d’une influence négative de la déformation sur l’épaisseur corticale des deux métatarsiens peut être rejetée d’après étude statistique (p = 0,046). Les deux groupes diffèrent de façon significative en ce qui concerne l’épaisseur corticale dorsale du deuxième métatarsien. Celle-ci est 18,1% plus déformée, l’hypertrophie de cette corticale dorsale de ce deuxième métatarsien est apparue comme une réaction à l’adaptation principale de ces pieds plats souples décompensés.
Introduction
The human foot is a complex structurer. Due to the ability of functional adaptation it has undergone a number of evolutionary changes specific for the human race [4, 8]. Mechanisms of functional adaptation are also important for understanding the ability of preservation of its twin functions, both static and a dynamic, under conditions of altered strain as well as for understanding the background of specific pathological changes and related clinical manifestations. Bone strains have both a static and a dynamic component (body weight in function and simultaneous multiple activity of muscles and connective tissues) that generate forces of pressure, tension and shear resulting in the internal stress forces. In order to resist such forces and avoid stress fractures, long bones, including the metatarsal bones, need to increase their mass and strength [1, 3, 5, 6, 9–11, 14, 15, 18, 20–22].
Flexible flatfoot (pes planovalgus) is a common static foot deformity. It can be due to different causes and is commonly accompanied by metatarsalgia or hallux valgus deformity, especially in adults [6, 13]. Due to the fallen arch, the inclination of the metatarsal bones, particularly the first and second metatarsal bones that partly form the arch, is reduced and the interrelationship of forces acting on the forefoot is changed. In this study we aimed to analyse the functional adaptation of the first and second metatarsal bones to altered strains in flexible flatfoot by comparing affected feet with metatarsalgia and statically sufficient asymptomatic feet.
Patients and methods
A total of 50 subjects were enrolled in this cross-sectional study: 31 newly diagnosed consecutive patients with a flexible flatfoot and metatarsalgia (total number of feet = 59) and 19 subjects with statically sufficient asymptomatic feet (total number of feet = 37). Common inclusion criteria were informed consent, female sex and age 20–40 years. Common exclusion criteria were verified or suspected pregnancy, symptomatic hallux valgus (or hallux valgus angle ≥ 20° combined with the first intermetatarsal angle ≥ 10° irrespective of clinical difficulties), any other forefoot pathology and osteoporosis (based on medical history or suspected in subjects with premature menopause). Presence/absence of fallen arches and metatarsalgia were assessed based on medical history, clinical examination, pedobarographic analysis and radiological findings. Patients (i.e. deformed feet) were included over a predefined one year period. Based on standard deviations and pair-wise correlation coefficients determined for the eight indices considered of primary interest in respect to bone adaptation (see below) in the deformed feet, a variance-covariance matrix was constructed that was used to calculate the sample of control feet needed to be included in a multivariate analysis of variance. In a design with one two-level factor (deformed/healthy feet) and eight outcome variables and assuming that the means between the two groups for at least one outcome variable would differ by at least 15%, a total of 96 feet was calculated to be required for a power of 80% in an exact F-test at a two-sided 5% significance level. Hence, 37 control (healthy) feet needed to be analysed. Subjects with statically sufficient asymptomatic feet were recruited among patients referred to our outpatient department for reasons other than static deformity and metatarsalgia.
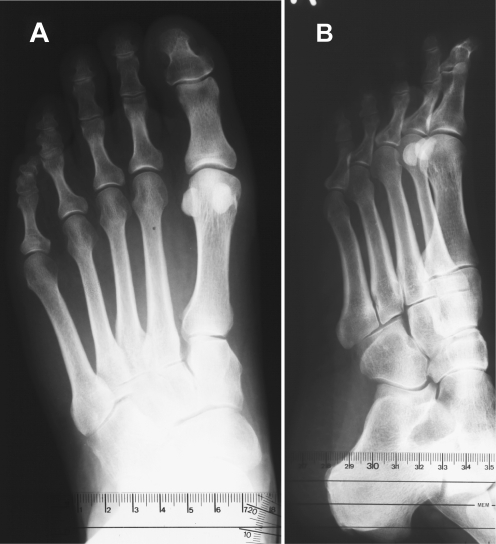
All feet underwent standardised radiological evaluation [16, 22]. Bifocal X-ray images were taken in the anteroposterior (AP) and laterolateral (profile, LL) projections under weight-bearing (subjects standing on the film). Two radiographs were taken in the AP projection—one of the forefoot and one of the hindfoot, both with the X-rays directed at an angle of 15° relative to the vertical line (Fig. 1a). Profile images were taken in a semi-diagonal position (Fig. 1b).
Fig. 1.
X-ray images in the anteroposterior projection under weight-bearing (subjects standing on the film) (a) and in laterolateral (profile) projection (b)
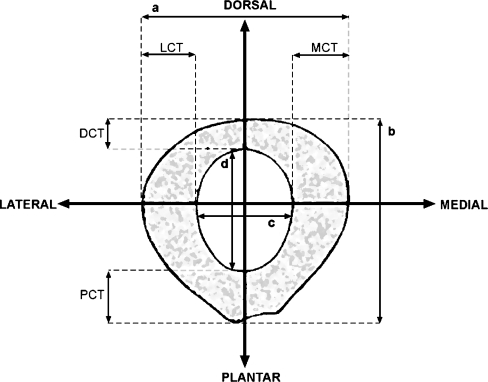
The length of the first and second metatarsal bones and metatarsal index as a measure of relative metatarsal protrusion were determined on AP radiographs by the method of arcs as described by Hardy and Clapham [7]. Hallux valgus angle and the first intermetatarsal angle were determined as described Miller [12] and Schneider et al. [19]. Intramedullary thickness (IMT) and entire shaft thickness (EST) on the AP radiographs as well as medial and lateral cortical thickness (CT) of the second metatarsal were determined at midpoint as described by Prieskorn et al. [17]. As suggested by Prieskorn et al. [17], cortical thickness was standardised per intramedullary thickness (CT/IMT) and per entire shaft thickness (CT/EST) to account for differences in foot size. The same was done for the first metatarsal. The same methodology was applied also on profile radiographs to obtain standardised values of the dorsal and plantar cortical thickness of the two bones. Figure 2 schematically represents the measured parameters. All measurements were performed by the same investigator. Eight primary outcome variables were defined, i.e. four standardised cortical thicknesses (medial, lateral, dorsal and plantar) for each of the two bones. Standardisation per intermedullary thickness (CT/IMT) was considered of primary interest, whereas CT/EST standardisation was used for sensitivity analysis.
Fig. 2.
Schematic representation of measurements performed for the first and second metatarsal bones. a entire shaft thickness on anteroposterior radiographs, b entire shaft thickness on profile (laterolateral) radiographs, c intramedullary thickness on anteroposterior radiographs, d intramedullary thickness on profile radiographs, LCT lateral cortical thickness, MCT medial cortical thickness, DCT dorsal cortical thickness, PCT plantar cortical thickness
Univariate comparison between the two groups was based on parametric or non-parametric (depending on distribution properties) unpaired two-sample tests. For the main analysis, eight standardised cortical thicknesses (CT/IMT) were analysed in a multivariate analysis of covariance to test the null hypothesis of no overall difference between the deformed and control feet. The same was repeated using cortical thicknesses standardised per entire shaft thickness (CT/EST). Both models met the assumptions of normality of residuals and homogeneity of variances (Box’s M, Levene’s test). We used SAS 9.1 (SAS Inc., Cary, NC, USA) software. The local Ethics Committee approved the study.
Results
Deformed and control feet were comparable regarding the length of the first metatarsal bone [median (quartiles) 64 mm (62–66) vs 62 mm (60–66), p = 0.138], length of the second metatarsal bone [75 mm (72–77.5) vs 73 mm (70–78), p = 0.260] and metatarsal index (mean ± SD −1.43 ± 2.76 vs −1.01 ± 3.07, p = 0.488). The hallux valgus angle was somewhat greater in the deformed feet [median (quartiles) 12° (10–14) vs 10° (10–12), p = 0.016]. The first intermetatarsal angle ranged between 2 and 7° in both groups.
Univariate comparison of morphometric characteristics of the first and second metatarsal bones indicated a greater thickness of the dorsal corticalis of the second metatarsal in deformed feet, as evidenced by absolute values as well as by values standardised per intramedullary or entire shaft thickness in LL projection (all p < 0.001) (Table 1). Figure 3 shows a profile X-ray image of an affected foot with a thick (hypertrophic) dorsal cortex of the second metatarsal bone. The medial cortex of the second metatarsal and plantar cortex of the first metatarsal (standardised values) were somewhat thicker in deformed vs control feet, with borderline significance (Table 1). In the multivariate analysis, with adjustment for hallux valgus angle and metatarsal index, the null hypothesis of no overall difference between deformed and control feet regarding cortical thickness (medial, lateral, dorsal and plantar) of the first and second metatarsal bones was rejected, regardless of whether cortical thickness was standardised per intramedullary thickness (p = 0.046) or per entire shaft thickness (p = 0.031) (Table 2). None of the covariates had a significant impact on the outcomes (Table 2).
Table 1.
Univariate comparison of the first and second metatarsal bone morphometric characteristics between deformed (n = 59) and control feet (n = 37)
| First metatarsal bone | Second metatarsal bone | |||||
|---|---|---|---|---|---|---|
| Outcomes in AP projection | Deformed feet | Control feet | p value | Deformed feet | Control feet | p value |
| Intramedullary thickness (mm) | 12.41 ± 1.29 | 12.31 ± 1.20 | 0.698 | 8.05 ± 0.91 | 8.00 ± 0.86 | 0.795 |
| Entire shaft thickness (mm) | 15.88 ± 1.64 | 15.63 ± 1.26 | 0.422 | 12.74 ± 1.39 | 12.46 ± 1.44 | 0.335 |
| Medial cortical thickness (mm) | 1.50 ± 0.33 | 1.45 ± 0.34 | 0.441 | 2.60 ± 0.57 | 2.39 ± 0.53 | 0.555 |
| Lateral cortical thickness (mm) | 1.97 ± 0.37 | 1.87 ± 0.43 | 0.242 | 2.09 ± 0.48 | 2.06 ± 0.54 | 0.500 |
| Medial CT/IMT (× 100) | 12.10 ± 2.35 | 11.92 ± 3.16 | 0.744 | 32.51 ± 6.83 | 29.93 ± 6.06 | 0.063 |
| Medial CT/EST (× 100) | 9.41 ± 1.63 | 9.28 ± 2.11 | 0.729 | 20.37 ± 3.58 | 19.10 ± 3.10 | 0.077 |
| Lateral CT/IMT (× 100) | 15.94 ± 3.00 | 15.40 ± 4.11 | 0.464 | 26.08 ± 5.71 | 25.85 ± 6.31 | 0.857 |
| Lateral CT/EST (× 100) | 12.39 ± 2.00 | 11.99 ± 2.68 | 0.396 | 16.36 ± 3.04 | 16.46 ± 3.26 | 0.883 |
| Outcomes in LL projection | ||||||
| Intramedullary thickness (mm) | 13.01 ± 1.34 | 13.08 ± 1.31 | 0.821 | 7.73 ± 0.97 | 7.47 ± 0.98 | 0.201 |
| Entire shaft thickness (mm) | 16.5 (15.4–17.3) | 16.3 (15.3–17.1) | 0.472 | 11.50 (10.50–12.40) | 11.20 (9.75–11.80) | 0.028 |
| Dorsal cortical thickness (mm) | 1.60 (1.30–1.90) | 1.50 (1.20–1.60) | 0.093 | 2.00 (1.90–2.50) | 1.60 (1.40–1.90) | <0.001 |
| Plantar cortical thickness (mm) | 1.60 (1.40–1.90) | 1.60 (1.25–1.70) | 0.056 | 1.70 (1.60–2.00) | 1.60 (1.30–1.90) | 0.051 |
| Dorsal CT/IMT (× 100) | 11.59 (10.24–13.79) | 11.71 (8.88–12.98) | 0.115 | 27.00 (24.00–30.16) | 22.73 (19.87–26.77) | <0.001 |
| Dorsal CT/EST (× 100) | 9.38 (8.22–10.81) | 8.72 (7.52–10.10) | 0.172 | 18.00 (16.00–20.00) | 15.45 (13.68–17.99) | <0.001 |
| Plantar CT/IMT (× 100) | 12.80 (10.71–15.04) | 11.69 (9.52–13.91) | 0.070 | 22.72 (19.28–26.15) | 20.78 (17.91–25.00) | 0.224 |
| Plantar CT/EST | 10.20 (8.93–11.80) | 9.73 (8.05–10.98) | 0.096 | 15.24 (13.22–17.39) | 14.52 (12.72–16.66) | 0.463 |
Intramedullary thickness (IMT), entire shaft thickness (EST) and cortical thickness (CT), determined at midpoint on anteroposterior (AP) and laterolateral (LL) X-ray images and indices calculated thereof are shown as mean ± SD or median (quartiles).
Fig. 3.
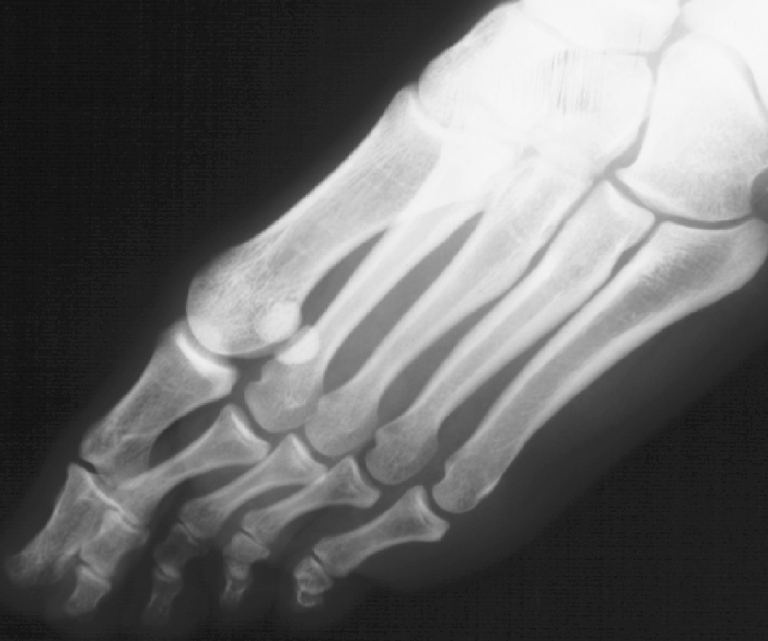
Profile X-ray image of a symptomatic (metatarsalgia) flexible flatfoot with a thick (hypertrophic) dorsal corticalis of the second metatarsal bone
Table 2.
Multivariate adjusted (for hallux valgus angle and metatarsal index) comparison between deformed and control feet regarding cortical thickness (medial, lateral, dorsal and plantar) of the first and second metatarsal bones
| Model 1 | Model 2 | |||
|---|---|---|---|---|
| Effect | Roy’s greatest root | p value | Roy’s greatest root | p value |
| Status (deformed or control) | 0.196 | 0.046 | 0.213 | 0.031 |
| Hallux valgus angle (°) | 0.063 | 0.717 | 0.068 | 0.640 |
| Metatarsal index | 0.136 | 0.189 | 0.130 | 0.217 |
Cortical thickness is standardised either per intramedullary thickness (model 1) or per entire shaft thickness (model 2). Null hypothesis = no overall difference
Table 3 summarises adjusted (least-square) mean differences between deformed and control feet regarding cortical thickness (standardised per intramedullary thickness) of the first and second metatarsal bones. Only dorsal cortical thickness of the second metatarsal was statistically significantly greater in deformed vs control feet—by around 18.1% (p < 0.001) (Table 3). All other differences were ≤ 8.5% (Table 3). An identical relationship between deformed and control feet was seen when cortical thickness standardised per entire shaft thickness was considered.
Table 3.
Adjusted (least-square) mean differences (Δ) of cortical thickness (standardised per intramedullary thickness) of the first and second metatarsal bones between deformed and control feet from multivariate analysis of covariance depicted in Table 2
| Outcome | Absolute Δ (95% CI) deformed-control | Relative Δ (95% CI) deformed-control | p value |
|---|---|---|---|
| First metatarsal bone | |||
| Medial cortical thickness | 0.32 (-0.85 to 1.49) | 2.7% (-7.2 to 12.6) | 0.585 |
| Lateral cortical thickness | 0.64 (-0.88 to 2.16) | 4.2% (-5.7 to 14.1) | 0.403 |
| Dorsal cortical thickness | 0.87 (-0.50 to 2.25) | 7.8% (-4.5 to 20.2) | 0.212 |
| Plantar cortical thickness | 1.02 (-0.18 to 2.22) | 8.5% (-1.5 to 18.6) | 0.095 |
| Second metatarsal bone | |||
| Medial cortical thickness | 2.23 (-0.62 to 5.09) | 7.4% (-2.1 to 16.7) | 0.124 |
| Lateral cortical thickness | 0.29 (-2.31 to 2.88) | 1.1% (-8.9 to 11.1) | 0.826 |
| Dorsal cortical thickness | 4.16 (1.77 to 6.54) | 18.1% (7.7 to 28.4) | < 0.001 |
| Plantar cortical thickness | 1.06 (-1.27 to 3.39) | 4.8% (-5.7 to 15.2) | 0.369 |
Differences are given in absolute and relative (percentages) amounts with 95% confidence intervals (CI) and respective p values
In a receiver-operating characteristic analysis (ROC), dorsal cortical thickness of the second metatarsal (standardised per intramedullary thickness) was found to be fairly discriminative for metatarsalgia (area under the ROC curve 0.72, 95% confidence interval: 0.61–0.83), with a positive predictive value of 80% and a negative predictive value of 55% at the cut-off with the highest sum of sensitivity (0.61) and specificity (0.76). Similar results were observed with cortical thickness standardised per entire shaft thickness.
Discussion
Flexible flatfoot is a common static deformity of the foot characterised by a diminished or absent height of the longitudinal arch [6]. The arch stability is ascertained by static and dynamic protective mechanisms. Static stability depends on the inward forces acting along the anteroposterior axis that are generated by the action of the plantar fascia (tension). Additional support comes from the plantar ligaments extending between each of the arch elements providing semi-rigid properties. In motion, dynamic protective mechanisms enabling the arch integrity involve also contraction of the small muscles of the forefoot that additionally increase the tension of the fascia and help preserve the inclination angle of the metatarsal bones [3, 6, 8, 9, 18]. Disruption of the protective mechanisms (which could be due to a number of reasons) results in a fallen arch and changed relationships among forces acting on the passive elements of the arch (first and second metatarsal bones). The results suggest that the second metatarsal bone sustains the greatest load under these changed conditions and that hypertrophy of the dorsal cortex of the second metatarsal is the main adaptive mechanism of the metatarsal bones to altered weight-bearing in the flexible flatfoot. The results also suggest that determining cortical thickness of the second metatarsal might be of practical relevance—taken together with clinical status, it could help in timely introduction of measures for the forefoot load relief in asymptomatic feet in order to prevent metatarsalgia.
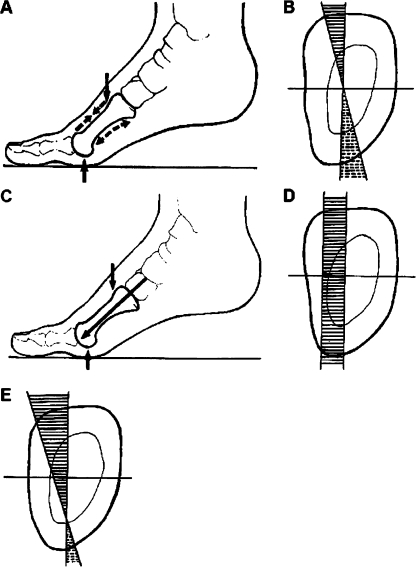
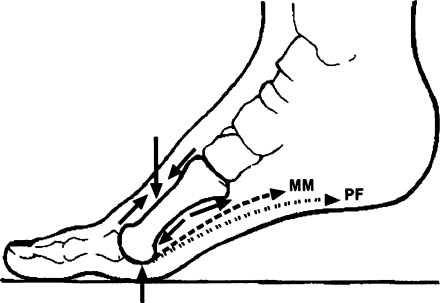
For the purpose of explaining these observations, metatarsal bones could be compared to a hollow stick fastened at two edges. When a force acts on the longitudinal axis of such a structure, compression forces occur on its upper surface and stretching forces occur on its lower surface (Fig. 4). The effect of the force largely depends on the acting angle [9]. In fallen arches, the inclination angle of the metatarsal bones is reduced. Consequently, the vector of the pressure force is almost orthogonal on the longitudinal axis and the lever exposed to the acting force is longer. As a result, compression forces (dorsal surface) and stretching forces (plantar surface) are larger. At the same time, the function of the plantar fascia and small muscles that tend to counteract them (tension) is reduced. Disrupted function of the plantar fascia has been identified as a main factor compromising the integrity of the second metatarsal bone [2]. The prevailing compression forces induce a bone reaction resulting in intensified remodelling and reinforced bone that can resist it. Figure 5 schematically represents the relationship between compression and tension forces acting on the bone.
Fig. 4.
Schematic representation of pressure and tension forces acting on the metatarsal diaphysis. The upper panel illustrates a balance between pressure and tension. aDashed arrows represent the direction of the pressure forces along the dorsal surface and direction of the tension forces along the plantar surface. b Pressure and tension in a coordinate system originating from the diaphysis centre (axial cross section)—forces are the greatest on the bone surfaces and decay towards the origin (mutual neutralisation) where the force is zero. The middle panel illustrates isolated pressure forces. c Direction along the metatarsal axis. d In a coordinate system—when there is no counteracting tension—pressure is not neutralised throughout the diaphysis. The lower panel (e) illustrates an imbalance between pressure and tension—the “zero force” point is displaced towards the plantar surface, tension forces on the plantar surface are weaker than in a balanced state, whereas pressure forces on the dorsal surface are greater than in a balanced state
Fig. 5.
Schematic representation of overall pressure and tension [generated by muscles (MM) and plantar fascia (PF)] forces acting on the second metatarsal bone
In line with the findings of Grebing et al. [5] and as opposed to Morton [13], we found no association between the flexible flatfoot and the medial cortical thickness of the second metatarsal bone. In the univariate comparison, it was slightly greater in deformed than in the control feet with a borderline significance, but it was clearly not significantly different in the adjusted multivariate analysis (mean difference of around 7%). Of note, our study was powered (80%) to observe a 15% difference in a multivariate test, which resulted in a sample size providing almost 100% power to detect such a difference in an independent two-sample test assuming either normal or some “non-normal” distribution of the data (e.g. uniform or double exponential). Therefore, the observed lack of significant difference is likely to represent a true (population) lack of a relevant difference in the thickness of the medial corticalis of the second metatarsal between normal feet and a flexible flatfoot. The same is applicable for plantar cortical thicknesses of the first and second bones, which were slightly greater in the deformed than in control feet, probably reflecting the action of the ground forces [2], but the differences were small (adjusted differences around 8.5 and around 4.8%, respectively) and only borderline significant (univariate tests) or non-significant.
In conclusion, the findings from this study suggest that the dorsal surface of the second metatarsal bone sustains the main load of altered strains in the flexible flatfoot. The general application of this observation is limited by the fact that the study included only younger women. This was due to the fact that in adults, flexible flatfoot is most common in younger women, and in this population subgroup it is unlikely to be “complicated” by osteoporosis or other (fore)foot pathology. On the other hand, we believe that through the applied methodology (e.g. consecutive subjects, standard and well-established measures and measurement methods) we ascertained a fair level of internal validity of the study resulting in reasonably valid and accurate estimates.
References
- 1.Aboud RJ, Rowley D. Foot pressure measurement. In: Helal B, Rowly DI, Crachiolo A III, Myerson MS, editors. Surgery of disorders of the foot and ankle. London: Lippincott-Raven; 1996. pp. 123–138. [Google Scholar]
- 2.Donahue SW, Sharkey NA. Strains in the metatarsals during the stance phase of gait: implications for stress fractures. J Bone Joint Surg Am. 1999;81:1236–1244. doi: 10.2106/00004623-199909000-00005. [DOI] [PubMed] [Google Scholar]
- 3.Erdemir A, Hamel AJ, Fauth AR, Piazza SJ, Sharkey NA. Dynamic loading of the plantar aponeurosis in walking. J Bone Joint Surg Am. 2004;86(3):546–552. doi: 10.2106/00004623-200403000-00013. [DOI] [PubMed] [Google Scholar]
- 4.Frost HM. Skeletal structural adaptations to mechanical usage (SATMU): 2. Redefining Wolff’’s law: the remodeling problem. Anat Rec. 1990;226:414–422. doi: 10.1002/ar.1092260403. [DOI] [PubMed] [Google Scholar]
- 5.Grebing BR, Coughlin MJ. Evaluation of Morton’s theory of second metatarsal hypertrophy. J Bone Joint Surg Am. 2004;86-A:1375–1386. doi: 10.2106/00004623-200407000-00004. [DOI] [PubMed] [Google Scholar]
- 6.Griffin PP, Rand F. Flexible pes planovalgus (flatfoot) In: Helal B, Rowly DI, Crachiolo A III, Myerson MS, editors. Surgery of disorders of the foot and ankle. London: Lippincott-Raven; 1996. pp. 271–277. [Google Scholar]
- 7.Hardy RH, Clapham JCR. Observations on hallux valgus; based on a controlled series. J Bone Joint Surg Br. 1951;33-B:376–391. doi: 10.1302/0301-620X.33B3.376. [DOI] [PubMed] [Google Scholar]
- 8.Hirsch BE. Structural biomechanics of the foot bones. J Am Podiatr Med Assoc. 1991;81:338–43. doi: 10.7547/87507315-81-7-338. [DOI] [PubMed] [Google Scholar]
- 9.Huang CK, Kitaoka HB, An KN, Chao EYS. Biomechanical evaluation of longitudinal arch stability. Foot Ankle. 1993;14:353–357. doi: 10.1177/107110079301400609. [DOI] [PubMed] [Google Scholar]
- 10.Hughes J, Clark P, Linge K, Klenerman L. A comparison of two studies of the pressure distribution under the feet of normal subjects using different equipment. Foot Ankle. 1993;14:514–519. doi: 10.1177/107110079301400905. [DOI] [PubMed] [Google Scholar]
- 11.Lord M, Reynolds DP, Hughes JK. Foot pressure measurement: a review of clinical findings. J Biomed Eng. 1986;8:283–294. doi: 10.1016/0141-5425(86)90060-9. [DOI] [PubMed] [Google Scholar]
- 12.Miller JW. Distal first metatarsal displacement osteotomy. Its place in the schema of bunion surgery. J Bone Joint Surg Am. 1974;56:923–931. [PubMed] [Google Scholar]
- 13.Morton DJ. Hypermobility of the first metatarsal bone: the interlinking factor between metatarsalgia and longitudinal arch strains. J Bone Joint Surg. 1928;10:187–196. [Google Scholar]
- 14.Munuera PV, Polo J, Rebollo J. Length of the first metatarsal and the hallux in hallux valgus in the initial stage. Int Orthop. 2008;32:489–495. doi: 10.1007/s00264-007-0350-9. [DOI] [PMC free article] [PubMed] [Google Scholar]
- 15.Pećina M, Ruszkowski I, Muftić O, Antičević D. The fibula in clinical and experimental evaluation of the theory on functional adaptation of bone. Coll Antropol. 1982;6:197–200. [Google Scholar]
- 16.Perry MD, Mont MA, Einhorn TA, Waller JD. The validity of measurement made on standard foot orthoroentgenograms. Foot Ankle. 1992;13:502–507. doi: 10.1177/107110079201300902. [DOI] [PubMed] [Google Scholar]
- 17.Prieskorn DW, Mann RA, Fritz G. Radiographic assessment of the second metatarsal: measure of first ray hypermobility. Foot Ankle Int. 1996;17:331–333. doi: 10.1177/107110079601700606. [DOI] [PubMed] [Google Scholar]
- 18.Saleh M, Murdoch G. In defence of gait analysis. Observation and measurement in gait assessment. J Bone Joint Surg Br. 1985;67(2):237–241. doi: 10.1302/0301-620X.67B2.3980533. [DOI] [PubMed] [Google Scholar]
- 19.Schneider W, Csepan R, Knahr K. Reproducibility of the radiographic metatarsophalangeal angle in hallux surgery. J Bone Joint Surg Am. 2003;85-A:494–499. doi: 10.2106/00004623-200303000-00015. [DOI] [PubMed] [Google Scholar]
- 20.Sharkey NA, Ferris L, Smith TS, Matthews DK. Strain and loading of the second metatarsal during heel-lift. J Bone Joint Surg Am. 1995;77:1050–1057. doi: 10.2106/00004623-199507000-00011. [DOI] [PubMed] [Google Scholar]
- 21.Shereff MJ, DiGiovanni L, Bejjani FJ, Hersh A, Kummer FJ. A comparison of nonweight-bearing and weight-bearing radiographs of the foot. Foot Ankle. 1990;10:306–311. doi: 10.1177/107110079001000604. [DOI] [PubMed] [Google Scholar]
- 22.Steel MW, Johnson KA, Dewitz MA, Ilstrup DM. Radiographic measurements of the normal adult foot. Food Ankle. 1980;1:151–158. doi: 10.1177/107110078000100304. [DOI] [PubMed] [Google Scholar]


