Abstract
As the disc is the largest avascular structure in the body, disc cells depend for their normal function on an adequate supply of nutrients (oxygen and glucose) and the removal of metabolic by-products (lactic acid) via blood vessels at the cartilaginous endplates and annulus periphery. Concentration gradients develop depending on the balance between the rates of transport and rates of cellular activity. Since consumption and production rates are coupled via extracellular pH, the gradients are interdependent. This is a novel model study which takes into account the realistic 3D geometry of a L5-S1 lumbar disc in solving the nonlinear coupled diffusion equations. Effects of perturbations (calcification, sclerosis) in endplates, increases in cell metabolic rates following growth factor injection and changes in lumbar posture (kyphotic or lordotic) on extreme values of nutrient and metabolite concentrations and their spatial locations are investigated. Solute concentrations, particularly those of glucose, substantially diminish as a consequence of disturbances in supply at the endplates, increases in cell metabolic rate and more lordotic postures. Results, when compared to those from simplified axisymmetric models, demonstrate the importance of consideration of realistic 3D disc geometry.
Keywords: 3D disc geometry, Finite element method, Nonlinear diffusion, Oxygen, Glucose
Introduction
Low-back pain is a major cause of disability and a health problem which places immense social and economic burdens on industrialized societies [27]. Although its aetiology is poorly understood, most cases appear strongly associated with degeneration of the intervertebral discs (IVDs) [6]. The IVDs are the largest avascular structures in the human body [7] being largely aneural, sparsely populated with cells [3, 27] and supplied by blood vessels only at their margins. The IVDs consist of an annulus fibrosus (AF) rich in collagen fibres that resist tension, a nucleus pulposus (NP) rich in proteoglycans that retain water and resist compression, and cartilaginous endplates (CEPs) that separate the disc from adjacent vertebral bodies [35]. Discs must be stiff enough to maintain loads and provide stability whereas soft enough to allow for spinal flexibility in different directions [27]. In degenerate discs, these functions are impaired due to biochemical and biomechanical alterations. Although earlier studies regarded mechanical injuries as a major factor in causing degeneration, it is now recognised that genotype underpins degenerative change [6] and that degeneration is driven by adverse changes in activity of the disc cells, responsible for making and maintaining important components such as collagen and proteoglycans [48].
Failure of nutrient supply to the disc cells has long been recognized as an important factor in the pathogenesis of disc degeneration [34, 46]. Solutes are transported into and out of the IVDs mainly by diffusion from blood vessels at the AF periphery and capillaries at CEPs [18, 20]. Disc cells consume glucose and oxygen to provide energy in the form of adenosine triphosphate (ATP) by the breakdown of glucose to lactic acid (glycolysis) [20]. An adequate supply of nutrients and removal of metabolic by-products is essential for normal cell function [19] as low oxygen and glucose and high lactic acid contents, adversely affect matrix turnover [23] and even cell viability [10]. Despite numerous experimental studies into factors influencing nutrient transport in the human disc [5, 11, 46], there remains ample need for reliable models to complement measurements in advancing our understanding of this complex phenomenon.
Earlier model studies [18, 32, 33, 42] have been limited to axisymmetric geometries of the IVD that, amongst others, neglect disc height variations present in the sagittal plane especially at lower lumbar discs. These geometries also place restrictions on realistic simulation of conditions of interest such as local endplate fractures/calcifications and changes in the posture. Recent model studies of disc nutrition under compression, while neglecting the upper and lower cartilaginous end-plates, have either assumed an axisymmetric geometry [22] or considered a 3D geometry but with a constant height along the disc and a single non-metabolised solute [50]. Hence, the primary objective of this study is to develop a novel, fully 3D finite element model (FEM) of a lumbar L5-S1 disc to investigate the solute transport within the disc tissue under different conditions. This would be one of the first attempts to account for the 3D characteristic of the transport problem. The concentrations of oxygen, glucose and lactate in the disc are computed while accounting for their coupling via tissue pH and the nonlinear concentration–consumption (for glucose and oxygen) and concentration–production (for lactate) relations [11]. The disc non-homogeneity is accounted by considering five distinct regions (inner AF, outer AF, NP, upper CEP and lower CEP). The 3D model allows for realistic investigation of the effects on species concentrations of changes in endplates exchange area, due to calcification or sclerosis following fracture, in one or both CEPs. The current 3D model also allows for the study of the changes in the disc geometry associated with more lordotic (as in standing) or more kyphotic (as in sitting) postures by altering the sagittal rotation by either ±2° or ±4° [2, 17]. Moreover, the effect of an increase in cellular metabolism following say growth factor injection in the AF or in the NP on nutrient gradients is analysed by augmenting the solute consumption/production rates by 25, 50 or 100% under normal and calcified CEP conditions. It is hypothesized that the concentration gradients are markedly affected by the 3D consideration of the disc geometry.
Methods
Finite element model
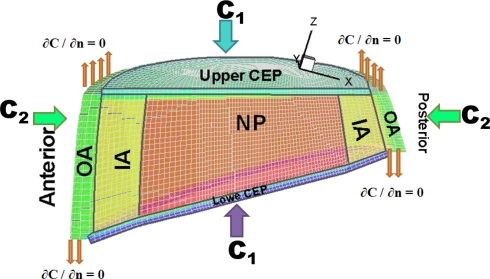
An existing detailed reconstructed model of the entire L1-S1 lumbar spine [13] was used to develop a 3D model of the lowermost lumbar L5-S1 disc with distinct regions of lower/upper CEPs, NP, inner AF and outer AF present in the model. The bony geometries were based on CT-images while the soft tissue boundaries and attachments were based on direct measurements of cadaver discs. The mid-height sagittal and lateral diameters of the disc were ~34 and 52 mm, respectively, with the thickness of the AF in the anterior region being ~25% greater than that in the posterior region. The disc height at the sagittal plane varied from a minimum of ~8 mm at the posterior region to a maximum of ~18 mm (including CEPs with 0.6 mm height each [39]) at the anterior region making a wedge angle of ~16° [43] (Fig. 1).
Fig. 1.
A view of the 3D mesh of the lumbar L5-S1 with a cut nearly at the mid-sagittal plane to depict various regions with distinct properties: NP nucleus pulposus, IA inner annulus fibrosus, OA outer annulus fibrosus CEPs upper/lower cartilaginous endplates
In Cartesian coordinates, the species nonlinear diffusion equation derived from Fick’s law and the continuity equation is expressed as:
 |
1 |
where R(C) is the production rate (positive) of metabolic by-products or consumption rate (negative) of nutrient species, respectively, given in concentration units/h, C is the solute concentration (kPa for oxygen, nmol/mm3 for glucose and lactate) and D is the diffusivity (mm2/h) [32, 33] (see Table 1 for input data). The model is subject to boundary conditions (Fig. 1); at the AF periphery, on the upper CEP, and on the lower CEP. These (C1 on CEPs and C2 at the annulus periphery, Fig. 1) are related to solute concentrations in the blood C0; C1 = 0.8 C0 for oxygen and lactic acid, C1 = 0.71 C0 for glucose, C2 = 0.9 C0 for all solutes where C0-Oxygen = ~6.4 kPa, C0-Glucose = ~5.6 nmol/mm3 and C0-Lactate = ~1.0 nmol/mm3. Water volume fractions in the tissues (ε) and average cell densities varied from a region to another based on the literature, see Table 1.
Table 1.
Disc properties in the model
| ε (%) | Cell density (103 cells/mm3) | Oxygen | Lactic acid | Glucose | ||||
|---|---|---|---|---|---|---|---|---|
| D (mm2/h) | Ci (kPa) | D (mm2/h) | Ci (nmol/mm3) | D (mm2/h) | Ci (nmol/mm3) | |||
| CEP | 60 | 15 | 2.81 | 5.1 | 1.13 | 0.8 | 0.76 | 4.0 |
| Nucleus | 80 | 4.0 | 5.0 | 2.02 | 1.36 | |||
| IA | 73 | 6.0 | 4.16 | 1.68 | 1.13 | |||
| OA | 66 | 12.0 | 3.4 | 5.8 | 1.37 | 0.9 | 0.92 | 5.0 |
D diffusivity, Ci boundary concentrations with i = 1 for the upper and lower CEPs and i = 2 for the outer annulus periphery, ε fluid volume fraction [33]
Recent measurements in disc AF, using fluorescein (molecular weight of 332 daltons) and photobleaching (FRAP) technique, have indicated a lower diffusion coefficient in the radial than axial and circumferential directions [45]. This solute is, however, very sensitive to proteoglycan concentrations and is excluded from the AF to a significantly greater extent than are the solutes used in the current work (molecular weights of 180, 90 and 16 daltons respectively for glucose, lactate and oxygen). Moreover, the directional resistance to diffusion for low molecular weight nutrients remains controversial as it has been shown in some studies [24] but not in others [12]; we thus assumed isotropic diffusion in each region of the disc [29].
As described earlier [32, 33], the convergence of the present steady-state case was hardly reached due to severe nonlinearities; therefore a pseudo-transient approach was employed by adding a capacity matrix (CM) to the conventional matrix (K) while using the implicit method. The final system in the matrix form is given as:
 |
2 |
where Δt is the time step (Δt = 5 × 10⁻² h). The transport load vector {fQ} is a function of unknown concentrations.
An in-house nonlinear finite element code was developed to solve the current 3D nonlinear coupled equations using a refined mesh filled with 8-node brick elements and ~100 K nodes (Fig. 1). Solving initially for the oxygen and lactate, the glucose concentration throughout the disc was determined in a subsequent step.
Coupling equations
The nonlinear equations governing the diffusion of oxygen and lactate were coupled via tissue pH which was in turn dependent on the lactic acid concentration. Based on measurements [11], nonlinear coupling relations (Eqs. 3 and 4) express, respectively, oxygen consumption rate  [as a function of pH level and oxygen concentration (O2)] and lactic acid production rate QL [as a function of pH level and oxygen concentration (O2)], both measured in the disc NP region. Consumption/production rates of species were extended to other disc regions (inner AF, outer AF, upper CEP and lower CEP) based on relative cell densities in different regions [33].
 |
3 |
 |
4 |
Because the energy production in the disc is virtually entirely by glycolysis where each glucose molecule is broken down into two lactic acid molecules and hence two lactate ions, the ratio between lactate production and glucose consumption is taken as 2.0 throughout the disc [11]. The coupling for the glucose acts, therefore, only in one direction.
Parametric studies
Exchange area
Capillaries penetrating the marrow cavities and abutting over ~10% of the endplate surface [29], are surrounded by a dense hyaline CEP which limits transport of large molecules into and out of the disc [40]. With ageing and degeneration, vascular channels are gradually occluded as endplates calcify [8] leading to a decrease in CEP permeability. This calcification acts as a barrier to nutrient transport [34, 39]. In the current study, the CEPs which cover the entire NP and inner AF [15] are considered permeable whereas the CEP above the outer AF remains completely calcified. To account for the effect of changes in CEP exchange areas, the water content of the CEP adjacent to the NP and inner AF or equivalently its diffusivity is diminished gradually from 100% (reference case as completely permeable) to a minimum of 5% (calcified case). The AF periphery remains completely permeable under all conditions [46]. The foregoing changes are applied either at the one CEP alone or simultaneously at both CEPs.
Endplate fractures
Endplate fractures adjacent to the NP space have frequently been observed and can be due to excessive compressive force on a normal healthy disc causing Schmorl’s nodes [41, 49]. These and other endplate disruptions can initially lead to increases in vascular contact but subsequent healing frequently results in sclerosis [25] and hence a localised region of the endplate which provides no nutrient exchange. To investigate the effect of such localized endplate disruptions on disc nutrition, a complete blockage in transport at a region with a 4 mm radius in the upper CEP above the nucleus is modeled with no source of supply passing through. The effect of the position on solute concentrations is also studied by shifting this impermeable region away from the centre anteriorly towards the NP/AF boundary above the NP space.
Increase in cell metabolism
With aging and degeneration, the PG content of the extracellular matrix and the synthesis of PGs tend to decrease markedly in the IVD [14]. One proposed strategy to reverse this process is to shift the metabolic activity of the disc cells from catabolism to anabolism by stimulating the cells with the injection of growth factors [31]. Growth factors, however, also increase rate of energy metabolism [37]. To investigate the effect of such increase in metabolic rate in the NP and AF on concentration profiles, cell activity was increased (by increasing cell density) by 25, 50 and 100% in either NP or AF assuming both fully and partially (30%) permeable CEPs.
Changes in posture
The lordotic lumbar posture has been associated with the high occurrence of disc narrowing in western societies [17]. To investigate the likely role of daily postural changes expected in lordotic (standing) and kyphotic (sitting) positions [28] on disc nutrition, the reference geometry of the model was modified to account for either ±2° or ±4° sagittal rotations. The lordotic postures in upright standing are, hence, simulated by extending the upper CEP by 2° or 4° whereas the kyphotic postures in sitting are modeled by forward flexion of the upper CEP by 2° or 4°.
Results
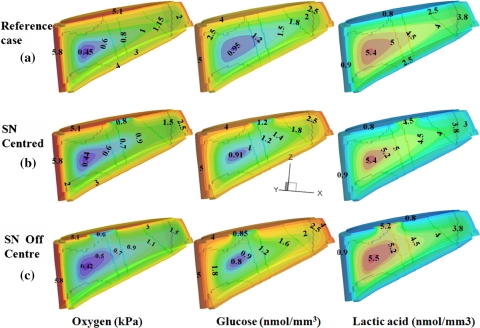
Under all conditions tested, oxygen and glucose concentrations decreased with distance from supply sources whereas lactic acid concentrations were highest in the disc central region (Fig. 2a). For discs in the reference state (100% permeable CEPs and initial geometry), the maximum lactic acid concentration (5.45 nmol/mm3) and lowest oxygen concentration (0.43 kPa) were found at the antero-lateral region of the inner AF whereas the lowest glucose concentration (0.94 nmol/mm3) occurred at the NP/AF interface (Fig. 2a); the minimum nutrient and maximum lactic acid concentrations are henceforward referred to as ‘extreme’ values of each species. The value of pH was directly related to lactic acid concentration and varied throughout the disc from pH 6.9 to 7.3.
Fig. 2.
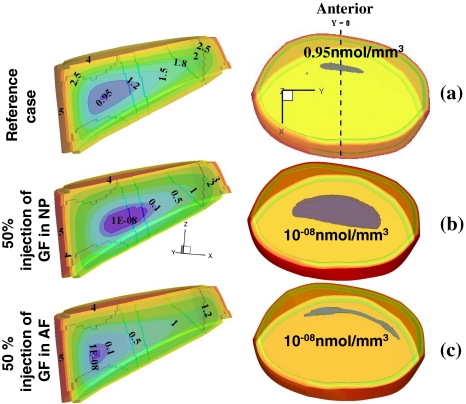
Effect of Schmorl’s node on concentration profiles at the sagittal plane (y = 0), a disc with fully permeable endplates (reference case), b disc with a Schmorl’s node at the upper CEP center, c disc with a Schmorl’s node off-centred at the upper CEP
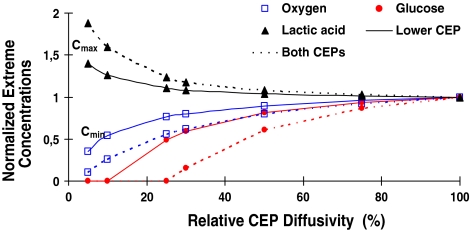
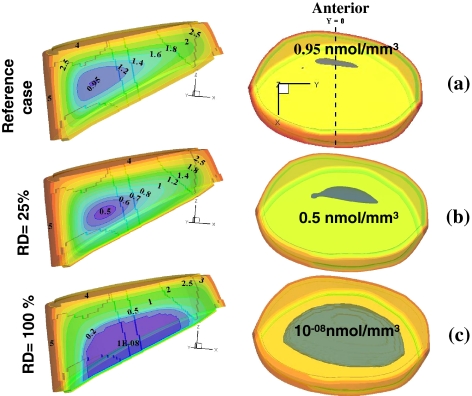
Solute concentrations were markedly influenced by changes in the CEP exchange areas (Figs. 2, 3, 4); oxygen and lactate extreme concentrations (minimum for oxygen and maximum for lactate) varied nonlinearly and fell rapidly once the exchange area was decreased to below 30% (Fig. 3) This nonlinearity was even more pronounced for glucose where the rapid fall in concentration was noted at exchange areas lower than 50% (Fig. 3). When the lower CEP was gradually blocked and its permeability decreased (Fig. 4), the critical zone of minimum glucose concentrations shifted towards it reaching almost zero concentration over ~50% of the nucleus space as the lower CEP exchange area fell to below 10%. In the presence of an endplate sclerosis (centered or off-centered) and subsequent disruption in nutrient transport, the extreme concentrations dropped noticeably by as much as 16% (Fig. 2).
Fig. 3.
The effect of changes in exchange area (EA, simulated by changes in relative diffusivity at endplates) either in lower or both upper/lower CEPs on extreme concentration values
Fig. 4.
Effect of changes in relative diffusivity in lower CEP on glucose concentration profiles (darker areas at the center indicate critical regions). On the left are mid-sagittal views of solute profile (y = 0) and on the right are the superior translucent views of the entire disc showing the glucose extreme regions in grey. a Reference case with 100% CEPs permeability, b reduced lower CEP exchange area at 25% of the reference case, c reduced lower CEP exchange area at 5% of the reference case. Glucose extreme values are given in (nmol/mm3)
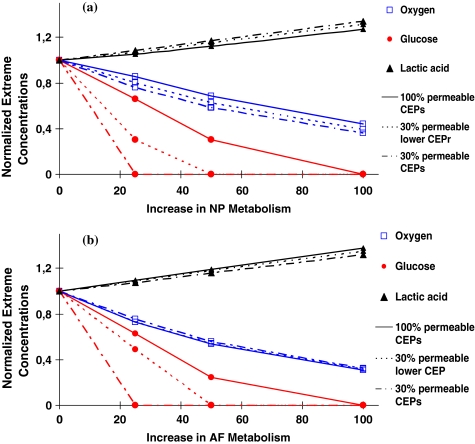
An increase in the rate of cell metabolism either in the nucleus or annulus adversely influenced values of extreme concentrations increasing lactic acid concentrations while diminishing those of oxygen and glucose (Fig. 5). The effect on the glucose was most striking; glucose concentrations fell to nil under a two-fold increase in cell metabolism even in presence of fully permeable CEPs; or even under smaller increases in cell metabolic rate but with less permeable CEPs (Fig. 5). The location of extreme concentrations was, however, affected by the zone in which the metabolic rate was increased (Fig. 6).
Fig. 5.
The effect of increases in cellular metabolism (simulating growth factor injection) in either the nucleus pulposus (a) or annulus fibrosus (b) on extreme concentrations for three disc CEP conditions; disc with fully permeable CEPs, disc with a 30% relative diffusivity at lower CEP, and disc with 30% relative diffusivity at both lower and upper CEPs
Fig. 6.
The effect of increase in cellular metabolism by 50% (simulating growth factor injection) on extreme glucose concentrations (nmol/mm3). Mid-sagittal views are shown on the left whereas on the right are the superior translucent views of the entire disc showing the glucose extreme regions in grey. a Reference case with 100% permeable CEPs, b increase in the nucleus with a 30% relative diffusivity at lower CEP, and c increase in the annulus region with a 30% relative diffusivity at lower CEP
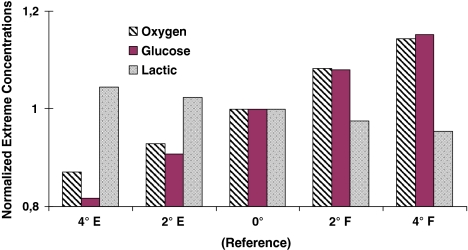
Flexion of the upper CEP influenced solute concentrations positively by increasing oxygen and glucose minimum concentrations by ~8 and 15 under 2° and 4° rotations, respectively. Extension had the opposite effect; the minimum oxygen concentration fell by 7 or 13% and the glucose minimum concentration by 9 or 18% when the disc was extended by 2° or 4° respectively. The effects on lactic acid concentration were less pronounced; it altered only by around 4% in all cases (Fig. 7).
Fig. 7.
The effect on solute extreme concentrations of alterations in disc posture (i.e., changes in sagittal disc wedge angle) when flexing forward (F) or extending backward (E) by 2° and 4°. The reference case refers to the unaltered initial geometry
Discussion
Genetics, ageing and the mechanical environment all influence disc structure and properties and, hence, may be involved in disc degeneration and failure processes; disruption in nutrient transport appears particularly important in progression of degeneration. Since the disc is largely avascular, nutrients are delivered to the disc cells mainly by diffusion as the convective contribution by ‘pumping’ of small solutes such as glucose or oxygen is relatively small [18, 47]. Disc cells use oxygen and glucose and produce lactic acid thus causing concentration gradients whose magnitude depend on the balance between the rates of transport and cellular activity. As consumption and production rates are coupled [11], their gradients are interdependent. Results of the current study confirm the hypothesis that the 3D geometry of the disc, as compared with previously-employed simplified axisymmetric models, markedly influences the predicted transport of nutrients and metabolites. Moreover, results clearly indicate that perturbations in transport through the CEPs, increases in rate of cell metabolism, and lordotic (extension) postures adversely influence the concentration gradients.
In comparison with earlier models which assumed simplified axisymmetric geometry [18, 32, 33, 42], the present study is the first to compute the 3D concentrations of oxygen, glucose and lactic acid in a human lumbar L5-S1 disc model. Although the trends of predicted concentrations remained overall similar, the magnitude and location of extreme concentrations were markedly altered when using the 3D geometry for the disc. The computed minimum oxygen concentration of 0.43 kPa, found for the reference case (i.e., fully permeable CEPs) at the antero-lateral region of the inner AF, falls within measured range of 0.3–1.1 kPa [20] and 0.53–1.06 kPa [16]. It is; however, lower than 0.75 kPa computed at the nucleus centre in our earlier axisymmetric model studies [33] and 0.49 kPa [22] evaluated in an axisymmetric disc with 50% permeable end-plate adjacent to the NP under a 10% nominal axial compressive strain. The computed maximum lactic concentration of 5.45 nmol/mm3 at the antero-lateral region of AF is also within the measured range of 2–6 nmol/mm3 [5] but greater than the maximum predictions of 4.56 nmol/mm3 at the nucleus center [33] and 4.38 nmol/mm3 in the AF region [22] using axisymmetric models. The extreme glucose concentration of 0.94 nmol/mm3 at the nucleus/annulus interface compares with 0.5–2.5 nmol/mm3 measured in scoliotic disc annuli [9]. It is, however, much smaller than 1.4 nmol/mm3 computed at nucleus centre for the axisymmetric model of the disc [33]. The predicted pH levels of 6.9–7.3 in the reference case and minimum pH level of 6.8 with nearly impermeable lower CEP compare well with 7.14 ± 0.04 and 6.65 ± 0.07 measured in normal and diseased discs, respectively [26]. It is recognized that the currently available measurements cannot yet demonstrate the relative accuracy of predictions in our 3D model as compared with earlier axisymmetric models.
The transport of nutrients via CEPs to disc cells can be significantly influenced by bony endplate sclerosis and changes in blood flow [36]. Calcification of CEPs with ageing, scoliosis and degeneration [14], implicated in the pathogenesis of disc degeneration, also disrupts transport of nutrients. With advanced degeneration, pronounced calcification and reduced proteoglycan content have been detected in lower CEPs as compared with upper ones [1]. Accordingly, effects on solute concentrations of impeding transport at the lower CEP or at both CEPs were investigated in this work. Computations demonstrated a non-linear dependence of species concentrations on exchange area at the endplates; results pointed to a critical threshold below which the disc nutrition is disrupted significantly. This strongly supports the hypothesis that endplate calcification, by depriving cells of nutrients, is involved in progress of disc degeneration [34, 40]. While oxygen and lactic concentrations altered dramatically once CEP effective diffusivity fell below ~25%, glucose was more sensitive to such an event as its concentration fell steeply once CEP effective diffusivity fell below ~40% (Fig. 3). The nonlinearity was even more pronounced when diffusivity was altered at both CEPs. Current results also indicate that endplate calcification could drop glucose concentrations to almost zero when relative diffusivity diminishes in lower CEP to <10% or in both CEPs to <25% suggesting a likely cell death scenario (Fig. 3). In the former condition, the extreme zone approached the lower CEP where the source supply was blocked. Results offer further support to the idea that glucose could therefore be a limiting nutrient for survival of disc cells [10].
In vitro studies have demonstrated that in healthy discs capable of developing large nucleus pressures, the central bony endplates and not the disc annulus are the most vulnerable structures to fracture under axial compression [6, 38]. Clinical studies have confirmed the high frequency of occurrence of such fractures as Schmorl’s nodes [41, 49]. Disruption of the endplate, while initially allowing contact of the disc with the blood supply, appears to lead long-term to a region of endplate sclerosis [25] with local disruption of transport through the CEP. In this study, the disruption of the upper CEP in presence of a single centrally placed region of sclerosis was found to diminish the critical glucose concentration by only ~4% that increased to ~16% when the fracture site shifted off-centre. The effects on extreme oxygen and lactate concentrations were negligible (Fig. 2). A decrease in glucose concentration could adversely affect local cell behavior and hence disc composition leading to the loss of proteoglycan and hydration [39]. Although the exact correlation between the endplate fractures and low-back pain remains unclear, it is generally agreed that such alterations predispose the disc to degeneration [38, 49].
Studies on the effect of growth factors on the metabolism of disc cells suggest the potential usefulness of growth factor injection as a therapeutic agent for the treatment of degenerated discs as the anabolic response of disc cells is crucial for maintaining the matrix homeostasis [30]. One way to decelerate and reverse the progression of disc degeneration is to switch the metabolic activity from catabolic to anabolic by stimulating the cells with growth factors. However growth factors also stimulate glucose consumption and lactic acid production in the disc and other cartilaginous tissues significantly [44]. In the current study, increases in cellular metabolism were simulated by increasing species production/consumption rates by 25, 50 or 100% either in the nucleus or in the annulus in presence of fully or partially (30%) permeable CEPs. Results suggest that an increase in cell metabolic rates following growth factor stimulation will substantially lower nutrient concentrations especially for glucose where concentrations reach as low as zero in the disc (Fig. 5); under such conditions the cells would not survive [10, 21]. The results also demonstrate that the increased metabolism in the NP as compared with the AF leads to lower glucose concentrations and a much greater critical zone with almost no glucose present (Fig. 6). Thus, injection of growth factors, rather than stimulating resident cells, increases the demand for nutrients that may adversely affect viability of existing cells even in a normal disc where the CEP is very permeable. In a degenerate disc where the nutrient supply is already disrupted, simulations show that the effects of metabolic stimulation are even more severe and growth factor injection may accelerate disc degeneration rather than reversing it.
Alterations in lumbar posture influence not only the muscle exertions and stresses in passive tissues [4] but also disc nutrition. Lumbar lordosis is indicated to increase by ~3° at each lumbar level on moving from a sitting posture to a standing one [28]. In this study, the reference geometry was thus altered by ±2° or ±4° to simulate changes in the lower lumbar levels likely to occur during daily sitting and standing postures. Upright standing positions were represented by lordotic postures while sitting positions by kyphotic ones. Simulations indicated that a kyphotic posture associated with forward flexion increased extreme oxygen and glucose concentrations in the reference configuration whereas these concentrations fell under backward flexion. These relative differences were magnified if a flexed posture was compared directly with an extended rather than a neutral posture. It should be emphasized however that the current study accounted only for the changes in the disc geometry with no consideration for associated alterations in fluid content, blood flow and spinal loads [4, 33]. In regular daily and occupational activities, the lowermost lumbar disc in comparison with upper discs is subject to largest compression and shear forces [4, 33]. Mechanical loads influence the transport of nutrients and their by-products by altering disc geometry, tissue fluid content [22, 33] and possibly blood flow and cell metabolism. These latter effects are however less understood and quantified at the present time.
In conclusion, the current results demonstrate the crucial role of the realistic 3D geometry of the disc, endplate perturbations (calcification, fracture), stimulation by growth factors of disc cells, and lumbar posture on extreme magnitude and location of solute concentrations. Glucose transport appears to be most sensitive to such perturbations.
Acknowledgments
The work is supported by the Natural Sciences and Engineering Research Council of Canada and the Arthritis Research Campaign.
References
- 1.Acosta FL, Rodgriguez AG et al (2007) Lumbar endplate degeneration is more pronounced at the inferior vertebral surface. SRS 39th Annual Meeting, Buenos Aires, Argentina
- 2.Adams MA, Hutton WC. The effect of posture on the fluid content of lumbar intervertebral discs. Spine. 1983;8:665–671. doi: 10.1097/00007632-198309000-00013. [DOI] [PubMed] [Google Scholar]
- 3.Alini M, Roughley PJ, et al. A biological approach to treating disc degeneration: not for today, but maybe for tomorrow. Eur Spine J. 2002;11(Suppl 2):S215–S220. doi: 10.1007/s00586-002-0485-8. [DOI] [PMC free article] [PubMed] [Google Scholar]
- 4.Arjmand N, Shirazi-Adl A. Biomechanics of changes in lumbar posture in static lifting. Spine. 2005;30:2637–2648. doi: 10.1097/01.brs.0000187907.02910.4f. [DOI] [PubMed] [Google Scholar]
- 5.Bartels EM, Fairbank JC, et al. Oxygen and lactate concentrations measured in vivo in the intervertebral discs of patients with scoliosis and back pain. Spine. 1998;23:1–7. doi: 10.1097/00007632-199801010-00001. [DOI] [PubMed] [Google Scholar]
- 6.Battie MC, Videman T. Lumbar disc degeneration: epidemiology and genetics. J Bone Joint Surg Am. 2006;88(Suppl 2):3–9. doi: 10.2106/JBJS.E.01313. [DOI] [PubMed] [Google Scholar]
- 7.Beadle OA (1931) The intervertebral discs, Observations on their normal and morbid anatomy in relation to certain spinal deformities. His Majesty’s Stationery Office
- 8.Bernick S, Cailliet R. Vertebral end-plate changes with aging of human vertebrae. Spine. 1982;7:97–102. doi: 10.1097/00007632-198203000-00002. [DOI] [PubMed] [Google Scholar]
- 9.Bibby SR, Fairbank JC, et al. Cell viability in scoliotic discs in relation to disc deformity and nutrient levels. Spine. 2002;27:2220–2228. doi: 10.1097/00007632-200210150-00007. [DOI] [PubMed] [Google Scholar]
- 10.Bibby SR, Urban JP. Effect of nutrient deprivation on the viability of intervertebral disc cells. Eur Spine J. 2004;13:695–701. doi: 10.1007/s00586-003-0616-x. [DOI] [PMC free article] [PubMed] [Google Scholar]
- 11.Bibby SR, Jones DA, et al. Metabolism of the intervertebral disc: effects of low levels of oxygen, glucose, and pH on rates of energy metabolism of bovine nucleus pulposus cells. Spine. 2005;30:487–496. doi: 10.1097/01.brs.0000154619.38122.47. [DOI] [PubMed] [Google Scholar]
- 12.Boubriak OA, Lee RB et al (2003) Nutrient supply to cells of the intervertebral disc; effect of diurnal hydration changes. In: 49th Annual Meeting of the Orthopaedic Research Society, New Orleans, Louisiana
- 13.Breau C, Shirazi-Adl A, et al. Reconstruction of a human ligamentous lumbar spine using CT images—a three-dimensional finite element mesh generation. Ann Biomed Eng. 1991;19:291–302. doi: 10.1007/BF02584304. [DOI] [PubMed] [Google Scholar]
- 14.Buckwalter JA. Aging and degeneration of the human intervertebral disc. Spine. 1995;20:1307–1314. doi: 10.1097/00007632-199506000-00022. [DOI] [PubMed] [Google Scholar]
- 15.Crock HV, Goldwasser M et al (1988) Vascular anatomy related to the intervertebral disc. In: Ghosh P (ed) Biology of the intervertebral disc, vol 1. CRC Press, Boca Baton, pp 109–133
- 16.Ejeskar A, Holm S. Oxygen tension measurements in the intervertebral disc. A methodological and experimental study. Ups J Med Sci. 1979;84:83–93. doi: 10.3109/03009737909179143. [DOI] [PubMed] [Google Scholar]
- 17.Fahrni WH. Conservative treatment of lumbar disc degeneration: our primary responsibility. Orthop Clin North Am. 1975;6:93–103. [PubMed] [Google Scholar]
- 18.Ferguson SJ, Ito K, et al. Fluid flow and convective transport of solutes within the intervertebral disc. J Biomech. 2004;37:213–221. doi: 10.1016/S0021-9290(03)00250-1. [DOI] [PubMed] [Google Scholar]
- 19.Grunhagen T, Wilde G, et al. Nutrient supply and intervertebral disc metabolism. J Bone Joint Surg Am. 2006;88(Suppl 2):30–35. doi: 10.2106/JBJS.E.01290. [DOI] [PubMed] [Google Scholar]
- 20.Holm S, Maroudas A, et al. Nutrition of the intervertebral disc: solute transport and metabolism. Connect Tissue Res. 1981;8:101–119. doi: 10.3109/03008208109152130. [DOI] [PubMed] [Google Scholar]
- 21.Horner HA, Urban J. 2001 Volvo Award Winner in Basic Science Studies: effect of nutrient supply on the viability of cells from the nucleus pulposus of the intervertebral disc. Spine. 2001;26:2543–2549. doi: 10.1097/00007632-200112010-00006. [DOI] [PubMed] [Google Scholar]
- 22.Huang CY, Gu WY. Effects of mechanical compression on metabolism and distribution of oxygen and lactate in intervertebral disc. J Biomech. 2008;41:1184–1196. doi: 10.1016/j.jbiomech.2008.02.002. [DOI] [PMC free article] [PubMed] [Google Scholar]
- 23.Ishihara H, Urban JP. Effects of low oxygen concentrations and metabolic inhibitors on proteoglycan and protein synthesis rates in the intervertebral disc. J Orthop Res. 1999;17:829–835. doi: 10.1002/jor.1100170607. [DOI] [PubMed] [Google Scholar]
- 24.Jackson AR, Yuan TY et al (2008) Strain-dependent and anisotropic glucose diffusion in annulus fibrosus. 54th Annual Meeting of the Orthopaedic Research Society, San Franciso, CA
- 25.Katz M, Teitelbaum SL, et al. Radiologic and pathologic patterns of end-plate-based vertebral sclerosis. Invest Radiol. 1988;23:447–454. doi: 10.1097/00004424-198806000-00007. [DOI] [PubMed] [Google Scholar]
- 26.Kitano T, Zerwekh JE et al (1993) Biochemical changes associated with the symptomatic human intervertebral disk. Clin Orthop Relat Res 293:372–377 [PubMed]
- 27.Kurtz S, Edidin A (2006) Spine technology handbook. Elsevier, Amsterdam
- 28.Lord MJ, Small JM, et al. Lumbar lordosis. Effects of sitting and standing. Spine. 1997;22:2571–2574. doi: 10.1097/00007632-199711010-00020. [DOI] [PubMed] [Google Scholar]
- 29.Maroudas A, Stockwell RA, et al. Factors involved in the nutrition of the human lumbar intervertebral disc: cellularity and diffusion of glucose in vitro. J Anat. 1975;120:113–130. [PMC free article] [PubMed] [Google Scholar]
- 30.Masuda K, Oegema TR, Jr, et al. Growth factors and treatment of intervertebral disc degeneration. Spine. 2004;29:2757–2769. doi: 10.1097/01.brs.0000146048.14946.af. [DOI] [PubMed] [Google Scholar]
- 31.Masuda K, An HS. Prevention of disc degeneration with growth factors. Eur Spine J. 2006;15(Suppl 3):S422–S432. doi: 10.1007/s00586-006-0149-1. [DOI] [PMC free article] [PubMed] [Google Scholar]
- 32.Mokhbi-Soukane D, Shirazi-Adl A, et al. Analysis of nonlinear coupled diffusion of oxygen and lactic acid in intervertebral discs. J Biomech Eng. 2005;127:1121–1126. doi: 10.1115/1.2073674. [DOI] [PubMed] [Google Scholar]
- 33.Mokhbi-Soukane D, Shirazi-Adl A, et al. Computation of coupled diffusion of oxygen, glucose and lactic acid in an intervertebral disc. J Biomech. 2007;40:2645–2654. doi: 10.1016/j.jbiomech.2007.01.003. [DOI] [PubMed] [Google Scholar]
- 34.Nachemson A, Lewin T, et al. In vitro diffusion of dye through the end-plates and the annulus fibrosus of human lumbar inter-vertebral discs. Acta Orthop Scand. 1970;41:589–607. doi: 10.3109/17453677008991550. [DOI] [PubMed] [Google Scholar]
- 35.Oegema TR., Jr Biochemistry of the intervertebral disc. Clin Sports Med. 1993;12:419–439. [PubMed] [Google Scholar]
- 36.Rajasekaran S, Babu JN, et al. ISSLS prize winner: A study of diffusion in human lumbar discs: a serial magnetic resonance imaging study documenting the influence of the endplate on diffusion in normal and degenerate discs. Spine. 2004;29:2654–2667. doi: 10.1097/01.brs.0000148014.15210.64. [DOI] [PubMed] [Google Scholar]
- 37.Razaq S (2002) Effects of extracellular pH on metabolism and turnover of cartilaginous tissues, DPhil thesis, Oxford University
- 38.Roaf R. A study of the mechanics of spinal injuries. J Bone Joint Surg Am. 1960;42B:810–823. [Google Scholar]
- 39.Roberts S, Menage J, et al. Biochemical and structural properties of the cartilage end-plate and its relation to the intervertebral disc. Spine. 1989;14:166–174. doi: 10.1097/00007632-198902000-00005. [DOI] [PubMed] [Google Scholar]
- 40.Roberts S, Urban JP, et al. Transport properties of the human cartilage endplate in relation to its composition and calcification. Spine. 1996;21:415–420. doi: 10.1097/00007632-199602150-00003. [DOI] [PubMed] [Google Scholar]
- 41.Schmorl G, Junghanns H. The human spine in health and disease. New York: Grune and Stratton; 1971. [Google Scholar]
- 42.Selard E, Shirazi-Adl A, et al. Finite element study of nutrient diffusion in the human intervertebral disc. Spine. 2003;28:1945–1953. doi: 10.1097/01.BRS.0000087210.93541.23. [DOI] [PubMed] [Google Scholar]
- 43.Shirazi-Adl A. Biomechanics of the lumbar spine in sagittal/lateral moments. Spine. 1994;19:2407–2414. doi: 10.1097/00007632-199411000-00007. [DOI] [PubMed] [Google Scholar]
- 44.Stefanovic-Racic M, Stadler J, et al. Nitric oxide and energy production in articular chondrocytes. J Cell Physiol. 1994;159:274–280. doi: 10.1002/jcp.1041590211. [DOI] [PubMed] [Google Scholar]
- 45.Travascio F, Brown MD et al (2008) Anisotropic and inhomogeneous diffusion in human lumbar annulus fibrosus: characterization of diffusion tensor and correlation to tissue morphology. 54th Annual Meeting of the Orthopaedic Research Society
- 46.Urban J, Holm S et al (1977) Nutrition of the intervertebral disk. An in vivo study of solute transport. Clin Orthop Relat Res 129:101–114 [PubMed]
- 47.Urban J, Holm S et al (1982) Nutrition of the intervertebral disc: effect of fluid flow on solute transport. Clin Orthop Relat Res 170:296–302 [PubMed]
- 48.Urban J, Roberts S. Degeneration of the intervertebral disc. Arthritis Res Ther. 2003;5:120–130. doi: 10.1186/ar629. [DOI] [PMC free article] [PubMed] [Google Scholar]
- 49.Vernon-Roberts B (1980) The pathology and interaction of intervertebral disc lesions, osteoarthritis of apophyseal joints, lumbar spondylosis and low back pain. In: Jayson M (ed) The lumbar spine and back pain. Pitman Medical Publishing Company, Kent, pp 83–114
- 50.Yao H, Gu WY. Three-dimensional inhomogeneous triphasic finite-element analysis of physical signals and solute transport in human intervertebral disc under axial compression. J Biomech. 2007;40:2071–2077. doi: 10.1016/j.jbiomech.2006.10.001. [DOI] [PMC free article] [PubMed] [Google Scholar]


