Abstract
The study design included an in vivo laboratory study. The objective of the study is to quantify the kinematics of the lumbar spinous processes in asymptomatic patients during un-restricted functional body movements with physiological weight bearing. Limited data has been reported on the motion patterns of the posterior spine elements. This information is necessary for the evaluation of traumatic injuries and degenerative changes in the posterior elements, as well as for improving the surgical treatment of spinal diseases using posterior procedures. Eight asymptomatic subjects with an age ranging from 50 to 60 years underwent MRI scans of their lumbar segments in a supine position and 3D models of L2–5 were constructed. Next, each subject was asked to stand and was positioned in the following sequence: standing, 45° flexion, maximal extension, maximal left and right twisting, while two orthogonal fluoroscopic images were taken simultaneously at each of the positions. The MRI models were matched to the osseous outlines of the images from the two orthogonal views to quantify the position of the vertebrae in 3D at each position. The data revealed that interspinous process (ISP) distance decreased from L2 to L3 to L4 to L5 when measured in the supine position; with significantly higher values at L2–3 and L3–4 compared with L4–5. These differences were not seen with weight-bearing conditions. During the maximal extension, the ISP distance at the L2–3 motion segment was significantly reduced, but no significant changes were detected at L3–4 and L4–5. During flexion the ISP distances were not significantly different than those measured in the MRI position at all segments. Going from the left to right twist positions, the L4–5 segment had greater amounts of ISP rotation, while all segments had similar ranges of translation in the transverse plane. The interspinous process distances were dependent on body posture and vertebral level.
Keywords: Lumbar spine, In vivo, Kinematics, Spinous process, MRI, Fluoroscopy
Introduction
Previous kinematic studies of the spine have primarily focused on the anterior elements of the spine, such as the vertebral bodies [4, 7, 11, 13, 16] and intervertebral discs [13]. The majority of these studies have measured the relative translation and rotation of adjacent vertebrae in the sagittal plane under various loading conditions. More recent studies have also tried to determine 6DOF intervertebral kinematics [11, 15, 16]. In contrast, limited data have been reported on the motion patterns of the posterior elements of the spine, including basic kinematic data on the facet joints and interspinous processes (ISPs). This information is necessary for the evaluation of traumatic injuries and degenerative changes in the posterior elements, as well as for improving the surgical treatment of spinal diseases using posterior procedures; such as the use of interspinous process devices (ISPD) for the treatment of spinal stenosis [17].
A review of the current literature reveals that a paucity of data has been reported on the motion patterns of the spinous processes. Neumann et al. [10] described a simple method using plain anterior–posterior (AP) radiographs in asymptomatic subjects for the measurement of ISP distances between adjacent lumbar spine levels in order to detect ruptures of the posterior ligamentous structures. In another study, Fisher et al. [3] measured ISP distance in normal subjects in the sitting position, with and without hip flexion, using a medial–lateral fluoroscopic imaging technique. Positional MRI has been used by Siddiqui et al. [13, 14] to study spinal canal dimensions as well as sagittal kinematics of the vertebrae and intervertebral discs both prior to and following ISPD implantation. Lastly, Lindsey et al. [9] also performed cadaveric testing to measure spinous process motion. However, adequate information on the native kinematics of the lumbar spinous processes, which can be used as a baseline from which to measure the changes that occur post-implantation of ISPDs, has yet to be reported.
The purpose of this study was to quantify the kinematics of the lumbar spinous processes in asymptomatic patients during unrestricted functional body movements with physiological weight bearing. We used a previously described and validated dual fluoroscopic image matching and MRI modelling method to measure the interspinous process motion from L2 to L5 vertebrae in the lumbar spine [16]. We hypothesised that interspinous process motion would be dependent on loading conditions and vertebral level.
Materials and methods
Eleven asymptomatic subjects with an age ranging from 50 to 60 years (5 males and 6 females) were recruited for this study. Approval of the experimental design by the authors’ institutional review board (IRB) was obtained prior to the initiation of the study. The subjects were evaluated for the absence of lower back pain and other spinal disorders. The presence of any spinal disorders, symptoms or anatomical abnormalities was used as indications for exclusion from the study. The subjects were also evaluated for the absence of abnormal motions of the hip and knee joints during gait. A signed consent form was obtained from each subject before any testing was performed.
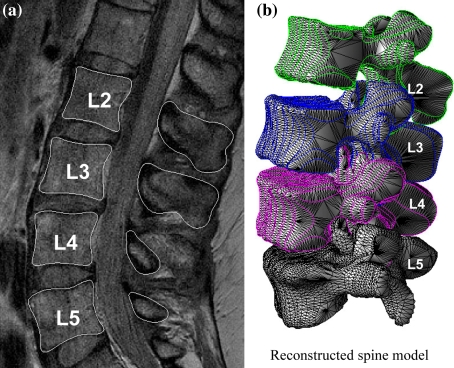
The lumbar segments of each subject were scanned using a 3 Tesla scanner (MAGNETOM Trio, Siemens, Germany) with a spine surface coil and a T2-weighted fat suppressed 3D SPGR sequence. The subject rested for approximately 30 min, and was then scanned in a supine, relaxed position. Parallel digital images with a thickness of 1.5 mm without gap and with a resolution of 512 × 512 pixels were obtained. The MR images of each subject were carefully examined. Two subjects were found to have the presence of early disc degeneration in the absence of clinical symptoms and one subject was found to have early scoliosis without symptoms. As a result, these three subjects were excluded from further investigation. Figure 1a shows a typical image from one subject.
Fig. 1.
A A typical MR image of a human lumbar spine in sagittal plane, B 3D anatomical vertebral model from L2 to L5 constructed using the MR images. Local coordinate systems at the endplates were used to calculate the relative 6DOF kinematics of the proximal vertebra with respect to distal vertebra
The MR images of the spinal segments were imported into a solid modelling software (Rhinoceros®, Robert McNeel & Associates, Seattle, WA) in order to construct 3D anatomical vertebral models of L2, L3, L4 and L5 of the lumbar spine using a protocol established in our laboratory [8]. The contours of the vertebrae were digitized manually using B-Spline curves in the software. Polygon mesh models of the vertebrae were then created from the contour lines. Figure 1b shows a typical 3D lumbar model of one subject.
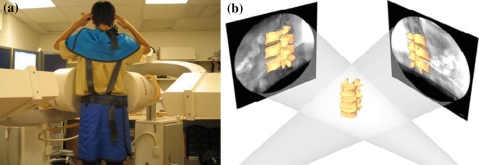
Following MR scanning, the lumbar spines of the subjects were imaged using a dual-orthogonal fluoroscopic system. Two fluoroscopes (BV Pulsera, Phillips, Bothell, WA) were positioned with their image intensifiers perpendicular to each other to capture images of the spine segments at different postures from orthogonal directions simultaneously (Fig. 2a). The fluoroscope had a clearance of approximately 1 m between the X-ray source and the receiver, allowing the subject to be imaged by the fluoroscopes simultaneously as they actively performed different motions.
Fig. 2.
A Dual fluoroscopic setup for imaging of the lumbar spine positions in living subjects, B the virtual dual fluoroscopic system established in a solid modelling software that is used to reproduce in vivo spine position using the fluoroscopic images and 3D vertebral models
The subjects’ anatomical regions above and below their lumbar spine were protected by specifically designed skirts, vests and thyroid shields during fluoroscopic imaging. A surgeon constantly checked the lead protections to ensure that their placement was not altered during the course of the experiment. The subject was asked to stand and position their lumbar spines within the view of both fluoroscopes and actively move to different positions in a predetermined sequence: standing position; 45° trunk flexion; maximal extension; maximal left-right twisting. The two laser pointers attached to the fluoroscopes helped to position the target lumbar spine segments inside the field of view of the two fluoroscopes. For each selected posture, the subject was asked to hold still for about 2 s while the two fluoroscopes took simultaneous images of the targeted spinal segment from two separate directions. The positions of testing subjects were carefully examined under the direction of an orthopaedic surgeon to reduce variation. No constraint was applied to the hips of the subjects while they performed active motions. During the testing, the subject was exposed to approximately seven pairs of fluoroscopic projections. The entire experiment took around 10 min to complete. The images were processed in the Digital Imaging and Communications in Medicine (DICOM) and Bitmap file formats.
The in vivo positions of the vertebrae at various weight-bearing body positions were reproduced in the Rhinoceros® solid modelling software using the 3D models of the vertebra and the orthogonal fluoroscopic images [16]. The pair of fluoroscopic images of the spine that were captured at a specific posture were imported into the modelling software and placed in calibrated orthogonal planes, reproducing the actual positions of the image intensifiers of the fluoroscopes. Two virtual cameras were created inside the virtual space to reproduce the positions of the X-ray sources with respect to the image intensifiers. Therefore, the geometry of the dual-orthogonal fluoroscopic system was recreated in the solid modelling programme (Fig. 2b). The MR image-based 3D vertebral models were introduced into the virtual fluoroscopic system and viewed from the perspective views of the two virtual fluoroscopic cameras. The 3D models of the vertebrae could be independently translated and rotated in 6DOF until their outlines match the osseous outlines captured on the two orthogonal fluoroscopic images. This process was executed using an existing protocol established in our laboratory [1, 5]. The software allowed the model to be manually translated and rotated in increments of 0.01 mm and 0.01°, respectively. Using this technique, the vertebral positions during in vivo weight-bearing activities were reproduced, representing the 6DOF kinematics of the vertebrae at each in vivo posture. In our previous validation paper [16], the accuracy of this technique is 0.3 mm and the repeatability is 0.3 mm in translation and 0.6° in rotation.
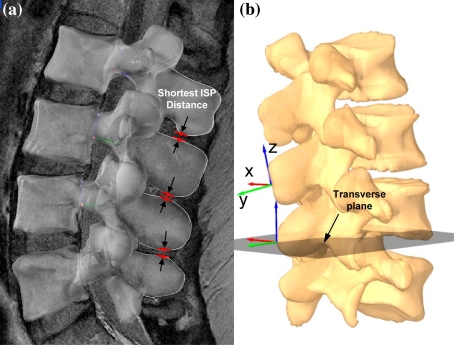
The relationship between the spinous processes at different positions was directly measured from the corresponding 3D lumbar models. In our study, we measured the shortest distances between the spinous processes in the modelling software at the standing, flexion and extension positions (Fig. 3a). We also measured the ISP distances at approximated ISPD locations (details provided in “Appendix”). In addition, right-handed Cartesian coordinate systems were also established at the tips of the spinous processes (Fig. 3b). The x axis was set perpendicular to the sagittal plane and pointed in the left direction; the y axis was set in the sagittal plane and pointed in the posterior direction; and the z axis was placed vertical to the X–Y plane and pointed proximally. For the purposes of this study, rotation about the z axis and displacement in the x axis were used to determine the interspinous rotation and displacement in the transverse plane, respectively. The range of motion of the spinous processes in the transverse plane was determined from left to right twist using the coordinate systems (Fig. 3b).
Fig. 3.
A shortest distance was measured between adjacent processes, B Local coordinate systems were established at the tip of the process to measure rotational angle and displacement in transverse plane
A repeated measure ANOVA was used to compare the ISP relationship at the L2–3, L3–4, and L4–5 vertebral levels in the same posture as well as the same level during different the weight-bearing positions. Statistical significance was set at P < 0.05. When a statistically significant difference was detected a Newman–Keuls post hoc test was performed. The statistical analysis was done using a software program (Statistica, Statsoft, Tulsa, OK).
Results
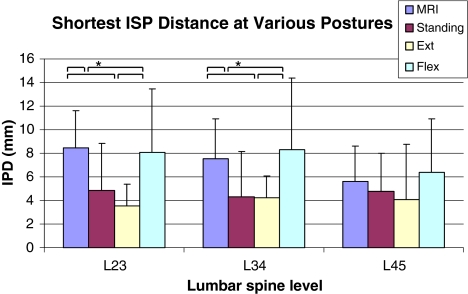
The shortest ISP distances were determined at the L2–3, L3–4 and L4–5 motion segments in the MRI, standing, extension and flexion positions (Table 1). During movement activities, the distances between the motion segments decreased from the supine position at the time of the MRI scan to the weight-bearing standing position. Statistical significance was found for the L2–3 (P = 0.036) and L3–4 (P = 0.025) motion segments, but not for L4–5 (P = 0.309). They also slightly decreased when going from standing to maximal extension, but no statistical difference was determined (P > 0.05). Predictably, they increased significantly when going from standing to maximal flexion for L2–3 (P = 0.028) and L3–4 (P = 0.018), but no significant difference was found for L4–5 (P = 0.288). They also increased significantly when going from maximal extension to flexion for L2–3 (P = 0.004) and L3–4 (P = 0.005), but not for L4–5 (P = 0.191) (Fig. 4).
Table 1.
Shortest distance between processes
| L2–3 (mm) | L3–4 (mm) | L4–5 (mm) | |
|---|---|---|---|
| MRI | 8.5 ± 3.1 | 7.5 ± 3.0 | 5.6 ± 3.0 |
| Standing | 4.9 ± 4.0*,# | 4.3 ± 3.9*,# | 4.8 ± 3.2 |
| Extension | 3.5 ± 1.8*,# | 4.2 ± 1.9*,# | 4.1 ± 4.7 |
| Flexion | 8.1 ± 5.4 | 8.3 ± 6.1 | 6.4 ± 4.5 |
* P < 0.05 when compared with MRI; #P < 0.05 when compared with flexion
Fig. 4.
Shortest distance between processes at various postures and different levels (*P < 0.05)
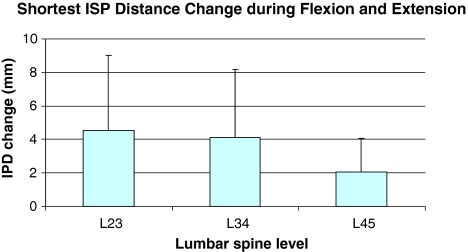
Interspinous process distances were also compared between different vertebral levels. The only significant difference was noticed in the MRI (supine) position. At this position, the L4–5 distance was found to be significantly smaller than the L2–3 (P = 0.003) and L3–4 (P = 0.018) distances. The distance changes that occurred while going from the flexion to the extension positions were also determined and were as follows: L2–3 = 4.5 ± 4.8, L3–4 = 4.1 ± 5.0 and L4–5 = 2.0 ± 2.3 mm (Fig. 5). No significance was seen between the different levels during this positional change. During left and right twisting movements, the range of rotational angles for the spinous processes was determined for each subject to be the following: L2–3 = 2.1 ± 1.2°, L3–4 = 2.7 ± 2.5° and L4–5 = 3.0 ± 2.1° (Table 2). The mean displacement in the transverse plane ranged from 1.5 to 2.3 mm when measured from the tip of the spinous process. No statistical significance was found for either rotational angle or displacement at the different levels, despite the mean rotation increasing from the L2–3 to L4–5 segments.
Fig. 5.
Distance change between processes during flexion and extension at different levels
Table 2.
ISP rotation and displacement in the transverse plane
| Rotational angle (°) | Displacement (mm) | |
|---|---|---|
| L2–3 | 2.1 ± 1.2 | 1.5 ± 0.9 |
| L3–4 | 2.7 ± 2.5 | 2.3 ± 1.6 |
| L4–5 | 3.0 ± 2.1 | 1.8 ± 1.8 |
Discussion
This study measured the changes that occurred in the ISP distances as well as the rotation that occurred in response to different weight-bearing postures in asymptomatic living subjects. The data revealed that the ISP distance decreased from L2 to 3 to L4–5 when measured in the supine, relaxed position (during MRI scanning); with significantly higher values found at the L2–3 and L3–4 motion segments when compared with that of L4–5. However, under weight-bearing conditions while in the standing position, the ISP distance ranged between 4 and 5 mm at all levels. During maximal extension, the ISP distances at the L2–3 and L3–4 motion segments were found to be significantly reduced by approximately 4.0 mm compared with flexion, but no significant changes were detected at the L4–5 segment. In contrast, during flexion, the ISP distances were not found to be significantly different from those measured in the MRI position at all levels tested. Going from the left to right twist positions, the lower motion segments had higher amounts of ISP rotation. The range of translation in the transverse plane during left and right twist was approximately 2.0 mm at all segments. Overall, these results indicate that the ISP distance changes were dependent on body posture and vertebral level.
There have been several prior attempts to study the kinematics of the native lumbar spinous processes. Neumann et al. [10] measured lumbar ISP distance changes between adjacent levels in the standing position to detect ruptures of the posterior structures of the lumbar spine. They concluded that a difference in ISP distance between adjacent levels exceeding 7 mm was consistent with the incompetence of the posterior structures and potential instability. However, it is important to note that their technique of measuring the ISP distance used the distance between the cranial ends of the spinous processes on the plain AP radiograph, which makes a direct comparison with our data difficult. In another study, Fisher et al. [3], reported mean lumbar ISP distances at the L2–3, L3–4 and L4–5 motion segments of 10.9, 9.9 and 10.1 mm, respectively. When measured with the hips flexed, these values were found to increase by 7, 11 and 21%, respectively. Their findings also showed larger ISP distances than ours at each segmental level. This may be due to the flexed position of their subjects while sitting, in contrast to our subjects who had no physical restrictions placed on the hips during flexion and extension of the trunk.
The study of ISP distance during functional activities has direct clinical relevance. Recently, several ISPDs have been approved in the United States for the treatment of spinal stenosis [17]. These devices are implanted between the spinous processes in order to produce flexion at the motion segment and enlarge the spinal canal and neural foramina; thereby attempting to improve the symptoms of neurogenic claudication and other conditions. Theoretically, such devices would allow for a normal ISP motion pattern at the implanted level while at the same time not affecting the kinematics of adjacent segments. However, few studies have examined the rotational and translational movement patterns of the ISP in normal lumbar spines. Most of the data that has been published concerning spinous process kinematics has been post ISPD implantation and has focused on the resultant changes that occur in the dimensions of the spinal canal, neural foramina [12, 13], and the intervertebral disc [13]. There is limited data available concerning the effects of ISPD on spinous process motion, with the available data being mainly obtained from in vitro studies under various loading conditions [9]. For example, a cadaveric study performed by Lindsey et al. [9] on seven lumbar spines (L2–5) specimens demonstrated marked restriction in flexion–extension motion in the sagittal plane at the level of insertion, but not at the adjacent levels. No changes in axial rotation or lateral bending were appreciated at any level tested; including the level of insertion. Our data on normal ISP motion, that is loading and segment level dependent, can be used as a normal reference when evaluating the effect of ISPD on ISP motions.
Knowledge of in vivo spinous process kinematic data before and after ISPD implantation is extremely limited in the current literature. In their multicenter, prospective, randomized trial, Zucherman et al. [17] performed a radiographic analysis at each follow-up interval that included measurement of ISP distances. When compared with a control group, the treated group demonstrated no significant differences in the mean values of ISP distance or any other radiographic measurements made at either the 1- or 2-year follow-up visits [17]. These authors used the method described by Neumann et al. [10] in order to measure ISP distance, which includes the length of the spinous process instead of simply measuring the ISP gap. In our study, we used a method similar to that proposed by Fisher et al. [3] to measure the shortest ISP distance. This method has been shown to be more accurate for the measurement of distances between spinous processes and can also replicate ISPD location [2, 3]. Therefore, the method could be invaluable for the evaluation of in vivo spinous process kinematics before and after ISPD implantation in patients.
There are several limitations to our study. Our sample size represented a relatively small number of subjects and the study focused on a narrow age range. However, it is important to note that the age range in this study closely reflects the demographics of the population most commonly treated for symptomatic spinal stenosis [6]. Another limitation of our findings is that we have yet to test individuals with spinal stenosis or those who have undergone ISPD implantation. This makes comparing our findings with the currently available data difficult. Despite the above limitations, our study represents the first in vivo measurement of ISP distance under various physiological loading conditions.
In conclusion, our initial kinematic studies have provided us with the quantitative data on the motion of the spinous processes during various weight-bearing postures. Our findings provide baseline information to enable the study of kinematic changes that occur in pathologic conditions of the spine and to determine how these are affected following surgical intervention. For example, these findings may suggest that a segment level-specific ISPD would be necessary in order to accommodate the ROM of ISPs under various physiological loading conditions. In the future, this information will help make improvements in ISPD design and surgical techniques for the management of spinal stenosis.
Acknowledgments
This work is supported by NASS Research Grant, MGH Orthopaedic Surgery Departmental Funding. Approval by the author’s institutional review board (IRB) was obtained. Each subject signed an approved consent form.
Appendix
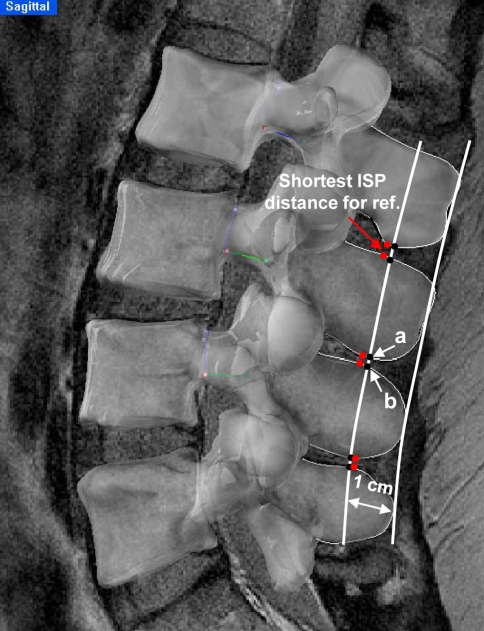
In addition to the shortest ISP distances, we also measured and compared the ISP distances at the approximated ISPD locations. Using a geometric technique, smooth tangential curves were drawn through the outermost tips of the spinous processes of L2–5 from the sagittal MRI images. The curve was offset 1 cm towards the vertebral body to replicate the location of ISPDs [3]. The ISP distance between “a” and “b” was measured at each level (Fig. 6). When measuring this distance, we anticipated that we would find similar trends and statistical differences with larger numerical values when compared with our initial technique of measuring the shortest distances.
Fig. 6.
Tangential curve through the outmost tips of processes was offset by 1 cm. Distance was measured between intersection points A and B. Shortest ISP distance was also shown for reference
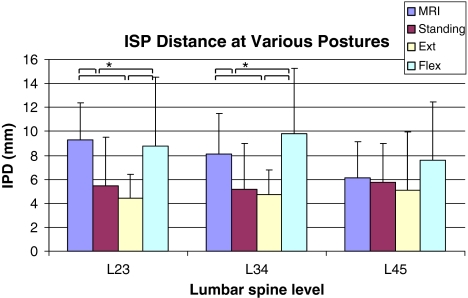
The ISP distances between “a” and “b” were determined at the L2–3, L3–4 and L4–5 segments for the MRI, standing, extension and flexion positions (Table 3). During movement activities, the distances between the motion segments decreased from the supine position at the time of the MRI scan to the standing position during the fluoroscopic imaging. Statistical significance was found for the L2–3 (P = 0.017) and L3–4 (P = 0.021) motion segments, but not for L4–5 (P = 0.742). They also slightly decreased when going from standing to maximal extension, but no statistical difference was determined (P > 0.05). Predictably, they increased significantly when going from standing to maximal flexion for L2–3 (P = 0.016) and L3–4 (P = 0.002), but not significantly for L4–5 (P = 0.216). They also increased when going from the extension to the flexion position, but no significance was found for any of the three segments that were tested (P > 0.05) (Fig. 7).
Table 3.
Distance at the location between “a” and “b”
| L2–3 (mm) | L3–4 (mm) | L4–5 (mm) | |
|---|---|---|---|
| MRI | 9.3 ± 2.9 | 8.1 ± 3.1 | 6.1 ± 2.7 |
| Standing | 5.5 ± 4.5*,# | 5.2 ± 4.0*,# | 5.8 ± 3.4 |
| Extension | 4.4 ± 2.0*,# | 4.7 ± 2.0*,# | 5.1 ± 4.9 |
| Flexion | 8.8 ± 5.8 | 9.8 ± 5.4 | 7.6 ± 4.9 |
* P < 0.05 compare with MRI; #P < 0.05 compare with flexion
Fig. 7.
Distance between processes measured between “a” and “b” at various postures and different levels (*P < 0.05)
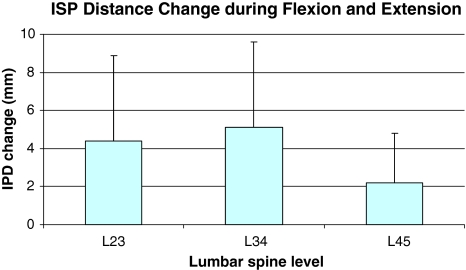
Using this technique, the ISP distances were also compared between different vertebral levels. The only significant difference was noticed in the MRI (supine) position. The L4–5 distance was found to be significantly smaller than the L2–3 (P = 0.002) and L3–4 (P = 0.016) distances. The distance changes that occurred while going from the flexion to the extension positions were also determined and were as follows: L2–3 = 4.4 ± 4.5 mm, L3–4 = 5.1 ± 4.5 mm and L4–5 = 2.5 ± 2.7 mm. No significance was seen between the different levels during this positional change (Fig. 8). Overall, the values were on average 0.5–1.5 mm larger than those obtained when measuring the shortest ISP distances. However, similar trends and statistical differences were noticed as was anticipated. It is, therefore, conceivable that either set of values can be used as a reference for future studies.
Fig. 8.
Distance change between processes during flexion and extension at different levels, measured between “a” and “b”
References
- 1.Bingham J, Li G. An optimized image matching method for determining in vivo TKA kinematics with a dual-orthogonal fluoroscopic imaging system. J Biomech Eng. 2006;128:588–595. doi: 10.1115/1.2205865. [DOI] [PubMed] [Google Scholar]
- 2.Bono CM, Vaccaro AR. Interspinous process devices in the lumbar spine. J Spinal Disord Tech. 2007;20:255–261. doi: 10.1097/BSD.0b013e3180331352. [DOI] [PubMed] [Google Scholar]
- 3.Fisher A, Lupu L, Gurevitz B, Brill S, Margolin E, Hertzanu Y. Hip flexion and lumbar puncture: a radiological study. Anaesthesia. 2001;56:262–266. doi: 10.1046/j.1365-2044.2001.01717-4.x. [DOI] [PubMed] [Google Scholar]
- 4.Fujiwara A, Lim TH, An HS, Tanaka N, Jeon CH, Andersson GB, Haughton VM. The effect of disc degeneration and facet joint osteoarthritis on the segmental flexibility of the lumbar spine. Spine. 2000;25:3036–3044. doi: 10.1097/00007632-200012010-00011. [DOI] [PubMed] [Google Scholar]
- 5.Hanson GR, Suggs JF, Freiberg AA, Durbhakula S, Li G. Investigation of in vivo 6DOF total knee arthroplasty kinematics using a dual orthogonal fluoroscopic system. J Orthop Res. 2006;24:974–981. doi: 10.1002/jor.20141. [DOI] [PubMed] [Google Scholar]
- 6.Kim DH, Albert TJ. Interspinous process spacers. J Am Acad Orthop Surg. 2007;15:200–207. doi: 10.5435/00124635-200704000-00003. [DOI] [PubMed] [Google Scholar]
- 7.Lee SW, Wong KW, Chan MK, Yeung HM, Chiu JL, Leong JC. Development and validation of a new technique for assessing lumbar spine motion. Spine. 2002;27:E215–E220. doi: 10.1097/00007632-200204150-00022. [DOI] [PubMed] [Google Scholar]
- 8.Li G, DeFrate LE, Park SE, Gill TJ, Rubash HE. In vivo articular cartilage contact kinematics of the knee: an investigation using dual-orthogonal fluoroscopy and magnetic resonance image-based computer models. Am J Sports Med. 2005;33:102–107. doi: 10.1177/0363546504265577. [DOI] [PubMed] [Google Scholar]
- 9.Lindsey DP, Swanson KE, Fuchs P, Hsu KY, Zucherman JF, Yerby SA. The effects of an interspinous implant on the kinematics of the instrumented and adjacent levels in the lumbar spine. Spine. 2003;28:2192–2197. doi: 10.1097/01.BRS.0000084877.88192.8E. [DOI] [PubMed] [Google Scholar]
- 10.Neumann P, Wang Y, Karrholm J, Malchau H, Nordwall A. Determination of inter-spinous process distance in the lumbar spine: evaluation of reference population to facilitate detection of severe trauma. Eur Spine J. 1999;8:272–278. doi: 10.1007/s005860050172. [DOI] [PMC free article] [PubMed] [Google Scholar]
- 11.Ochia RS, Inoue N, Renner SM, Lorenz EP, Lim TH, Andersson GB, An HS. Three-dimensional in vivo measurement of lumbar spine segmental motion. Spine. 2006;31:2073–2078. doi: 10.1097/01.brs.0000231435.55842.9e. [DOI] [PubMed] [Google Scholar]
- 12.Richards JC, Majumdar S, Lindsey DP, Beaupre GS, Yerby SA. The treatment mechanism of an interspinous process implant for lumbar neurogenic intermittent claudication. Spine. 2005;30:744–749. doi: 10.1097/01.brs.0000157483.28505.e3. [DOI] [PubMed] [Google Scholar]
- 13.Siddiqui M, Karadimas E, Nicol M, Smith FW, Wardlaw D. Effects of X-STOP device on sagittal lumbar spine kinematics in spinal stenosis. J Spinal Disord Tech. 2006;19:328–333. doi: 10.1097/01.bsd.0000211297.52260.d5. [DOI] [PubMed] [Google Scholar]
- 14.Siddiqui M, Karadimas E, Nicol M, Smith FW, Wardlaw D. Influence of X Stop on neural foramina and spinal canal area in spinal stenosis. Spine. 2006;31:2958–2962. doi: 10.1097/01.brs.0000247797.92847.7d. [DOI] [PubMed] [Google Scholar]
- 15.Steffen T, Rubin RK, Baramki HG, Antoniou J, Marchesi D, Aebi M. A new technique for measuring lumbar segmental motion in vivo: method, accuracy, and preliminary results. Spine. 1997;22:156–166. doi: 10.1097/00007632-199701150-00006. [DOI] [PubMed] [Google Scholar]
- 16.Wang S, Passias P, Li G, Li G, Wood K. Measurement of vertebral kinematics using noninvasive image matching method-validation and application. Spine. 2008;33:E355–E361. doi: 10.1097/BRS.0b013e3181715295. [DOI] [PubMed] [Google Scholar]
- 17.Zucherman JF, Hsu KY, Hartjen CA, Mehalic TF, Implicito DA, Martin MJ, Johnson DR, 2nd, Skidmore GA, Vessa PP, Dwyer JW, Puccio ST, Cauthen JC, Ozuna RM. A multicenter, prospective, randomized trial evaluating the X STOP interspinous process decompression system for the treatment of neurogenic intermittent claudication: two-year follow-up results. Spine. 2005;30:1351–1358. doi: 10.1097/01.brs.0000166618.42749.d1. [DOI] [PubMed] [Google Scholar]


