

Abstract
CheY, the 14-kDa response regulator protein of the Escherichia coli chemotaxis pathway, is activated by phosphorylation of Asp57. In order to probe the structural changes associated with activation, an approach which combines 19F NMR, protein engineering, and the known crystal structure of one conformer has been utilized. This first of two papers examines the effects of Mg(II) binding and phosphorylation on the conformation of CheY. The molecule was selectively labeled at its six phenylalanine positions by incorporation of 4-fluorophenylalanine, which yielded no significant effect on activity. One of these 19F probe positions monitored the vicinity of Lys109, which forms a salt bridge to Asp57 in the apoprotein and has been proposed to act as a structural “switch” in activation. 19F NMR chemical shift studies of the labeled protein revealed that the binding of the cofactor Mg(II) triggered local structural changes in the activation site, but did not perturb the probe of the Lys109 region. The structural changes associated with phosphorylation were then examined, utilizing acetyl phosphate to chemically generate phospho-CheY during NMR acquisition. Phosphorylation triggered a long-range conformational change extending from the activation site to a cluster of 4 phenylalanine residues at the other end of the molecule. However, phosphorylation did not perturb the probe of Lys109. The observed phosphorylated conformer is proposed to be the first step in the activation of CheY; later steps appear to perturb Lys109, as evidenced in the following paper. Together these results may give insight into the activation of other prokaryotic response regulators.
Regulatory proteins activated by phosphorylation play a central role in a wide range of eukaryotic and prokaryotic intracellular signaling pathways. In prokaryotes, a homologous class of two-component regulatory systems appears to be ubiquitous and provides phospho-regulation of diverse sensory and metabolic processes (1–3, 61). Each two-component regulatory system consists of a kinase protein regulated by changes in environmental or intracellular conditions, and a response regulator protein controlled by phosphorylation.
Escherichia coli possesses as many as 40 different two-component regulatory systems, one of which serves to alter the cell’s swimming behavior in response to changing environmental levels of specific nutrients or toxins (4). Chemotactic signaling begins with the binding of ligand in the periplasmic compartment to a specific transmembrane receptor, which in turn regulates the autophosphorylation of the cytoplasmic kinase CheA (5, 62). The covalent phosphoryl group is then transferred from CheA to the response regulator CheY (6, 7). Alternatively, the CheY protein can autophosphorylate using a small molecule phosphodonor such as acetyl phosphate (8). Phospho-CheY docks to the membrane-bound flagellar motor and regulates its rotational bias, favoring clockwise rotation (9). The phospho-CheY is rapidly inactivated by dephosphorylation, via either autocatalyzed hydrolysis or a parallel reaction stimulated by the CheZ protein (6). Ultimately, the changing balance between phosphorylation and dephosphorylation rates enables the bacterial cell to swim up a concentration gradient of chemical attractant, or down a repellant gradient. The present work focuses on the conformational change which generates the activated state of CheY; the approach combines elements of NMR and protein engineering. This first of two papers investigates Mg(II) binding and activation by phosphorylation, while the second considers specific mutations which activate CheY in the absence of phosphorylation (10).
Crystallographic studies have elucidated the structure of unphosphorylated CheY (11, 12; see Fig. 1). The CheY activation site, where phosphorylation occurs and the known activating mutants are found, includes 4 residues exhibiting 70–100% conservation across the response regulator family: Asp12, Asp13, Asp57, and Lys109 (13). The three aspartates form a carboxylate cluster Mg(II) binding site (59); similar sites are found not only in other prokaryotic response regulators but also in a wide variety of phosphochemistry enzymes including kinases, polymerases, and nucleases (2, 14–20). The site of CheY phosphorylation is Asp57, and bound Mg(II) ion serves as a cofactor in both the phosphorylation and dephosphorylation of this residue (21, 22); however, only the structure of the apoprotein is available. In this 1.7-Å resolution structure, the Mg(II) binding site is occupied by a highly ordered monovalent cation (ammonium or hydronium; divalent cations were absent, Ref. 12). The structure reveals a stable salt bridge between Lys109 and Asp57, which has been suggested to play a key role in activation by providing a simple electrostatic on-off switch (12, 56). Finally, interesting parallels have been noted between the structures of CheY and the eukaryotic protooncogenic H-ras protein, suggesting that an understanding of CheY activation may have broad implications (13, 23).
Fig. 1. Structure of CheY (12).

The space-filling side chains highlight the activation site containing the phosphorylation (Asp57), the proposed salt bridge switch (Asp57-Lys109) and the carboxylate cluster Mg(II) binding site (Asp12, Asp13, Asp57). Also highlighted are the six phenylalanine positions utilized as fluorine labeling sites to monitor the following regions: the vicinity of Lys109 (Phe111), the carboxylate cluster (Phe14), and the protein framework distant from the activation site (Phe8, Phe30, Phe53, and Phe124).
A number of questions can be raised regarding activation of CheY. The first concerns the general mechanism by which phosphorylation regulates CheY activity: there is precedent for at least three broad classes of mechanism. (i) Phosphorylation could result in a change in multimeric state, as has been observed for the bacterial transcriptional regulators BglG (24) and OmpR (25). However, activation does not appear to affect the multimeric state of CheY (26, 27). (ii) Phosphorylation could result in a local or global conformational change, as in glycogen phosphorylase (28, 29). (iii) The phosphoryl group could generate a surface contour or electrostatic perturbation in the absence of a conformational change, as in isocitrate dehydrogenase (30, 31). Subsequent questions focus on the specific features of the CheY activation mechanism. For example, a putative conformational change could be localized to the phosphorylation site, or allosterically communicated to distant regions of the molecule. Moreover, if the Asp57-Lys109 salt bridge is an activation switch, the nature and directionality of switching remain to be determined; in principle activation could occur via salt bridge breakage or formation, or via spatial repositioning of the salt bridge.
The technical challenges of the CheY system limit the approaches which can be used to probe activation. The half-life of phospho-CheY is t½ < 30 s due to its autodephosphorylation activity (6), thereby complicating crystallization or NMR structure determination of the phosphorylated conformer. However, 19F NMR is useful as a probe of CheY activation, whether by phosphorylation or specific mutations. The utility of 19F NMR in this application stems from the characteristic features of the 19F nucleus, including high sensitivity (0.833 that of 1H), lack of background resonances, ease of biosynthetic incorporation, and the nonperturbing nature of fluorine substitution at aromatic hydrogen positions (32–43). Furthermore, studies of conformational changes benefit from the strong dependence of the 19F NMR shielding on the symmetry of the fluorine lone-pair electrons; this symmetry is easily perturbed by packing forces and electrostatics within the local van der Waals environment. As a result, the 19F NMR chemical shift is among the most sensitive detectors of structural changes at specific labeling positions in a macromolecule (32–43). The power of the approach is further extended by its combination with protein engineering, which can be used to assign resonances, test models, and resolve ambiguities in interpretation.
The 6 phenylalanine residues of CheY were chosen as fluorine labeling sites because they are located at strategic sites for the analysis of activation (Fig. 1). Phe14 lies adjacent to Asp12 and Asp13 in the activation site. Phe111 is in van der Waals contact with the Lys109 side chain of the proposed salt bridge switch, and moreover is in the same surface loop. Finally, Phe8, Phe30, Phe53, and Phe124 form a cluster at the other end of the molecule, where these residues contact eight of the ten secondary structural elements. Thus the six Phe positions enable detection of both (i) local conformational changes in the activation site and associated salt bridge, and (ii) allosteric conformational changes transmitted from the activation site to the secondary structure framework. The para-substituted isomer 4-fluorophenylalanine (4F-Phe)1 was chosen as the label for biosynthetic incorporation; this isomer is preferred to the 2-fluoro and 3-fluoro isomers, which can exhibit ring-flip resonance heterogeneity.
The present study begins with characterization of the 4F-Phe-labeled protein and the effect of Mg(II) binding and phosphorylation on its conformation. No significant perturbation due to fluorine incorporation is observed, and the NMR resonances of the 6 4F-Phe residues are assigned by site-directed mutagenesis, including a novel approach using “nudge” mutations. The effect of divalent metal ion is then analyzed; Mg(II) binding to the unphosphorylated protein does not perturb the Phe111 probe of the Lys109 region, suggesting that this putative switch is not significantly altered by Mg(II) binding. Finally, phosphorylation is observed to trigger a long-range structural change which is communicated from the activation site to distant regions of the molecule.
MATERIALS AND METHODS
Isolation of 4-Fluorophnylalanine-labeled CheY
Wild-type and mutant CheY proteins were expressed in large quantity (up to 29 mg/liter media) from pRBB40-derived plasmids (10, 26) in the E. coli strain RBB455, a phenylalanine auxotroph (10). The labeling media contained 375 mg/liter 4-fluoro-DL-phenylalanine(4F-Phe) (Sigma), 1 g/liter Bacto-tryptone (DIFCO), 500 mg/liter Bacto-yeast extract (DIFCO), 5 g/liter NaCl, and 100 mg/liter CaCl2. For the 31P NMR samples, the 4F-Phe was replaced with DL-phenylalanine. Glycerol was added to 1.2% (v/v) as a carbon source. Immediately prior to growth 100 mg/liter MgSO4, 1 g/liter citric acid, 5 g/liter K2HPO4, 1.8 g/liter NaNH4PO4, 100 mg/liter ampicillin, 1 mg/liter thiamine, 40 mg/liter DL-histidine, and 20 mg/liter each of L-leucine, L-methionine, and L-threonine were added. The indicated vitamin and amino acid supplements supplied the nutritional requirements of the host strain. Cultures (600 ml/2-liter flask) were grown with vigorous aeration at 37 °C for 24 h. Protein production was induced after 8 h of growth by the addition of β-indoleacrylic acid to a final concentration of 100 mg/liter.
CheY was purified using a modification of a previously published procedure (44, 45). The cells were harvested from media (typically 3 or 6 liters) and washed in TEDG buffer, which contains 50 mM Tris-HCl, pH 7.5, 1 mM EDTA, 2 mM dithiothreitol, 10% (v/v) glycerol. A 50% (w/v) suspension of cells was lysed by French press in the presence of 5 mM phenylmethylsulfonyl fluoride. The resulting cell debris was removed by centrifugation at 250,000 × g in a Beckman TL-100 ultracentrifuge for 20 min. The supernatant was loaded onto an affinity column of 50 ml of Affi-Gel Blue (Bio-Rad) pre-equilibrated in TEDG, then washed with 50 ml of TEDG and with 50 ml of TEDG + 100 mM NaCl, before elution of CheY with a linear, 300-ml gradient from 0.1 to 1.5 M NaCl in TEDG. Fractions were analyzed by standard SDS-polyacrylamide gel electrophoresis, and those containing CheY were combined and concentrated to 5–8 ml by ultrafiltration using an Amicon stirred cell apparatus (YM3 membrane). This procedure routinely gave CheY which was ≥80% pure by SDS-polyacrylamide gel electrophoresis.
NMR Samples for Assignment Studies
Concentrated CheY was dialyzed at 4 °C (Mr cutoff 3500) against two changes of 50 mM Tris-HCl, pH 7.5, 10% (v/v) glycerol; and one change of 50 mM Tris-HCl, pH 7.0, 50 mM NaCl, 50 mM KCl, 2 mM MgCl2. All dialysis steps were against ≥150 volumes of buffer. After dialysis, the sample was centrifuged at 250,000 × g for 10 min and concentrated as previously described to 0.4–0.6 ml, then was recentrifuged at 250,000 × g for 10 min and placed in an NMR tube. To the resulting 0.5–8 mM CheY sample, D2O was added to a final concentration of 10% (v/v) for a lock standard and 5-fluorotryptophan (5F-Trp) was added to 50 μM final concentration as an internal frequency standard, defined to be −49.6 ppm.
NMR Samples for Metal Binding Studies
For metal binding experiments, CheY was dialyzed once against 50 mM Tris-HCl, pH 7.5, 1 mM EDTA, 25 mM KCl (Orion, Ca(II) electrode grade); once against 50 mM Tris-HCl, pH 7.5, 25 mM KCl; and four times against 50 mM Tris-HCl, pH 7.5. Further sample preparation was as above except that KCl (Orion, Ca(II) electrode grade) was added to 100 mM. After an initial divalent-free spectrum; MgCl2, CaCl2, SrCl2, or BaCl2 was added to 20 mM final concentration and another spectrum obtained.
NMR Samples for Phosphorylation Studies
For phosphorylation studies, CheY was dialyzed against one change of 50 mM Tris-HCl, pH 7.5, 10% (v/v) glycerol; against one change of 50 mM PIPES/NaOH, pH 7.0, 10% (v/v) glycerol; and against one change of 50 mM PIPES/NaOH, pH 7.0, 50 mM NaCl, 50 mM KCl, 2 mM MgCl2. The NMR sample was prepared as in the assignment studies except that the sample was adjusted to 150 μM 5F-Trp and 25 mM MgCl2. After an initial spectrum was obtained, 1 M acetyl phosphate (Sigma, LiK salt, pH 7.0, with NaOH) was added to a final concentration of 200 mM and sample acquisition was started within 120 s of mixing. Cumulative free induction decays were saved to different files every block (64 scans in 125 s for 19F; or 4 scans in 44 s for 31P). Finally, the difference free induction decay representing the n’th block was generated by subtracting the cumulative free induction decay of block n − 1 from that of block n.
NMR Parameters
19F NMR spectra were obtained on a Varian VXR 500 spectrometer at 470 MHz using a 5-mm 1H/19F probe (Varian). Standard parameters were 12,000-Hz spectral width, 16,384 data points, 90° pulse width, 0.68-s acquisition time, 1.2-s relaxation delay, 25-Hz line broadening, and temperature control at 25 °C. Relaxation times (T1) were measured using the 180°-τ-90° pulse sequence.
31P NMR spectra were obtained on the above spectrometer using a broad band probe (Varian) at 202 MHz. Spectral parameters were 10,000-Hz spectral width, 16,000 data points, 30° pulse width, 0.8-s acquisition time, 10.2-s relaxation delay, 5-Hz line broadening, and temperature control at 25 °C.
Determination of the Extent of Fluorine Incorporation
To quantitate the extent of fluorine incorporation, a 19F NMR spectrum was obtained with a 6-s relaxation delay to eliminate saturation. Fluorine incorporation was quantitated by integration of the resonance areas of the six individual 4F-Phe and comparison to the resonance area of a known quantity of 5F-Trp. Protein concentration was determined by a standard BCA assay (46). Together, the 19F and the protein concentrations enabled calculation of the extent of fluorine incorporation as the mole ratio of incorporation at each labeling site.
Error Estimates
Integration of individual 19F NMR resonances exhibited a standard deviation of σ = ±14%, as determined by comparing the integrals of a given resonance in four, independent spectra of wild-type CheY. The error inherent in measurements of 19F frequency shifts is ±0.1 ppm, as determined by comparing the frequencies of a given resonance in four, independent spectra.
Protein Graphics
Structures illustrated in this and the following paper (10) were generated by Insight II software (Biosym Technologies version 2.1.0) running on a Silicon Graphics Personal Iris 4D/35, driving a Tektronix Phaser III color printer.
Cloning and Mutagenesis
The bacterial strains, expression plasmids, and mutagenesis strategies used in this study are described in detail in the following paper (10).
RESULTS
Production of Fluorine-labeled CheY Protein
Quantities of 4F-Phe-labeled CheY sufficient for NMR were generated by overexpression of the plasmid-borne cheY gene in a Phe-auxotroph strain of E. coli. In order to generate the desired low level of fluorine incorporation, a mixture of 4F-Phe and unlabeled Phe (7.3:1) was used to supplement the auxotroph. The bacterial cell has the capacity to discriminate against 4F-Phe; as a result, the chosen ratio of 4F-Phe:Phe yielded an observed fluorine labeling efficiency of E = 5 ± 1%. This low level labeling minimizes perturbations due to fluorine incorporation at multiple sites in the same molecule. Assuming random labeling, the binomial expansion describes the fluorine distribution among the six independent positions: (p + q)6 = p6 + 6p5q + 15p4q2 + 20p3q3 + 15p2q4 + 6pq5 + q6, from which the prevalence of specific subpopulations can be calculated. The average labeling efficiency yielded a major subpopulation lacking fluorine (q6 = 74%), a smaller subpopulation containing only one fluorine (6pq5 = 23%), and a minor subpopulation containing multiple fluorines (remainder = 3%). It follows that the resulting 19F NMR spectrum was dominated by the resonances of the six different single-fluorine molecules, each essentially a single atom mutant.
Effects of Fluorine Incorporation on Structure and Activity
Independent studies have demonstrated that the effects of fluorine substitution for aromatic hydrogen on protein structure and function are generally small or undetectable (39, 40, 42, 47, 48). To date, studies of eight proteins have revealed minimal changes in activity and structure due to aromatic fluorine labeling (33, 35, 38, 40, 50–53). Moreover, although 4F-Phe has not previously been incorporated into E. coli, higher animals can tolerate 4F-Phe incorporation rates as high as 25%, suggesting that significant perturbations of specific proteins are rare (54). Several explanations can be offered: aromatic fluorine is a poor hydrogen bond acceptor (42, 49); the polarity of the C-F bond is reduced by backbonding to the ring π system; and the volume of an aromatic side chain is not significantly increased by the fluorine substitution (for example, the volume of the 4F-Phe side chain is 0.7% larger than that of Phe).
Four different approaches were undertaken to examine the effects of fluorine incorporation on CheY. First, when tyrosine was substituted for each phenylalanine by site-directed mutagenesis, the largest in vivo perturbation of chemotactic swarm activity was 2-fold, indicating that the 4-hydroxy substitutions caused, at most, minor pertubations (Table I). The corresponding fluorine substitutions are expected to be still less perturbing because, unlike the hydroxyl, they lack the propensity to participate in hydrogen bonds. Second, when 4F-Phe-labeled CheY was autophosphorylated by acetyl phosphate, 19F NMR measurements enabled independent measurement of the dephosphorylation kinetics for the four fluorine labeling positions 4F-Phe8, 4F-Phe30, 4F-Phe53, and 4F-Phe124; each was within the time scale expected for the published reaction parameters (see below). Third, the KD for Mg(II) binding to the 4F-Phe14 subpopulation was determined by NMR titration, and was within experimental error of the native KD (see below). Finally, the 19F NMR resonances from the buried 4F-Phe8, 4F-Phe30, 4F-Phe53, and 4F-Phe111 positions yielded resonance frequencies well resolved from the solvent-exposed frequency (by ≥0.9 ppm; Table I), as expected for kinetically stable folded proteins. In contrast, folding mutations typically yield the solvent-exposed frequency for all six resonances (data not shown). Overall, the evidence indicates that fluorine labeling generates no significant perturbation of CheY.
Table I.
Properties of CheY phenylalanines
| Phe position | Solvent accessible surface areaa | 19F NMR chemical shift relative to solvent-exposed 4F-Pheb | T1 | Relative effect of 4-hydroxyl substitution on chemotaxisd |
|---|---|---|---|---|
| Å2 | ppm | sc | ||
| 8 | 2.7 | +0.9 ± 0.1 | 0.6 ± 0.1 | 1.0 |
| 14 | 221.5 | −0.1 | 0.9 | 0.9 |
| 30 | 38.5 | +0.6 | 0.7 | 1.3 |
| 53 | 6.5 | +3.1 | 0.5 | 1.0 |
| 111 | 28.7 | −1.1 | 0.6 | 0.5 |
| 124 | 69.2 | −0.4 | 0.7 | 0.7 |
Solvent accessible surface areas of Phe side chains were calculated from the crystal structure using a probe radius and slab thickness of 1.4- and 0.10-Å, respectively, in the 1983 version of the program Accessibility by Handschumacher and Richards (58). Water and the sulfate ion were removed prior to calculations.
The resonance frequency of solvent-exposed 4F-Phe was −40.5 ppm.
T1 values measured as described under “Materials and Methods.”
Chemotactic ability of the Tyr for Phe mutations was measured relative to wild type by swarm plate assay (10).
Assignment of the 19F NMR Spectrum
Fig. 2 displays the 19F NMR spectrum of 4F-Phe-labeled CheY. The observation of six well resolved resonances of similar integrated intensity indicates that the labeling efficiencies of the the six fluorine-labeling positions are equivalent, and that each of the six 4F-Phe-labeled molecules has a single average conformation in solution.
Fig. 2. 470-MHz NMR spectrum of 4F-Phe-labeled CheY.

The two indicated spectra were obtained from different 4F-Phe CheY preparations, demonstrating the reproducibility of the fluorine chemical shifts. Six well resolved resonances are observed. Sample parameters were: 2 mM CheY, 2 mM MgCl2, 50 mM KCl, 50 mM NaCl, 50 mM Tris-HCl, pH 7.0, 10% D20, 50 μM 5F-Trp as internal frequency standard, 25 °C. Assignments were made as in Fig. 3.
The six 4F-Phe resonances were assigned by two methods. The replacement method utilized site-directed mutagenesis to replace phenylalanine with either tyrosine or leucine, resulting in deletion of the target resonance. This method is illustrated in Fig. 3 by the effect of the F14Y mutation on the 4F-Phe14 resonance. However, for the other five positions, the replacement method resulted in multiple resonance shifts, thereby complicating the interpretation. Not surprisingly, such problems were most acute for substitutions in the cluster of four phenylalanines, which share extensive van der Waals contacts.
Fig. 3. 19F NMR resonance assignments.

Summarized are the spectra of the engineered mutants used to assign the 4F-Phe resonances, either by the direct replacement method (F14Y), or by the nudge method (the others), as described in the text. Spectra of engineered proteins (bold lines) are superimposed on the spectrum of the wild-type protein (fine line). The wild-type resonance assigned by each mutation is indicated by the arrow. Sample parameters were as described in the legend to Fig. 2.
It was therefore necessary to develop a second approach, termed the nudge mutation method. This approach substituted a residue of different size at a position in van der Waals contact with the target Phe residue. Ideally, a nudge mutation specifically alters the environment of only the target Phe, thereby shifting a single 19F NMR resonance. Frequency shifts generated by nudge mutations were used to assign the 4F-Phe30, 4F-Phe53, 4F-Phe111, and 4F-Phe124 resonances; in each case the mutation caused a different major resonance shift (Fig. 3). The resonance of 4F-Phe8 was assigned by difference, as no nudge mutation was found which generated only one major shift; evidently, Phe8 is most tightly coupled to the other phenylalanines in the cluster. In specific cases, the 4F-Phe124 resonance was also observed to be sensitive to nudge mutations at other positions in the cluster, such that it shifted to overlap the 4F-Phe14 resonance (Fig. 3, −40.7 ppm; mutants L84V and K4Q). Such behavior is consistent with the proximity of the 4F-Phe124 ring to solvent, where it might easily be pushed into a more aqueous environment. It should further be noted that the nudge mutant spectra often exhibited an additional resonance at the frequency observed for denatured protein (Fig. 3, −41.0 ppm; mutants N121Q, L84V, and K4Q), suggesting that perturbations of the Phe cluster can be destabilizing. Finally, an unidentified contaminant resonance is occasionally observed in some, but not all, preparations of a given mutant (Fig. 3, −44.5 ppm; illustrated by the mutant V107I).
To further test the assignments, paramagnetic metal ions were used to identify the resonances from specific 4F-Phe residues. The crystal structure indicates that the Phe14 and Phe111 residues lie within 3.8 and 11.2 Å, respectively, of the putative metal ion binding site in the carboxylate cluster, whereas the other labeled residues are located at least 17 Å away. The binding of Mn(II) (S = 5/2) specifically broadened two resonances in the spectrum to the base line, consistent with their previous assignment as 4F-Phe14 and 4F-Phe111 (Fig. 4). The crystal structure also suggests that the side chains of 4F-Phe14 and 4F-Phe124 will be most exposed to solvent (Table I), a prediction which was tested by the addition of the water-soluble Gd(III) EDTA complex (S = 7/2) (55). This aqueous paramagnet specifically broadened the 4F-Phe14 and 4F-Phe124 resonances, thereby supporting their assignments (Fig. 4).
Fig. 4. Effect of paramagnetic metal ions on the 19F NMR spectrum of 4F-Phe-labeled CheY.

Each spectral pair consists of one spectrum obtained prior to the addition of paramagnetic probe (fine line), and a second spectrum illustrating the effects of the paramagnet (bold line). Mn(II) ion binding to the carboxylate cluster is observed to selectively broaden two resonances near the carboxylate cluster divalent cation binding site (upper, arrows), while the aqueous probe Gd(III)·EDTA broadens the two overlapping resonances exposed to solvent (lower, arrow). Sample parameters were as described in the legend to Fig. 2, except MgCl2 was omitted and additional divalent-free KCl was substituted for the NaCl.
Additional support for the assignment scheme was provided by relaxation studies of the 4F-Phe resonances. The observed spin lattice relaxation times ranged from T1 = 0.5 ± 0.1 to 0.9 ± 0.1 s, with the most solvent exposed side chains of 4F-Phe14 and 4F-Phe124 exhibiting the longest values (Table I).
Conformational Effects of Mg(II) Binding
In order to probe the effects of divalent cation binding on the solution conformation of CheY, the 19F NMR spectrum was obtained in buffer containing 100 mM divalent-free KCl, then the appropriate group IIa metal ion was added to 20 mM (Mg(II), Ca(II), Sr(II), and Ba(II)). The affinities of these ions for the carboxylate cluster are quite similar, yielding dissociation constants ranging from 0.4 to 1.0 mM (59), thus the concentration utilized was saturating for each metal ion. When examining the effects of these ions on the 19F NMR resonances, it is useful to distinguish small frequency shifts from large ones; here the distinction will be made that shifts smaller than the error in the frequency measurement, approximately 0.1 ppm, are minor shifts, while shifts greater than 0.1 ppm are major. Because the fluorine frequency is extremely sensitive to multiple environmental parameters, failure to observe a major shift provides strong evidence that no significant structural change has occurred in the vicinity; however, fortuitous cancellation of opposing shift contributions cannot be ruled out.
Due to both the high physiological concentration of free Mg(II) and its role as a required cofactor in CheY phosphosignaling (22), the primary focus was on this ion. The binding of Mg(II) caused detectable frequency shifts for only two of the six 4F-Phe resonances: the 4F-Phe14 and 4F-Phe8 resonances were shifted +0.2 and −0.1 ppm, respectively (Fig. 5). These shifts stem from specific binding of Mg(II) to the carboxylate cluster, since the D13K substitution at Asp13 of the cluster eliminated the effects of Mg(II) on the NMR resonances, and on the fluorescence of Trp58 near the activation site (data not shown). The shift of the 4F-Phe14 resonance was sufficiently large to carry out an NMR titration, which yielded a Mg(II) dissociation constant (0.7 ± 0.1 mM) indistinguishable from the value obtained by fluorescence titration of the unlabeled protein (1.0 & 0.2 mM).
Fig. 5. Effect of group IIa metal ions on the 19F NMR spectrum of 4F-Phe-labeled CheY.

Each spectral pair includes the spectrum of CheY saturated with a 20 mM concentration of the appropriate divalent metal ion (bold line), overlayed on the spectrum obtained in the absence of divalent ions (fine line). Arrows indicate the resonances exhibiting the largest divalent-induced frequency shifts. Sample parameters were as described in the legend to Fig. 4.
Of particular interest is the observation that the 4F-Phe111 resonance was not detectably affected by Mg(II) binding, suggesting that the environment of this probe was not significantly altered. More specifically, this absence of a frequency shift implies that the Lys109 side chain and associated surface loop retain similar conformations in the apo- and Mg(II)-occupied solution structures. In contrast, other group IIa metal ions generated detectable frequency shifts for 4F-Phe111 In each case this resonance was shifted upfield by a degree related to the ionic radius: Ca(II) exhibited the largest shift (−0.7 ppm). These data suggest that unlike Mg(II), the larger divalent ions alter the conformation of the Lys109 region upon binding. Smaller frequency shifts (≤0.1 ppm) were also observed for the Phe8 resonance; these shifts decreased in magnitude with increasing ionic radius, suggesting a dependence on the charge density or size of the metal ion. Overall the structural change due to metal ion binding appears to be localized to the activation site and its associated carboxylate cluster, with only a minor conformational perturbation transmitted to the distant Phe cluster, where the perturbed 4F-Phe8 is the residue most proximal to the activation site (17 Å).
Phosphorylation with Acetyl Phosphate
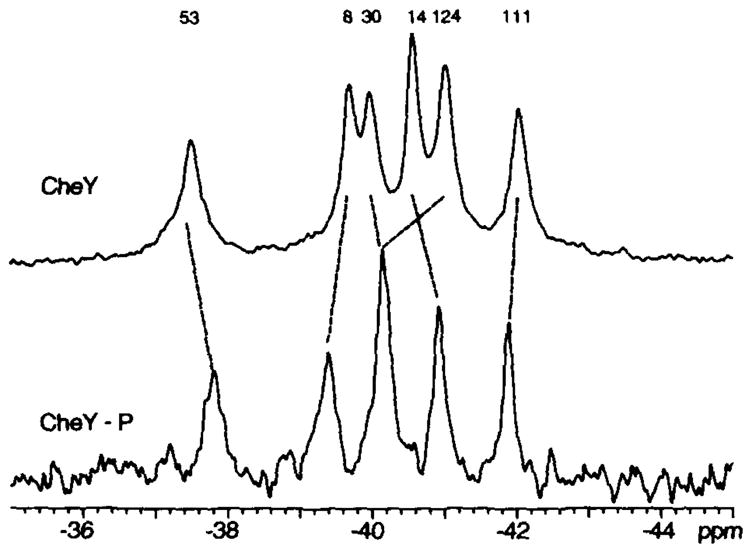
By adding a large initial molar excess of the phosphodonor acetyl phosphate (200 mM, relative to 7 mM CheY), it was possible to simultaneously detect the 19F NMR spectra of CheY and phospho-CheY for up to 10 min during the NMR acquisition (Fig. 6). As the phosphodonor was hydrolyzed and the phospho-CheY decayed, the spectrum returned to that observed before phosphodonor addition, except for shifts of the 4F-Phe14 and 4F-Phe111 resonances (Fig. 6) which could be reproduced by the direct addition of products (200 mM acetate and phosphate, and a pH change from pH 7.0 to 6.1) in the absence of phosphodonor (data not shown).
Fig. 6. Effect of phosphorylation on the 19F NMR spectrum of 4F-Phe-labeled CheY.

Shown is the spectrum of 4F-Phe CheY before the addition of acetyl phosphate as a phosphodonor (0 min), then as the reaction proceeds a mixture of phospho-CheY and CheY appears (10 min), and finally the phospho-CheY is fully hydrolyzed and the CheY population returns to its unphosphorylated state (50 min). Reaction conditions were 7 mM CheY, 25 mM MgCl2, 50 mM KCl, 50 mM NaCl, 50 mM PIPES/NaOH, pH 7.0, 10% D2O, and 150μM 5F-Trp. The reaction was initiated by addition of 200 mM acetyl phosphate, pH 7.0. The indicated assignment for 4F-Phe14 was revealed by the spectrum of the phosphorylated CheYF14Y mutant; other phospho-CheY assignments assumed the simplest pattern of shifts (see also Fig. 8).
The phosphorylation reaction for this system can be written in three steps,
| (Eq. 1) |
| (Eq. 2) |
| (Eq. 3) |
where CheY includes its cofactor Mg(II). Also implicit is the release of protons as the reaction proceeds, which occurs because the hydrolysis of acetyl phosphate consumes hydroxide ion.
The time course of the phosphorylation reaction was monitored by 31P NMR, which provided simultaneous detection of the reactant and the product . Fig. 7 illustrates the time courses of each phosphocompound as well as an independently determined time course for phospho-CheY obtained from its 19F NMR spectrum. The 31P and 19F time courses for phospho-CheY exhibit good agreement; the phospho-CheY population detected by 19F NMR is nearly constant for the first 8 min of the reaction, until the level of phosphodonor has dropped to near its Km = 0.7 mM (8). Greater than 99% of the observed phosphodonor hydrolysis is attributable to CheY, yielding a calculated phospho-CheY half-life of t½ ~ 6 s.
Fig. 7. Time course of the acetyl phosphate hydrolysis reaction as studied by (A), 19F NMR, and (B), 31P NMR.

A, 19F NMR followed the formation and decay of phospho-CheY by integrating the resonances that were adequately frequency shifted by phosphorylation (4F-Phe8, 4F-Phe53, 4F-Phe124 + 4F-Phe30). After normalization, the integrals of these resonances were averaged to yield the indicated curve. Also shown are the corresponding curves of several key mutants. The CheYK109R mutant has previously been shown (56) to dephosphorylate atan abnormally slow rate (upper curve). The CheYD57A and CheYK109Q mutants are negative controls which failed to be phosphorylated (lower curves). B, 31P NMR enabled simultaneous monitoring of the phosphodonor and final phospho-product generated by the reaction: acetyl phosphate (−2.2 ppm) and inorganic phosphate (+1.3 ppm), respectively. The relative amount of each component was quantitated by integration of its associated resonance, and plotted as shown against time. Reaction conditions were as described in the legend to Fig. 6.
Control experiments were performed to confirm that the new protein resonances generated by acetyl phosphate did indeed originate from CheY covalently phosphorylated at Asp57. Acetyl phosphate and carbamyl phosphate yielded the same 19F resonance frequency shifts (data not shown), supporting the interpretation that the perturbations were due to formation of a common phospho-CheY intermediate, rather than a noncovalent phosphodonor-CheY complex. Moreover, the CheYD57A mutant failed to hydrolyze acetyl phosphate, and yielded no frequency shifts when its 19F NMR spectrum was obtained in the presence of acetyl phosphate. Similarly, the CheYK109R mutant yielded a significantly slower decay rate for the phospho-CheY resonances, as expected from earlier radiolabeling results (56). (Another substitution at position 109 provided a novel insight into the activation site mechanism: the CheYK109Q mutant was phosphorylated by CheA, but failed to exhibit frequency shifts upon addition of acetyl phosphate, and did not hydrolyze this phosphodonor. Such results suggest that a side chain positive charge at position 109 is required for phosphorylation by acetyl phosphate.)
Conformational Effects of Phosphorylation
The structural changes triggered by phosphorylation of Asp57 were probed via an analysis of frequency shifts in the 19F NMR spectrum. To facilitate this analysis, the spectrum of a CheY and phospho-CheY mixture generated during an acetyl phosphate reaction was resolved into its two components by subtraction of the unphosphorylated component (Fig. 8). The 4F-Phe14 resonance was expected to exhibit a large frequency shift due to its proximity to the acylphosphate; therefore, this resonance was directly assigned by obtaining the spectrum of the phosphorylated CheYF14Y mutant (not shown). Comparison of the unphosphorylated and phospho-CheY spectra enabled straightforward assignment of remaining resonances (Fig. 6; see also Fig. 8).
Fig. 8. Comparing the 19F NMR spectra of CheY and phospho-CheY.
The spectrum of unphosphorylated CheY (upper) was obtained just prior to addition of acetyl phosphate, while the phospho-CheY spectrum (lower) was obtained by subtracting out the unphosphorylated component of the CheY/phospho-CheY mixture. This subtraction utilized the 10- and 50-min spectra illustrated in Fig. 6; reaction conditions were as described in the legend to Fig. 6.
Five of the six 4F-Phe resonances exhibited significant frequency shifts upon phosphorylation. It should be emphasized that these 19F frequency shifts cannot be converted to a spatial or electrostatic scale; however, they can be used to map the regions of the molecule involved in the structural change. The observed shifts included the 4F-Phe14 resonance from the vicinity of the acylphosphate (−0.4 ppm), and all four of the Phe cluster resonances, 4F-Phe8, 4F-Phe30, 4F-Phe53, and 4F-Phe124, (+0.3, −0.2, −0.4, and +0.8 ppm, respectively). The latter frequency shifts indicate that phosphorylation of Asp57 in the activation site generates an allosteric conformational change which travels to the opposite end of the molecule.
Of particular interest was the resonance of 4F-Phe111 which exhibited only a minor frequency shift (~ +0.2 ppm), fully attributable to the appearance of reaction products (Figs. 6 and 8). The absence of a significant perturbation at the 4F-Phe111 position suggests that Lys109, lying in van der Waals contact with this probe residue retains a conformation similar to that in the unphosphorylated protein. A model for the conformational change triggered by phosphorylation is presented in the following section.
DISCUSSION
Implications for the Unphosphorylated Conformation
The above 19F NMR results provide strong evidence that the Lys109 residue, proposed to act as a conformational switch during CheY activation, retains a similar position and conformation in the Mg(II) empty and Mg(II)occupied states of the unphosphorylated molecule. The crystal structure of the divalent metal ion-free unphosphorylated protein indicates that Lys109 forms a salt bridge with Asp57 in the absence of Mg(II). Thus the lack of a frequency change for the 4F-Phe111 19F NMR resonance upon Mg(II) binding suggests that the salt bridge remains intact in the Mg(II)-occupied conformer (for Structural precedence of a carboxylate bridging a Mg(II) and a Lys residue, see Refs. 17, 19, and 57); or that the salt bridge is broken without repositioning Lys109. As previously noted (60), the metal-induced conformational change appears localized primarily to the activation site, since large frequency shifts of the Phe cluster resonances are not generated by metal binding.
Implications for the Phosphorylated Conformation
The failure of phosphorylation of Asp57 to trigger a frequency shift for the 4F-Phe111 resonance suggests that the position and conformation of Lys109 is similar in the unphosphorylated and phosphorylated structures. Support for this model is provided by the engineered D57E substitution, characterized in the following article (10), which utilizes the longer glutamate side chain to provide a more distal location of the negative charge. Like phosphorylation, this mutation fails to produce a major frequency shift of the 4F-Phe111 resonance, consistent with the proposal that repositioning the negative charge of position 57 does not disturb Lys109 (Fig. 3 in Ref. 10). Thus, if Lys109 forms a salt bridge with the acylphosphate in the phosphorylated conformer, this salt bridge must not significantly reposition the Lys109 side chain. Further studies are needed to better define the nature of the electrostatic interaction between Lys109 and Asp57 in solution, including the effects of Mg(II) binding and phosphorylation on this interaction.
In other regions of the molecule, phosphorylation of Asp57 triggers a long range conformational change, extending from the 4F-Phe14 position to the 4F-Phe8, 4F-Phe30, 4F-Phe53, and 4F-Phe124 positions on the other end of the molecule. A simple conformational coupling mechanism is suggested by the protein structure: the signal could travel through the central β-sheet. In this case, the increased negative charge or bulk of the acylphosphate at Asp57 would repel the nearby carboxylates of Asp12 and 13, which would then drive a separation of strands β1 and β3 (Asp57= β3; Asp12 and 13 = loop β1-α1). The resulting structural change would be transmitted the entire length of the β-sheet to the Phe cluster.
The long range conformational change triggered by phosphorylation could have at least two important physiological roles. Such intramolecular communication could be used to regulate CheY at a site distant from its activation site. For example, phosphorylation could allosterically regulate CheY binding to CheA or the motor; or CheZ could allosterically regulate CheY autodephosphorylation by docking at such a site. In addition, such allostery could be used in two-domain response regulators, which comprise the majority of the response regulator family, to communicate activation from the regulatory domain, homologous to CheY, to the effector domain.
The widespread nature of the conformational change, however, complicates the identification of functionally important conformational features. The following article (10) further investigates the activation of CheY by specific mutations, in order to probe the component of the conformational change essential for motor docking and regulation. The results suggest that CheY activation proceeds in two conformational steps: the first triggered by phosphorylation, and the second triggered by docking to the motor.
Acknowledgments
We are indebted to Dr. Karl Volz (University of Illinois) for the generous gift of CheY coordinates prior to publication; to Drs. Rick Dahlquist, Phil Matsumura, Karl Volz, and Ann Stock for helpful discussions; and to Stephen Chervitz for comments on the manuscript.
Footnotes
The abbreviations used are: 4F-Phe, 4-fluorophenylalanine; 5F-Trp, 5-fluorotryptophan; PIPES, 1,4-piperazinediethanesulfonic acid.
This work was supported by National Institutes of Health Grants GM40731 (to J. J. F.) and AI19296 (to M. I. S.), and by National Research Service Award Fellowship AI07798 (to R. B. B.).
References
- 1.Bourret RB, Borkovich KA, Simon MI. Annu Rev Biochem. 1991;60:401–441. doi: 10.1146/annurev.bi.60.070191.002153. [DOI] [PubMed] [Google Scholar]
- 2.Stock JB, Surette MG, McCleary WR, Stock AM. J Biol Chem. 1992;267:19753–19756. [PubMed] [Google Scholar]
- 3.Parkinson JS, Kofoid EC. Annu Rev Genetics. 1992;26:71–112. doi: 10.1146/annurev.ge.26.120192.000443. [DOI] [PubMed] [Google Scholar]
- 4.Stock JB, Stock AM, Mottonen JM. Nature. 1990;344:395–400. doi: 10.1038/344395a0. [DOI] [PubMed] [Google Scholar]
- 5.Borkovich KA, Simon MI. Cell. 1990;63:1339–1348. doi: 10.1016/0092-8674(90)90429-i. [DOI] [PubMed] [Google Scholar]
- 6.Hess JF, Oosawa K, Kaplan N, Simon MI. Cell. 1988;53:79–87. doi: 10.1016/0092-8674(88)90489-8. [DOI] [PubMed] [Google Scholar]
- 7.Wylie D, Stock A, Wong C, Stock J. Biochem Biophys Res Commun. 1988;151:891–896. doi: 10.1016/s0006-291x(88)80365-6. [DOI] [PubMed] [Google Scholar]
- 8.Lukat GS, McCleary WR, Stock AM, Stock JB. Proc Natl Acad Sci U S A. 1992;89:718–722. doi: 10.1073/pnas.89.2.718. [DOI] [PMC free article] [PubMed] [Google Scholar]
- 9.Barak R, Eisenbach M. Biochemistry. 1992;31:1821–1826. doi: 10.1021/bi00121a034. [DOI] [PubMed] [Google Scholar]
- 10.Bourret RB, Drake SK, Chervitz SA, Simon MI, Falke JJ. J Biol Chem. 1993;268:13089–13096. [PMC free article] [PubMed] [Google Scholar]
- 11.Stock AM, Mottonen JM, Stock JB, Schutt CE. Nature. 1989;337:745–749. doi: 10.1038/337745a0. [DOI] [PubMed] [Google Scholar]
- 12.Volz K, Matsumura P. J Biol Chem. 1991;266:15511–15519. doi: 10.2210/pdb3chy/pdb. [DOI] [PubMed] [Google Scholar]
- 13.Stock JB, Lukat GS, Stock AM. Annu Rev Biophys Biophys Chem. 1991;20:109–136. doi: 10.1146/annurev.bb.20.060191.000545. [DOI] [PubMed] [Google Scholar]
- 14.Branden CI. Quart Rev Biophys. 1980;13:317–338. doi: 10.1017/s0033583500001712. [DOI] [PubMed] [Google Scholar]
- 15.Derbyshire V, Freemont PS, Sangrson MR, Beese L, Friedman JM, Joyce CM, Steitz TA. Science. 1988;240:199–204. doi: 10.1126/science.2832946. [DOI] [PubMed] [Google Scholar]
- 16.Ke H, Zhang Y, Lipscomb WN. Proc Natl Acad Sci U S A. 1990;87:5243–5247. doi: 10.1073/pnas.87.14.5243. [DOI] [PMC free article] [PubMed] [Google Scholar]
- 17.Knight S, Anderson I, Branden CI. J Mol Biol. 1990;215:113–160. doi: 10.1016/S0022-2836(05)80100-7. [DOI] [PubMed] [Google Scholar]
- 18.Davies JF, Hostomska Z, Hostomasky Z, Jordan SR, Matthews DA. Science. 1991;252:88–95. doi: 10.1126/science.1707186. [DOI] [PubMed] [Google Scholar]
- 19.Lebioda L, Stec B. Biochemistry. 1991;30:2817–2822. doi: 10.1021/bi00225a012. [DOI] [PubMed] [Google Scholar]
- 20.Katayangi K, Miyanawa M, Matsushima M, Ishikawa M, Kanaya S, Nakamura H, Ikehara M, Matsuzaki T, Morikawa K. J Mol Biol. 1992;223:1029–1052. doi: 10.1016/0022-2836(92)90260-q. [DOI] [PubMed] [Google Scholar]
- 21.Sanders DA, Gillece-Castro BL, Stock AM, Burlingame AL, Koshland DE., Jr J Biol Chem. 1989;264:21770–21778. [PubMed] [Google Scholar]
- 22.Lukat GS, Stock AM, Stock JB. Biochemistry. 1990;29:5436–5442. doi: 10.1021/bi00475a004. [DOI] [PubMed] [Google Scholar]
- 23.Milburn MV, Tong L, DeVos AM, Brunger A, Yamaizumi Z, Nishimura S, Kim S. Science. 1990;247:939–945. doi: 10.1126/science.2406906. [DOI] [PubMed] [Google Scholar]
- 24.Amstsr-Choder O, Wright A. Science. 1992;257:1395–1398. doi: 10.1126/science.1382312. [DOI] [PubMed] [Google Scholar]
- 25.Nakashima K, Kanamaru K, Aiba H, Mizuno T. J Biol Chem. 1991;266:10775–10780. [PubMed] [Google Scholar]
- 26.Bourret RB, Hess JF, Simon MI. Proc Natl Acad Sci U S A. 1990;87:41–45. doi: 10.1073/pnas.87.1.41. [DOI] [PMC free article] [PubMed] [Google Scholar]
- 27.Roman S, Meyers M, Volz K, Matsumura P. J Bacteriol. 1992;174:6247–6255. doi: 10.1128/jb.174.19.6247-6255.1992. [DOI] [PMC free article] [PubMed] [Google Scholar]
- 28.Sprang SR, Acharya KR, Goldsmith EJ, Stuart DI, Varvill K, Fletterick RJ, Madsen NB, Johnson LN. Nature. 1988;336:215–221. doi: 10.1038/336215a0. [DOI] [PubMed] [Google Scholar]
- 29.Browner MF, Fletterick RJ. Trends Biochem Sci. 1992;17:66–71. doi: 10.1016/0968-0004(92)90504-3. [DOI] [PubMed] [Google Scholar]
- 30.Hurley JH, Dean AM, Thorsness PE, Koshland DE, Jr, Stroud RM. J Biol Chem. 1990;265:3599–3602. doi: 10.2210/pdb4icd/pdb. [DOI] [PubMed] [Google Scholar]
- 31.Hurley JH, Dean AM, Sohl JL, Koshland DE, Jr, Stroud RM. Science. 1990;249:1012–1016. doi: 10.1126/science.2204109. [DOI] [PubMed] [Google Scholar]
- 32.Gammon KL, Smallcombe SH, Richards JH. J Am Chem Soc. 1972;94:4573–4580. doi: 10.1021/ja00768a027. [DOI] [PubMed] [Google Scholar]
- 33.Sykes BD, Wingarten HJ, Schlesinger M. Proc Natl Acad Sci U S A. 1974;71:469–473. doi: 10.1073/pnas.71.2.469. [DOI] [PMC free article] [PubMed] [Google Scholar]
- 34.Pratt EA, Ho C. Biochemistry. 1975;14:3035–3040. doi: 10.1021/bi00684a037. [DOI] [PubMed] [Google Scholar]
- 35.Lu P, Jarema MC, Mosar K, Daniel WE. Proc Natl Acad Sci U S A. 1976;73:3471–3475. doi: 10.1073/pnas.73.10.3471. [DOI] [PMC free article] [PubMed] [Google Scholar]
- 36.Post JFM, Cottam PF, Simplaceau V, Ho C. J Mol Biol. 1984;179:729–743. doi: 10.1016/0022-2836(84)90164-5. [DOI] [PubMed] [Google Scholar]
- 37.Wilson ML, Dahlquist FW. Biochemistry. 1985;24:1920–1928. doi: 10.1021/bi00329a018. [DOI] [PubMed] [Google Scholar]
- 38.Rule GS, Pratt EA, Simplaceanu V, Ho C. Biochemistry. 1987;26:549–556. doi: 10.1021/bi00376a029. [DOI] [PubMed] [Google Scholar]
- 39.Peersen OB, Pratt EA, Truong HTN, Ho C, Rule GS. Biochemistry. 1990;29:3256–3262. doi: 10.1021/bi00465a017. [DOI] [PubMed] [Google Scholar]
- 40.Luck LA, Falke JJ. Biochemistry. 1991;30:4248–4256. doi: 10.1021/bi00231a021. [DOI] [PMC free article] [PubMed] [Google Scholar]
- 41.Luck LA, Falke JJ. Biochemistry. 1991;30:4257–4261. doi: 10.1021/bi00231a022. [DOI] [PMC free article] [PubMed] [Google Scholar]
- 42.Gregory DH, Gerig JT. Biopolymers. 1991;31:845–858. doi: 10.1002/bip.360310705. [DOI] [PubMed] [Google Scholar]
- 43.Augspurger J, Pearson JG, Oldfield E, Dykstra CE, Park KD, Schwartz D. J Magn Res. 1993;100:342–357. [Google Scholar]
- 44.Matsumura P, Rydel JJ, Linzmeier R, Vacante D. J Bacteriol. 1984;160:36–41. doi: 10.1128/jb.160.1.36-41.1984. [DOI] [PMC free article] [PubMed] [Google Scholar]
- 45.Hess JF, Bourret RB, Simon MI. Methods Enzymol. 1991;200:188–204. doi: 10.1016/0076-6879(91)00139-n. [DOI] [PubMed] [Google Scholar]
- 46.Stoscheck CM. Methods Enzymol. 1990;182:50–68. doi: 10.1016/0076-6879(90)82008-p. [DOI] [PubMed] [Google Scholar]
- 47.Li E, Qian S, Yang NC, d’Avignon A, Gordon JI. J Biol Chem. 1990;265:11549–11554. [PubMed] [Google Scholar]
- 48.Sixl F, King RW, Bracken M, Feeny J. Biochem J. 1990;266:545–552. doi: 10.1042/bj2660545. [DOI] [PMC free article] [PubMed] [Google Scholar]
- 49.Pauling L. The Nature of the Chemical Bond and the Structure of Molecules and Crystals. Cornell University Press; Ithaca, NY: 1960. [Google Scholar]
- 50.Robertson DE, Kroon PA, Ho C. Biochemistry. 1977;16:1443–1451. doi: 10.1021/bi00626a032. [DOI] [PubMed] [Google Scholar]
- 51.Wacks DB, Schachman HK. J Biol Chem. 1985;260:11651–11658. [PubMed] [Google Scholar]
- 52.Kim HW, Perez JA, Ferguson SJ, Campbell ID. FEBS Lett. 1990;272:34–36. doi: 10.1016/0014-5793(90)80442-l. [DOI] [PubMed] [Google Scholar]
- 53.Li E, Qian S, Winter NS, d’Avignon A, Levin MS, Gordon JI. J Biol Chem. 1991;266:3622–3629. [PubMed] [Google Scholar]
- 54.Westhead EW, Boyer PD. Biochim Biophys Acta. 1961;54:145–156. doi: 10.1016/0006-3002(61)90947-7. [DOI] [PubMed] [Google Scholar]
- 55.Luck LA, Falke JJ. Biochemistry. 1991;30:6484–6490. doi: 10.1021/bi00240a019. [DOI] [PMC free article] [PubMed] [Google Scholar]
- 56.Lukat GS, Lee BH, Mottonen JM, Stock AM, Stock JB. J Biol Chem. 1991;266:8348–8354. [PubMed] [Google Scholar]
- 57.Lundqvist T, Schneider G. Biochemistry. 1991;30:904–908. doi: 10.1021/bi00218a004. [DOI] [PubMed] [Google Scholar]
- 58.Richards FM. Annu Rev Biophys Bioeng. 1977;6:151–176. doi: 10.1146/annurev.bb.06.060177.001055. [DOI] [PubMed] [Google Scholar]
- 59.Needham J, Chen T, Falke JJ. Biochemistry. 1993;32:3363–3367. doi: 10.1021/bi00064a020. [DOI] [PubMed] [Google Scholar]
- 60.Kar L, Matsumura P, Johnson ME. Biochem J. 1992;287:521–531. doi: 10.1042/bj2870521. [DOI] [PMC free article] [PubMed] [Google Scholar]
- 61.Ninfa AJ. Genet Eng. 1991;13:39–72. doi: 10.1007/978-1-4615-3760-1_2. [DOI] [PubMed] [Google Scholar]
- 62.Ninfa EG, Stock A, Mowbray S, Stock J. J Biol Chem. 1991;266:9764–9770. [PubMed] [Google Scholar]