

Abstract
The D-galactose chemosensory receptor of Escherichia coli is a 32 kDa globular protein possessing two distinct structural domains, each organized in an α/β folding motif. Helices I and X lie at adjacent approximately parallel positions on the surface of the N-terminal domain, near the hinge region. In order to analyze the relative thermal motions of these two helices, the present study utilizes a generalizable disulfide trapping approach: first, site-directed mutagenesis is used to place a pair of cysteine residues at locations of interest on the protein surface, then disulfide bond formation is used to trap intramolecular cysteine–cysteine collisions resulting from thermal motions. Specifically, four engineered di-cysteine receptors have been constructed, each possessing one cysteine at position 26 on helix I, and a second cysteine at varying positions on helix X. A fifth control receptor possesses one cysteine at position 26, and a second on the opposite surface of the molecule. These surface cysteine substitutions have little or no effect on the measurable receptor parameters as judged by ligand binding equilibria and kinetics, protein stability, and 19F nuclear magnetic resonance, indicating that the engineered receptors are useful probes of native backbone dynamics.
Spatial and kinetic features of backbone motions have been investigated by measuring intramolecular disulfide formation rates for cysteine pairs in the fully liganded receptor. The resulting rates decrease monotonically with increasing distance between cysteines in the crystal structure, while no disulfide formation is observed for the control pair unless the molecule is unfolded. The minimum translational amplitudes of the observed backbone motions range from 4·5 to 15·2 Å, and the minimum rotational amplitudes are as large as 35°. For each motion the rate of intramolecular sulfhydryl–sulfhydryl collision has been estimated from the measured rate of disulfide formation: the 4·5 and 15·2 Å translations yield ~ 104 and ~ 10 collisions s−1 molecule−1, respectively. These collision rates, which are faster than ligand dissociation, likely underestimate the actual motional frequencies since only an undetermined fraction of the total motions yield collisions. The simplest plausible trajectory capable of producing such collisions is a rate-limiting translation of one or both helices along their long axes, coupled with minor helix rotations. When sugar is removed from the receptor, a substantial increase in backbone dynamics is observed, indicating the presence of new long-range backbone trajectories. Overall, the results suggest that internal motions in proteins may have larger amplitudes than previously observed.
Keywords: molecular dynamics, protein engineering, disulfide bond, receptor, bacterial chemotaxis
1. Introduction
Thermal motions of the polypeptide backbone are required for conformational changes in proteins and are universal features of protein conformational dynamics (for a review, see Frauenfelder et al., 1991; McCammon & Harvey, 1987; Karplus, 1986; Lakowicz, 1986; Ringe & Petsko, 1986; Wagner & Wutrich, 1986). Yet much remains to be learned regarding the motions of secondary structural elements within the protein scaffold. The present study investigates the motions of α-helices on the surface of a globular protein.
Computational studies have suggested that significant thermal motions of surface α-helices occur even on the subnanosecond timescale. During such a motion the helix moves essentially as a rigid body, so that the fluctuations within the helix are observed to be small, typically well below 1 Å r.m.s.† deviation (1 Å = 0·1 nm; Ichiye & Karplus, 1991; Paulsen & Ornstein, 1991; Rojewska & Elber, 1990; MacKerell et al., 1989; Post et al., 1989; Elber & Karplus, 1987). In contrast, the net helix displacement can be much larger. For example, a 300 picosecond molecular dynamics simulation of myoglobin yielded rigid helix translations of 1 to 6 Å, angular fluctuations between helix pairs of 5 to 39°, and individual helix rotations of 9 to 21° (Elber & Karplus, 1987). A shorter 125 picosecond simulation of myhemerythrin, a four-helix bundle protein, revealed surface helix translations up to 2 Å, and fluctuations of inter-helix angles up to 8° (Rojewska & Elber, 1990). It should be noted that these in vacuo simulations may overestimate motional amplitudes up to twofold, since solvent could provide significant damping forces (Levitt, 1989). On the other hand, the subnanosecond time periods accessible to current simulations may not be long enough to detect the largest amplitude motions present in solution.
For longer timescales where binding, chemical transformations and protein stability are important, little is known about the spatial ranges and frequencies of helix and other secondary structure motions. Spectroscopically obtainable quantities, such as order parameters and anisotropy decay constants, provide important information about the angular range and frequency of some fluctuations. These quantities, however, generally provide no information regarding translational motions, and represent averages over a bulk population so that rare or uncorrelated events go undetected.
A previous study has shown that disulfide bond formation between pairs of cysteine residues can be used to trap backbone motions, suggesting a protein engineering approach to the analysis of backbone dynamics over a wide range of timescales (Falke & Koshland, 1987; Careaga & Falke, 1991, 1992). Other previous applications of disulfide technology include studies of protein folding, structure, stability and regulation (for example, see Weissman & Kim, 1991; Matsumura & Matthews, 1989; Falke et al., 1988; Perry & Wetzel, 1984; Creighton & Goldenberg, 1984; Villafranca et al., 1983). Thus far, however, disulfide trapping has not been used to probe the amplitude and frequency of motions in a folded protein of known structure. The D-galactose and D-glucose receptor of the Escherichia coli chemotaxis system is well suited as a model protein for such an investigation: the structure has been solved by Quiocho et al. to 1·9 Å resolution, and it contains no natural cysteine residues (Quiocho, 1990; Vyas et al., 1988, 1987; Quiocho et al., 1987). The structure, shown in Figure 1 as the α-carbon trace, consists of two globular α/β domains connected by a hinge, and contains two ligand binding sites: (1) the D-glucose-occupied sugar binding cleft between the two domains; and (2) a Ca(II)-occupied metal binding site in the C-terminal domain. 19F n.m.r. and X-ray low angle scattering studies have provided information regarding the structural changes that occur when the receptor is activated by sugar binding (Luck & Falke, 1991a,b,c; Newcomer et al., 1981). The cleft closes by an angle of ≥ 18°, triggering a global structural signal that alters large regions of both domains, thereby enabling the receptor to dock to the membrane proteins it activates. A better understanding of conformational dynamics in this chemosensory receptor will ultimately help elucidate the general relationships between receptor dynamics and function.
Figure 1.

(a) Stereoscopic van der Waals (VDW) surface of the E. coli D-galactose and D-glucose receptor (Vyas et al., 1987). α-Helices I and X are highlighted (cyan and red, respectively), as are the numbered positions of the engineered cysteine residues (yellow surfaces indicate β-carbons). One engineered cysteine, the control at position 182 on the opposite surface of the molecule, is not visible. Buried D-glucose is largely hidden (green, near center), (b) Ribbon backbone trace viewed from the same angle. The solid surfaces represent bound D-glucose and Ca(II) (cyan VDW), as well as the β-carbons of the 6 residues substituted with cysteine (red VDW), while the numbered dot surfaces indicate the 5 tryptophan residues (cyan VDW). (c) Expanded view of helices I and X, again showing the β-carbons of the cysteine-substituted side-chains (red VDW).
Two adjacent surface α-helices in the N-terminal domain are the focus of the present study: helices I and X (residues 17 to 31 and 259 to 274, respectively) are highlighted in Figure 1 along with the sites chosen for cysteine substitution. Both helices lie near the interdomain hinge, with helix X extending from the C-terminal end of one of the three hinge strands. Examination of the structure suggests that relative motions of helices I and X could be required for hinge flexibility. Using pairs of engineered cysteine residues to trap thermal motions, the present study examines the spatial range of relative helix I–X translations, as well as the relationship between motional amplitude and receptor reveal large thermal fluctuations involving one or both helices, with rates that decay monotonically with increasing spatial range. As expected, both the rates and spatial ranges of thermal motions increase in the sugar-empty conformer. Overall the results illustrate the utility of disulfide bond formation in studies of protein conformational dynamics.
2. Experimental Procedures
(a) Cloning and mutagenesis
Engineered receptors were constructed and expressed using phagemid pSF5, a construct containing the natural E. coli promoter and gene for the D-galactose and D-glucose receptor as described (Luck & Falke, 1991a). The 5 di-cysteine-substituted receptors were generated by oligonucleotide-directed mutagenesis using single-stranded pSF5 template DNA and the uracil selection method of Kunkel (Kunkel et al., 1988; reagents from BioRad Laboratories). Mutagenic oligonucleotides, each 19 bases in length, were synthesized on an Applied Biosystems DNA synthesizer, purified by polyacrylamide gel electrophoresis, then kinased. Two mutagenic oligonucleotides, one for each mutant cysteine codon, were annealed to the single-stranded template and elongated simultaneously. Following transformation and plasmid isolation, successfully altered genes were identified by dideoxy plasmid DNA sequencing (Sanger et al., 1977) using Sequenase sequencing reagents (United States Biochemical), and 32P end-labeled primer oligos ([γ-32P]ATP from Amersham).
(b) Isolation of receptor protein
Wild-type and di-cysteine mutant receptors were expressed by pSF5 overproduction in E. coli NM303 (F+ mgl503 lacZ lacY+ recA1), a mutant strain that makes no endogenous receptor (Muller et al., 1985). Cells were grown for 12 to 18 h at 37°C in tryptone broth (Miller, 1972) containing 25 μg ampicillin/ml and 1 mM-α-D-(+) fucose (Scholle et al., 1987). Bacterial cells were harvested by centrifugation, and receptor was released from the periplasmic space by standard osmotic lysis procedures (Heppel, 1971; Kellerman & Ferenci, 1982; Luck & Falke, 1991a). All subsequent isolation procedures were carried out at 0 to 4 °C. The supernatant containing ≥90% receptor was concentrated by ultrafiltration using an Amicon Stirred Cell apparatus and YM-10 membranes to a final concentration of 50 to 100 μM The resulting material was then dialyzed against four changes of 50 volumes of final buffer: 20 mM-NaH2PO4, 5·0 mM-dithioerythritol (DTE), 2·5 mM-EDTA, 50 mM-KCl, 50 mM-NaCl, 1·0 mM-D-glucose, 0·2 mM-CaCl2 (pH 7·0 with NaOH). All dialysis steps were at 4°C for ≥6h. The presence of engineered cysteine in each receptor was verified by removing the reducing agent and labeling with fluorescein maleimide or fluorescein iodoacetamide (Molecular Probes), followed by SDS/polyacrylamide gel electrophoresis and visualization of the fluorescent band by irradiation with an ultraviolet transilluminator (λmax = 312 nm). Protein concentration was determined by absorbance using the extinction coefficient derived from the amino acid composition (ε280 = 42,850 M−1 cm−1; Gill & von Hippel, 1989). Di-cysteine receptors were stored up to one week at 4°C; for long term storage receptors were frozen in liquid nitrogen and stored at −70°C.
To obtain sugar-free receptor 2 methods were used. The first method was to partially unfold receptor by dialysis against 2 changes of 35 volumes of unfolding buffer (Miller et al., 1983; Falke & Luck, 1991a); 10 mM-Tris, 3 M-guanidine HCl, 100 mM-KCl, 20 mM-EDTA, 50 mM-dithiothreitol (pH 7·0 with HCl). This step was followed by dialysis against 4 changes of 50 volumes of refolding buffer: 10 mM-Pipes, 100 mM-KCl, 5·0 mM-DTE, 0·2 mM-CaCl2 (pH 7·0 with NaOH), then 3 changes of 30 volumes of sugar-free final buffer. The second method was simply to dialyze the crude preparation against 6 changes of 170 volumes of sugar-free final buffer, after which sugar removal was verified by a fluorescence sugar binding assay (below).
(c) Disulfide bond formation and quantitation
Thermal fluctuations in the receptor structure were trapped by disulfide bond formation as follows. Di-cysteine receptor was brought to 2 to 4 μm in reaction buffer: 20 mM-NaH2PO4, 50 mM-KCl, 50 mM-NaCl, 0·2 mM-CaCl2 (to maintain saturation of the Ca(II) site), 1·0 mM-D-glucose (where indicated to maintain saturation of the sugar binding site), 1·0 mM-NaAsO2 (to complex residual DTE; Zahler & Cleland, 1968) (pH 7·0 with NaOH). The oxidative disulfide formation reaction, using ambient dissolved oxygen as the oxidant (190 μM), was triggered by the addition of the redox catalyst Cu(II)(1,10-phenanthroline)3 (Kobashi, 1968) to 1·5 mm final concentration. The Cu(II)(1,10-phenanthroline)3 stock was 150 mM-Cu(II)SO4 and 500 mM-1,10-phenanthroline in 4:1 water/ethanol before it was diluted 100-fold into the sample. Essentially all of the disulfide bonds observed in the product were intramolecular and formed during the catalyzed reaction, since disulfide formation was negligible prior to addition of catalyst, and the relative low receptor concentration prevented intermolecular disulfide formation.
At appropriate timepoints, portions were removed for analysis then immediately mixed and heated to 95°C for 1 min with an equal volume of 2× quench buffer: 40 mM-N-ethylmaleimide to block unreacted thiols, 200 mM-EDTA to chelate Cu(II) ion, 2 mM-NaAsO2 to complex residual DTE, 130 mM-Tris (pH 6·8 with HCl), 20% (v/v) glycerol, 4% (w/v) SDS, 0·05% (w/v) bromphenol blue. Subsequently the products were resolved by SDS/polyacrylamide gel electrophoresis. The separating gel was as follows: 15% (w/v) acrylamide, 0·075 (w/v) bisacrylamide, 3·6 M-urea and 10% (v/v) glycerol, and a discontinuous buffer system (Laemmli, 1970). Gels were stained with Coomassie blue R-250 (BioRad Laboratories), and bands were quantified on an LKB model 2222-010 UltroScan XL laser densitometer.
Receptors containing an intramolecular disulfide mobilities than those lacking a disulfide, which comigrated with the wild-type receptor. One receptor (26,274) yielded an easily identified slowly migrating dimer linked by an intermolecular disulfide. Appropriate controls indicated that the quench and electrophoresis conditions prevented both the formation of new disulfides, and the reduction of existing disulfides. In all cases, addition of excess dithiothreitol with reheating to 95°C for 3 min was observed to quantitatively restore wild-type mobility to disulfide-containing products.
Non-linear least-squares analyses of the disulfide formation timecourse yielded the rate constant kss for disulfide formation, as well as k2 for the competing sulfhydryl oxidation reaction, as described in Results. It was necessary to correct each timecourse for a minor fraction of the receptor population, present before the disulfide reaction was triggered, which contained modified cysteine residues incapable of disulfide formation. This correction was determined as described in the following section.
(d) Quantification of reactions competing with disulfide formation
During isolation and storage of di-cysteine receptors, cysteine residues were kept in sulfhydryl form by the presence of DTE as a reducing agent, and EDTA to complex catalytic metals. Despite these precautions, 5 to 10% of the receptor sulfhydryls were observed to be blocked toward disulfide formation by oxidation or other modification even before addition of redox catalyst. The fraction of receptors containing one or more blocked sulfhydryls was quantified as follows. Each di-cysteine receptor (2 to 4 μM) was unfolded by incubating for 1 min in reaction buffer containing 8 M-urea equilibrated to 37°C. Disulfide formation was initiated by addition of 1·5 mM-Cu(II)(1,10-phenanthroline)3 and the reaction was continued at 37°C for 15 min, then quenched and quantified as usual. These reaction conditions yielded maximal disulfide formation within 15 s of initiation, thereby eliminating the contribution of the slower sulfhydryl oxidation reaction, which gave negligible product on this timescale. The blocked fraction of the receptor population was calculated as the ratio of disulfide-lacking receptor to total receptor, enabling subtraction of the blocked population from the disulfide formation timecourses described in the previous section. The resulting corrected timecourses included only those receptors capable of forming disulfides when the reaction was initiated.
When the slower disulfide formation timecourses of the folded receptors were measured, a slow competing sulfhydryl oxidation reaction was observed after addition of redox catalyst. The rate constant k2 for this competing reaction was determined from best fit of the disulfide reaction timecourse (see above and Results), and was also measured directly by the following independent approach. First the disulfide reaction was initiated, then at appropriate intervals a portion was removed and the remaining sulfhydryl pairs driven to disulfide formation by immediate mixing with solid urea (final concn 8 M) and additional catalyst (final 1·5 mM). After incubation at 37°C for 15 min. the reaction was quenched and quantified as usual. For each timepoint the fraction of blocked sulfhydryls was calculated as the ratio of products lacking intramolecular disulfide bond to total products. The resulting timecourse was best fit by non-linear least-squares to a pseudo-first-order reaction:
| (1) |
where FB is the fraction of blocked sulfhydryls and k2 is the rate constant of sulfhydryl blocking.
(e) Determining the efficiency factor for disulfide trapping
In order to estimate the fraction of sulfhydryl–sulfhydryl collisions that were successfully trapped by disulfide formation, a model reaction was carried out for free cysteine in solution. The standard conditions used in the protein reactions yielded free cystine formation rates too fast to measure, so the pH was lowered to values of pH4·0, 5·0, 5·5 and 6·0 with HCl. The resulting rate constants were used to extrapolate the rate constant to pH 7·0 where the protein reactions were carried out. Experimental conditions were chosen to approximate the protein reactions: 20 mM-NaH2PO4 (initially pH 7·0 with NaOH), 50 mM-KCl, 50 mM-NaCl, 0·1 mM-EDTA, 15 μM-[35S]cysteine (Amersham). Cysteine samples were equilibrated to 37°C, then the reaction was initiated by addition of 1·5 mM-Cu(II)(1,10-phenanthroline)3. Portions were removed between 1 and 30 min and were quenched by first adding N-ethylmaleimide to 1·0 M, with vortexing, followed by immediate addition of 90 mM-EDTA (pH 8 with NaOH), yielding a final pH of 7·8 to 8·0.
Quenched samples, 8 μl each, were dotted onto TLC plates (pre-coated silica gel, Kieselgel 60 F-254, 0·2 mm thickness) and developed 4 to 5 h in 88% phenol/glacial acetic acid/water (15:1:4, by vol.) to separate radioactive cysteine and cystine. The plates were dried, exposed 12 to 16 h and quantified via autoradiography (Molecular Dynamics PhosphorImager, ImageQuant software).
Finally the efficiency factor was determined as the ratio of the free cysteine disulfide formation rate (kss ~ 7 × 10⁴ M−1 s−1) to the calculated collision rate (kc = 7 × 10⁹ M−1 s−1). The latter rate was obtained from the diffusion constant for cysteine at 37°C (D = 8·4 × 10−6 cm2 s−1) assuming neutral spherical colliders (Steinfeld et al., 1989). The resulting efficiency factor (σ ~ 1 × 10⁻⁵) indicates that for the relevant reaction conditions, approximately 1 in 105 of the cysteine–cysteine collisions are trapped by disulfide bond formation.
(f) Reaction of engineered sulfhydryls with iodoacetamide
Reaction rates of the engineered sulfhydryls with iodoacetamide were determined to compare the intrinsic chemical reactivites of the different engineered cysteines. The mono-cysteine receptor Q26C and each of the di-cysteine receptors were used to generate a reaction timecourse in solutions containing: 5 μM-receptor, 100 μM-[14C]iodoacetamide (Amersham), 20 mM-NaH2PO4, 50mM-NaCl, 50 mM-KCl, 0·2 mM-CaCl2, 1·0 mM-D-glucose, 0·1 mM-EDTA (pH 7·0 with NaOH, 37°C). Timecourses were initiated by addition of iodoacetamide, portions were removed between zero and 1 h, and samples quenched with 60 mM-2-mercaptoethanol. The proteins were then quantitatively precipitated by the addition of 13% trichloroacetic acid, isolated by pelleting 15 min at 22,000 g, 25°C, then resuspended in Laemmli SDS/polyacrylamide gel sample buffer, heated to 95°C for 3 min, and run on Laemmli SDS/15% polyacrylamide gels. Dried gels were then phosphorimaged to quantify the radiolabeling timecourse, and the rate constant of labeling was determined by non-linear least-squares best fit to a pseudo-first-order reaction, as indicated by eqn (1) above.
(g) Measurement of galactose binding
To test the structural integrity of the sugar binding site in the engineered receptors, the equilibrium binding constant for D-galactose was determined and compared to that of the wild-type receptor. Sugar binding was measured by titrating 0·15 μM-receptor with D-galactose and monitoring the resulting increase in tryptophan fluorescence (Boos et al., 1972). For these experiments the sugar-free protein preparation was dialyzed into fluorescence buffer: 10 mM-Tris, 150 mM-NaCl, 0·1 mM-CaCl2, 5 mM-dithiothreitol (pH 7·0 with HCl). Measurements were carried out at 25 °C on a SLM 48000 spectrofluorimeter (λex = 285 nm, λem = 338 nm, bandwidths = 4 nm). The dissociation constant for D-galactose was determined by non-linear least-squares best fit of the data to a homogeneous independent site model:
| (2) |
where I is the observed receptor fluorescence intensity, I0 is the fluorescence intensity before addition of substrate, IΔ is the fluorescence change induced by saturating substrate, S is the concentration of free D-galactose, and KD is the D-galactose dissociation constant.
(h) Measurement of terbium dissociation
To test the integrity of the Ca(II) binding site, the kinetics of Tb(III) dissociation from the Ca(II) site were measured. Metal free receptor was prepared by dialyzing the receptor in unfolding buffer (above) against 4 changes of 50 volumes of metal chelating buffer: 10 mM-Pipes, 20 mM-EDTA, 100 mM-KCl (Ca(II)-free, Orion Research), 5 mM-dithiothreitol (pH 7·0 with NaOH). This was followed by 3 changes of 50 volumes of Tb(III) assay buffer: 10 mM-Pipes, 100 mM-KCl, 5 mM-dithiothreitol, ±1·0 mM-D-glucose (pH 6·0 with NaOH). Receptor at 2·5 μM was allowed to equilibrate with 25 μM-Tb(III) overnight at 25 °C. The bound Tb(III) was selectively excited by energy transfer from nearby tryptophan 127 as described (Vyas et al., 1989; Snyder et al., 1990). While monitoring the resulting bound Tb(III) phosphorescence, 0·2 mM-EDTA was added to trigger the dissociation time-course by chelating free Tb(III); the time course was quantified as the loss of bound Tb(III) phosphorescence (λex = 292 nm, λem = 543 nm, bandwidths = 4 nm). Data were fit to an equation describing a first order dissociation reaction:
| (3) |
where I is the observed bound Tb(III) emission, I0 is the bound Tb(III) emission before addition of EDTA, and kd is the rate constant for Tb(III) dissociation from the Ca(II) site.
(i) Determination of conformational stability
As a test of the overall stability of the engineered receptors, the free energy of unfolding was determined by urea titration. Receptors at 2·0 μM concentration were equilibrated at 27(±2)°C for 48 h in final buffer containing 5 mM DTE, ±1·0 mM-D-glucose, and 0 to 8 M-urea (pH 7·0 with HCl). Subsequently the decrease in intrinsic tryptophan fluorescence upon protein unfolding was measured (λex. = 278 nm, λem = 330 nm, bandwidths = 4 nm). The data were corrected for a minor dependence of the intrinsic tryptophan quantum yield on urea concentration, then were analyzed in terms of a 2-state unfolding model using the linear free energy approximation (Pace, 1986):
| (4) |
where ΔGD is the free energy of denaturation at a given urea concentration U, and m is a proportionality constant. This model yields the following denaturation equation that was best-fit, by non-linear least-squares analysis, to the experimental curves:
| (5) |
where I is the observed total fluorescence, Pt is the protein concentration, IN and ID are the specific fluorescences of the native and denatured proteins, and K0 is the equilibrium constant for unfolding extrapolated to zero urea. For the best fit analysis, the parameters IN, ID, m and K0 were each independently optimized, holding one or more of the others fixed, until the standard error values for each parameter were minimized. The final fit allowed all optimized parameters to vary. The free energy of unfolding in the absence of urea was then calculated as .
(j) 19F n.m.r. spectra
To probe the structural integrity of the engineered proteins at the 5 tryptophan positions in the receptor, 5-fluorotryptophan-labeled receptors were isolated for 19F n.m.r. as described (Luck & Falke, 1991a). Briefly, receptors were labeled by over-expression in E. coli W3110trp A33, a tryptophan auxotroph, in growth media supplemented with a 1:4 ratio of tryptophan to 5-fluorotryptophan, as described for mutant receptor expression (Luck & Falke, 1991a). Standard procedures described above were used to isolate the labeled receptors. 19F n.m.r. spectra were obtained at 470 MHz on a Varian VXR 500 spectrometer using a 5 mm 1H/19F probe. Samples contained 100 to 500 μM-receptor in final buffer (or reaction buffer for the Cu(II)(1,10-phenanthroline)3 control experiment) as well as 10% 2H2O as the lock solvent, and 75 μM-3-fluorophenylalanine as an internal frequency standard. Spectral parameters were 12,000 Hz spectral width, 20,000 data points, 60° pulsewidth, 0·68 s acquisition time, 1·0 s relaxation delay, 25°C.
Dynamic features of the labeled wild-type and Q26C/D274C receptors were compared by measuring the spin lattice relaxation rate of each fluorine resonance in samples identical to those above. T1 relaxation times were obtained using the 180° – τ – 90° inversion recovery pulse sequence, with a 6·0 s relaxation delay.
(k) Statistics
Errors are reported as standard deviations, determined from non-linear least-squares regression of a representative data set.
3. Results
(a) Detection of protein backbone motions by disulfide bond formation: general approach
Our application of disulfide chemistry to the study of protein backbone motions utilized the following general approach. First, proteins containing pairs of engineered cysteine residues at varying distances were constructed by site-directed mutagenesis. Each engineered di-cysteine protein was subsequently isolated, then tested for native structure and activity before being used to detect backbone motions via disulfide bond formation. For each cysteine pair the intrinsic chemical reactivity was ascertained, and the rate of disulfide bond formation was measured. When a backbone motion was revealed by disulfide trapping, its spatial scale was investigated using the wild-type crystal structure to deduce the translational and rotational motions needed for sulfhydryl–sulfhydryl contact; such spatial information provided the amplitude of the observed motion. Finally, using the known efficiency of the disulfide trapping reaction, the disulfide formation rate was converted to the sulfhydryl–sulfhydryl collision rate, thereby revealing the approximate timescale of the observed motion.
(b) Choice of positions for cysteine substitution
Positions for cysteine substitution in helices I and X of the D-galactose and D-glucose receptor were chosen to satisfy three criteria: (1) to minimize the effects of substitutions on receptor structure and dynamics; (2) to maximize the accessibility and reactivity of the engineered sulfhydryls; and (3) to provide pairs of sulfhydryls at the locations needed to map out the relative helix motions of interest.
These criteria were met by placing the engineered cysteine residues on the surface of the receptor, at positions unconserved in the primary structure of related prokaryotic receptors (Scholle et al., 1987; Argos et al., 1981). The solvent exposures of candidate positions were approximated from the native side-chain to its β-carbon and measuring the solvent-accessible surface area of this atom (Richards, 1977). Each of the chosen positions was significantly solvent exposed, although the 267 position was up to threefold more buried than the others. Using these positions, 26 on the surface of helix I, and a second cysteine was placed at position 182 on the opposite surface of the molecule. The distance between each cysteine pair , measured as the distance between β-carbons in the wild-type crystal structure, ranged from 9·1 to 27·8 Å, as defined in Figure 2 and summarized in Table 1.
Figure 2.

Geometric parameters for 2 cysteine residues forming a disulfide bond, focusing on the Cα–Cβ bonds of cysteine residues i and j. It is convenient to define a pseudo-bond between the β-carbons (upper). The resulting pseudo-bond length , pseudo-dihedral angle , and pseudo-bond angles θij and θji are used to determine whether the residues have a relative geometry suitable for disulfide formation (Balaji et al., 1989).
Table 1.
Positions chosen for cysteine substitution
| Receptor | † (Å) | Cβ solvent-accessible surface area‡ (Å2) |
|---|---|---|
| Q26C | — | 47 |
| Q26C/K263C | 9·1 | 47/42 |
| Q26C/N260C | 12·9 | 47/31 |
| Q26C/D267C | 13·2 | 47/14 |
| Q26C/D274C | 19·8 | 47/46 |
| Q26C/M182C | 27·8 | 47/37 |
Indicated parameters were measured using the 1·9 Å resolution crystal structure of the wild-type receptor (Vyas et al., 1987).
Distance between the β-carbons of the substituted positions.
For each substituted position the solvent-accessible surface area of the β-carbon was determined after removing both the distal atoms of the side-chain and the crystallographic water molecules. Probe radius was 1·4 Å and slab thickness was 0·10 Å (Richards, 1977).
(C) Production and analysis of engineered receptors
The designed receptors were constructed by oligonucleotide-directed mutagenesis and isolated by standard procedures. In order to quantitatively test the effects of cysteine substitution on receptor structure and activity, four properties of the engineered receptors, each in reduced form, were measured: (1) the dissociation constant (KD) for D-galactose; (2) the off-rate constant (kd) for Tb(III); (3) the free energy of unfolding ( ) by urea titration; and (4) the 19F n.m.r. spectrum of the 5-fluorotryptophan-labeled receptor. Each measurement is illustrated in Figure 3 for the wild-type and Q26C/D274C di-cysteine receptors (the latter chosen because it reveals a large backbone motion described below). Tables 2 and 3 summarize the measured properties of all the wild-type and engineered receptors, discussed in detail as follows.
Figure 3.

Comparison of the wild-type (●) and Q26C/D274C receptors (○), the latter always in reduced form. (a) D-Galactose binding to the Ca(II)-occupied receptor, assayed by an increase in the intrinsic tryptophan fluorescence. (b) Timecourse of Tb(III) dissociation from the Ca(II) binding site of the D-glucose occupied receptor, following the addition of excess EDTA. Bound Tb(III) was assayed by its phosphorescence following energy transfer from nearby tryptophan 127. (c) Urea denaturation of receptor containing bound D-glucose and Ca(II), assayed by a decrease in the intrinsic tryptophan fluorescence. (d) 19F n.m.r. spectra of the 5-fluorotryptophan-labeled receptor containing bound D-glucose and Ca(II). As previously noted, the W127 and W133 resonances detect 2 stable conformers in their local environment. The ratio of these conformers varies for different preparations (Falke & Luck, 1991a,b), as observed here. For (a) to (c) the best fit parameters (D-galactose KD, Tb(III) kd, and , respectively) were determined by non-linear least-squares regression and are summarized in Table 2. For (d) the resonance frequencies are summarized in Table 3. See Experimental Procedures for further details. WT, wild-type; p.p.m., parts per million.
Table 2.
Effect of cysteine substitutions on substrate binding and protein stability
| Receptor | D-Galactose KD† (μM) | Tb(III) kd‡ |
Urea denaturation
§ |
||
|---|---|---|---|---|---|
| (+) D-Glucose | (−) D-Glucose | (+) D-Glucose | (−) D-Glucose | ||
| (× 10−3 s−1 molecule−1) | (kcal mol−1) | ||||
| WT | 0·3 ± 0·1 | 2·7 ± 0·1 | 5·7 ± 0·2 | 7·3 ± 0·4 | 7±1 |
| Q26C/K263C | 0·3 ± 0·1 | 2·7 ± 0·2 | 5·7 ± 0·1 | 6±1 | 6±1 |
| Q26C/N260C | 0·4 ± 0·1 | 2·7 ± 0·2 | 5·5 ± 0·1 | 6·6 ± 0·5 | 7±4 |
| Q26C/D267C | 0·4 ± 0·1 | 2·2 ± 0·2|| | 6·0 ± 0·3 | 6±1 | 7±2 |
| Q26C/D274C | 0·3 ±0·1 | 2·7 ±0·1 | 5·7 ± 0·2 | 7·3 ± 0·5 | 7±1 |
| Q26C/M182C | 0·5 ± 0·1 | 2·7 ± 0·2 | 5·7±0·2 | 7·0 ± 0·4 | 7±2 |
Non-linear least-squares best fit parameters measured under reducing conditions, as illustrated in Fig. 3(a) to (c). See Experimental Procedures for further details.
Dissociation constant for the D-galactose binding equilibrium, 25°C.
Rate constant for Tb(III) dissociation, 25°C.
Free energy of receptor denaturation extrapolated to zero urea concentration, 27°C.
Value lies outside error range of wild-type (WT) parameter.
Table 3.
Effect of cysteine substitutions on 5-fluorotryptophan 19F n.m.r. resonances
| Receptor |
19F n.m.r. chemical shift (±0·1 p.p.m.) |
||||||
|---|---|---|---|---|---|---|---|
| W127 |
W133 |
W183 | W195 | W284 | |||
| † | ‡ | † | ‡ | ||||
| WT¶ | −46·2 | −46·3 | −51·4 | −52·0 | −43·0 | −48·5 | −52·7 |
| Q26C/N260C | −46·2 | −46·4 | −51·4 | −52·0 | −42·9 | −48·5 | −52·3|| |
| Q26C/K263C | −46·2 | −46·4 | −51·4 | −52·0 | −43·0 | −48·5 | −52·7 |
| Q26C/D267C | −46·2 | −48·5|| | −51·4 | −52·0 | −43·0 | −48·5 | −51·0|| |
| Q26C/D274C¶ | −46·2 | −46·3 | −51·4 | −52·0 | −43·0 | −48·5 | −52·7 |
| Q26C/M182C | −45·9|| | −46·2 | −51·3 | −52·0 | −43·1 (−47·2)§|| | −48·5 | −52·7 |
19F n.m.r. spectra of the 5-fluorotryptophan-labeled receptors containing bound D-glucose and Ca(II) were obtained under reducing conditions at 25°C, as illustrated in Fig. 3(d). See Experimental Procedures for further details.
Residues W127 and W133, which are in van der Waals contact, detect 2 stable conformers of their local environment, as described (Luck & Falke, 1991a,b).
The Q26C/M182C receptor gave rise to 2 W183 resonances, one at the native frequency (40% population), and one at a new frequency (60% population). Thus, an alternative conformer is stabilized by the M182C substitution.
Chemical shift lies outside the error range of the wild-type (WT) value.
Spin lattice relaxations times (T1) were determined for each resonance in the WT and Q26C/D274C receptors respectively: W183 0·7, 0·7; W127a 0·9, 0·9; W195 0·9, 0·9; W133a 1·0, 1·0; W133b 0·9, 1·0; and W284 1·2, 1·2. The indicated values are ± <0·1 s. The T1 of 3-fluorophenylalanine, the internal frequency standard was 1·5(±0·1) s.
The equilibrium binding of D-galactose to the receptors was quantified by monitoring an increase in intrinsic tryptophan fluorescence, as described (Boos et al., 1972). When the D-galactose dissociation constants of the wild-type and engineered proteins were compared, no significant differences were observed, indicating that the di-cysteine substitutions had no large allosteric effects on the structure of the sugar binding site (Table 2).
The dissociation timecourse of metal ion from the Ca(II) site was measured for the lanthanide substrate Tb(III). Bound Tb(III) was assayed by its phosphorescence following energy transfer from nearby tryptophan 127, as described (Snyder et al., 1990). Within error, the cysteine substitutions had no effect on the dissociation rate, with the exception of Q26C/D267C (+)D-glucose (Table 2). Even for this receptor, Tb(III) dissociation was slowed by less than 20%, suggesting that allosteric perturbation of the Ca(II) binding loop was minor.
The effect of cysteine substitution on the overall stability of the receptor was investigated by urea titration, using a decrease in the intrinsic tryptophan fluorescence to quantify protein unfolding. The resulting denaturation curves provided the free energy of receptor unfolding in the absence of urea, , via a non-linear least-squares best fit to a two-state unfolding model (Pace, 1986). The similar values in the absence and presence of D-glucose suggest that dissociation of sugar occurs before unfolding, such that the two states monitored by the fluorescence change are a folded and unfolded conformer of the sugar-empty protein. The effects of cysteine substitution on were all within the experimental error of 1 kcal mol−1 (1 cal = 4·184 J), indicating that each of the engineered receptors retained essentially native stability.
The structures of the engineered proteins were also monitored by 19F n.m.r. studies of the 5-fluoro-tryptophan-labeled receptors. This technique has provided a highly sensitive probe for local structural changes in the vicinity of the five tryptophan positions (Luck & Falke, 1991a,b,c). One tryptophan position, W284, lies in van der Waals contact with helix X, including the side-chains of substitution positions 260, 263 and 267. Other tryptophan residues of note were W183 in the sugar binding cleft, which is covalently bonded to substitution position 182; and W127 within 4·5 Å of the Ca(II) binding site. A total of seven 19F n.m.r. resonances were monitored for each of the five engineered receptors. Overall, 30 of the 35 resonances were unperturbed by the cysteine substitutions, while the remaining five exhibited altered n.m.r. frequencies as summarized in Table 3. The indicated frequency shifts were observed to fall into two distinct categories: contact and allosteric perturbations. Contact perturbations involved residues in direct van der Waals or bonded contact with a tryptophan, and were detected for the N260C, D267C and M182C substitutions (Table 3). Such local perturbations may involve only side-chain interactions and thus do not identify changes in backbone structure. The N260C substitution, for example, caused no detectable allosteric effects at distant tryptophan positions, nor perturbations of other receptor properties (Tables 2 and 3), indicating that it did not significantly alter the backbone. In contrast, small backbone perturbations may have resulted from the D267C and M182C substitutions, which each generated allosteric shifts at the distant Ca(II) site, as indicated by frequency shifts of the W127 resonance (Table 3). However, only the D267C substitution also caused a detectable change in the metal ion dissociation rate (Table 2).
Additional 19F n.m.r. experiments compared the dynamic features of the wild-type and Q26C/D274C receptors by measuring the spin lattice relaxation rate of each protein resonance. The resulting T1 relaxation times, which are sensitive to local motions in the vicinity of each fluorine nucleus, were unchanged by the incorporation of cysteine (see the legend to Table 3).
Altogether, with the possible exception of the D267C substitution, the galactose binding, Tb(III) dissociation, urea denaturation, and 19F n.m.r. results revealed that the cysteine substitutions had little or no effect on parameters sensitive to receptor structure and dynamics (Tables 2 and 3). It follows that the engineered proteins were useful probes of native backbone motions. This is in agreement with previous studies in which substitution of surface residues caused negligible changes in protein structure and function (Wells, 1991; Vaniwaarden et al., 1991; Bowie et al., 1990), as well as studies in which cysteine residues have been successfully substituted for a number of amino acids (Planas & Kirsch, 1991; Vaniwaarden et al., 1991; Lyons et al., 1990; Altenbach et al., 1990; Todd et al., 1989; Falke et al., 1988: Pin et al., 1987: Falke & Koshland, 1987). The minor perturbations generated by the D267C substitution may stem from the fact that it was the most buried of the chosen substitutions (Table 1), or from its involvement in a potential K263–D267 salt bridge (Vyas et al., 1987). Yet even this substitution left many receptor parameters unchanged (Tables 2 and 3).
(d) The chemistry of disulfide bond formation
In order to trap and detect backbone motions with the di-cysteine-engineered receptors, a chemical oxidation system was used to drive disulfide bond formation. The oxidative system chosen, which consisted of ambient dissolved dioxygen as the oxidant and Cu(II)(1,10-phenanthroline)3 as a redox catalyst (Kobashi, 1968), was well suited to the present application for the following reasons. (1) Oxidation of sulfhydryls to disulfides by dioxygen is negligible in the absence of catalyst, thus the reaction timecourses were easily triggered by catalyst addition, and were rapidly quenched by the addition of excess N-ethylmaleimide to block free sulfhydryls in combination with EDTA to chelate Cu(II). (2) The oxygen/Cu(II)(1,10-phenanthroline)3 system is thought to oxidize by generation of an oxyradical (hydroxyl radical or superoxide anion), which diffuses to the vicinity of a sulfhydryl and removes an electron, yielding a sulfur radical capable of disulfide formation upon collision with a second thiol or sulfur radical (Oae, 1991; Snyder, 1987; Bull et al., 1983; Cecil & McPhee, 1959). This scheme avoids modification of the reacting sulfhydryls with a covalent intermediate, such as those formed in disulfide exchange reactions, which might perturb backbone dynamics. (3) Finally, the Cu(II)(1,10-phenanthroline)3 catalyst had no effect on the 19F n.m.r. spectra of the 5-fluorotryptophan-labeled receptor in either the D-glucose bound or sugar empty conformation (data not shown), demonstrating that the catalyst was non-perturbing.
The O2/Cu(II)(1,10-phenanthroline)3 redox chemistry yielded both disulfide bonds and additional sulfhydryl oxidation products. In particular, disulfide formation timecourses were observed to fit the following kinetic scheme:

where RSH represents the protein sulfhydryl group, kss is the rate constant for disulfide bond formation, and k2 is the rate constant for unproductive sulfhydryl oxidation to RX, generally either the sulfinic ( ) or sulfonic ( ) oxyacid. The latter oxyacids are common oxidation products of thiols (Oae, 1991).
To analyze the reaction products the reaction was quenched, then the products were separated by SDS/polyacrylamide gel electrophoresis. Molecules containing an intramolecular disulfide were resolved by their rapid electrophoretic migration (Falke et al, 1988; Goldenberg & Creighton, 1984). The rate constants for disulfide formation and the competing oxyacid formation were determined by non-linear least-squares best fit of a two component reaction, described by equation (6), to the observed disulfide formation timecourse:
| (6) |
where Fss(t) is the fraction of the di-cysteine receptor population containing an intramolecular disulfide bond, and the rate constants are defined in the scheme above. Figure 4 shows a standard disulfide reaction timecourse for the Q26C/K263C receptor, including the non-linear least-squares best fit curve illustrating the typically good agreement between equation (6) and the data. Independent measurement of k2 by a direct assay described in the Experimental Procedures yielded a value indistinguishable from the fit value, thereby verifying the accuracy of the kinetic scheme and rate analysis.
Figure 4.

Disulfide formation timecourse for the Q26C/D263C receptor containing bound D-glucose and Ca(II) at 37°C. At t = 0 the redox catalyst Cu(II)(1,10-phenanthroline)3 was added to trigger the reaction. Subsequently, portions were removed at the indicated times and quenched, then disulfide formation was quantified by SDS/polyacrylamide gel electrophoresis. Non-linear least-squares best fit of eqn (6) yielded the indicated curve, as well as the best fit rate parameters kss, k2 and Fss(∞) listed in Table 4. The reaction contained 2 μM-receptor, 190 μM-O2 (ambient), 1·5 mM-Cu(II)(1,10-phenanthroline)3, 50 mM-KCl, 50mM-NaCl, 1·0 mM-D-glucose, 0·2mM-CaCl2, 1·0 mM-NaAsO2, 20 mM-NaH2PO4 (pH 7·0 with NaOH). See Experimental Procedures for further details.
A simple relationship exists between the observed disulfide formation rate and the kinetics of sulfhydryl–sulfhydryl collisions. The rate constant for disulfide formation kss has the linear form:
| (7) |
where σ is the efficiency factor for disulfide trapping, and kc is the rate constant for sulfhydryl collisions. The efficiency factor will vary with environment but will be similar for cysteine pairs in similar environments, as for the present case of surface cysteine residues. It follows that to a first approximation, the efficiency factor can be treated as a constant so that relative disulfide formation rates reveal the corresponding relative collision rates.
(e) Thermal motions in the D-glucose occupied receptor: detection by disulfide bond formation
The initial study of helix I and X relative motions focused on the receptor containing bound D-glucose, the conformer of known crystal structure (Vyas et al., 1987). Significant rates of disulfide bond formation were observed between cysteine 26 on helix I and each of the four cysteine residues on helix X, indicating the presence of large thermal motions involving the two helices. Most remarkable was the observed collision of Q26C and C274C, despite the 19·8 Å separation between the β-carbons of these residues in the crystal structure (Table 1). This result is novel in that relative helix motions of this magnitude have not been previously described.
Overall the disulfide formation rate constants of the four receptors, which were reproduced in separately prepared lots of protein, decreased monotonically with increasing separation of the engineered cysteine residues (Table 4). The disulfide formation rate constants for the shortest motion (kss = 210(±20) × 10−3 s−1 for Q26C/K263C at 9·1 Å Cβ separation) and the longest detected motion (kss = 0·19(±0·06) × 10−3 for Q26C/D274C at 19·8 Å Cβ separation) differed by a factor of 1·1 × 103. In principle such differences could arise either from differences in the overall reactivity of specific cysteine pairs, or from differences in the rates of sulfhydryl–sulfhydryl collisions.
Table 4.
Sulfhydryl reactivity and disulfide bond formation rate constants
| Receptor | (+) D-Glucose |
(−) D-Glucose |
|||||
|---|---|---|---|---|---|---|---|
| k1A† (s−1 M−1) | kss | k2‡ | Fss (∞)§ | kss | k2 | Fss (∞) | |
| (×10−3 s−1 molecule−1) | (×10−3 s−1 molecule−1) | ||||||
| 26/263 | 1·8±0·1 | 210±20 | 11±5 | 0·95 | >700±56 | 2±5 | 1·0 |
| 26/260 | 2·1±0·1 | 13±1·5 | 14±7 | 0·49 | 16±1 | 7±3 | 0·70 |
| 26/267 | 1·8±0·1 | 0·56±0·08 | 1·5±0·7 | 0·27 | 73±6 | 13±6 | 0·85 |
| 26/274 | 2·5±0·2 | 0·19±0·06 | 0·66±0·3 | 0·22 | 15±2 | 17±8 | 0·49 |
| 26/182 | 1·8±0·2 | 0 | — | 0 | 14±3 | 20±10 | 0·36 |
Non-linear least-squares best fit reaction parameters were measured at 37°C, as described in Experimental Procedures.
Rate constants for the reaction of di-cysteine receptors with [14C]iodoacetamide. The rate constant for the Q26C receptor was k1A = 0·5(±0·1)s−1M−1.
Rate constants for intramolecular disulfide formation (kss), and for the formation of higher sulfhydryl oxidation products (k2), were determined from the timecourse of disulfide formation (see eqn (6) and Fig. 4). For each reaction at least 2 independent determinations were carried out, each consisting of 7 or more timepoints measured in duplicate or triplicate. Values shown are from one representative determination. Measured rate constants varied <20% for independent determinations using different preparations of the same receptor.
Chemical modification studies suggested that the overall chemical reactivities of the engineered cysteine residues were quite similar. First, the rate of alkylation by iodoacetamide varied by less than 1·5-fold among the different di-cysteine proteins (Table 4). Such a rate should be sensitive to steric and electronic factors leading to variations in accessibility, pKA, and other local environmental factors that modulate reactivity. Second, the rate of the competing oxidation reaction yielded a 102-fold smaller range of rates than the disulfide reaction, and were not correlated with the disulfide formation rates. Overall, these results suggested that the observed differences in disulfide formation rates were dominated by varying collision frequencies, rather than different redox reactivities.
The observed collisions were produced by local motions in the vicinity of helices I and X rather than by global unfolding, since the negative control pair Q26C/M182C, which placed cysteines on opposite surfaces of the molecule, did not yield detectable disulfide formation unless the protein was first unfolded by 8 M-urea. Additional evidence disfavoring unfolding was provided by the strong relationship between the disulfide formation rate and spatial separation observed for the cystine pairs on helices I and X. This result suggested that the spatial information of the folded molecule was retained, whereas even local unfolding would generally destroy such information.
In summary, the evidence strongly supports a picture in which the different cysteine pairs exhibited different disulfide formation rates because they were separated by varying distances and angles in the equilibrium folded structure, and because the local motions that produce collisions were spatially heterogeneous. A model for the observed inter-helix dynamics is presented in the Discussion.
(f) Thermal motions in the sugar-empty receptor: detection by disulfide bond formation
The structural dynamics of the sugar-empty receptor were also probed, although the lack of a crystal structure for this conformer limited interpretation of the resulting disulfide formation rates. Upon removal of sugar the receptor retained considerable structure in solution, as evidenced by its free energy of unfolding, which was essentially unchanged (Table 2); by its Tb(III) dissociation rate, which increased by only twofold (Table 2); and by the 19F n.m.r. spectrum of the 5-fluorotryptophan-labeled receptor (Luck & Falke, 1991a). Yet sugar removal caused a significant increase in the disulfide formation rate of each cysteine pair, with the possible exception of Q26C/N260C. The largest increase was that observed for the control Q26C/M182C pair, which exhibited no detectable disulfide formation with sugar bound, but yielded a rate similar to the Q26C/N260C and Q26C/D274C pairs when the sugar cleft was empty (Table 4). Rates measured for the Q26C/M182C receptor were indistinguishable when the sugar was removed by partial unfolding then refolding, or by simple dialysis of the folded receptor, indicating that the observed dynamics were not sensitive to the method of sugar removal (data not shown).
It was striking to observe the formation of a disulfide bond between these Q26C and M182C positions on opposite surfaces of the folded molecule. In the D-glucose-occupied crystal structure, the β-carbon distance between residues 26 and 182 is 27·8 Å, measured through the protein interior. Thus, a remarkably large structural rearrangement was required for collision of these two cysteine residues, involving either a novel hinge-twisting motion or extensive unfolding (see Discussion). In either case the disulfide formation rates indicated that receptor backbone dynamics increased substantially in the apo-receptor. In contrast, smaller changes were observed in the rates of the competing oxidation reaction (Table 4), suggesting that the intrinsic chemical reactivity of the engineered cysteine residues was not dramatically altered by removal of ligand.
4. Discussion
(a) Use of engineered di-cysteine proteins to investigate backbone motions
The data presented above provide information regarding backbone dynamics in two conformers of the D-galactose and D-glucose receptor: a fully liganded conformer containing bound Ca(II) and D-glucose, and a sugar empty conformer containing bound Ca(II). As high resolution structural information is available only for the fully liganded protein (Vyas et al., 1987), the following discussion focuses primarily on this conformer, except where otherwise noted.
The goal of this work has been to understand the dynamics of the native receptor, thus it has been essential to carefully analyze the engineered di-cysteine receptors for differences from the wild-type molecule. Overall the results indicate that incorporation of a cysteine pair at surface positions typically leaves the protein backbone unperturbed. For example the Q26C/D274C engineered receptor, which exhibits the largest backbone motion detected in the fully liganded state, is indistinguishable from the wild-type protein in assays sensitive to: perturbations distant from the substitutions (D-galactose binding, dissociation of Tb(III) from the Ca(II) site, 19F n.m.r. frequency shifts); perturbations in the vicinity of the substitutions (19F n.m.r. frequency shifts); and perturbations of the overall stability of the folded receptor (urea denaturation), as summarized in Figure 3.
More generally, each of the engineered di-cysteine receptors is well expressed, have native folding and ligand binding, and exhibit free energies of folding within the usual range for stable proteins. Minor allosteric perturbations are detected for two of the six receptors; however, each receptor exhibits multiple properties identical to wild-type, and no correlation is seen between the observed perturbations and disulfide formation rates. Altogether, with the possible exception of the Q26C/D267C receptor (see Results), the data indicate that the di-cysteine proteins are typical receptor molecules that can be used to probe native backbone dynamics.
(b) Spatial ranges of the observed motions
(i) Defining the initial and final conformations
The di-cysteine receptors reveal significant backbone motions involving helices I and X, detected by disulfide formation during intramolecular sulfhydryl–sulfhydryl collisions. By appropriate analysis of the receptor structure, the spatial ranges of the detected motions can be estimated, and their trajectories deconvoluted into the minimum translational and rotational components.
The analysis assumes that the initial state, the equilibrium structure in solution, is well-approximated by the crystal structure (Vyas et al., 1987). Because such a structure is available only for the wild-type protein, it is useful to focus on the coordinates of two cysteine Cα–Cβ bonds, as illustrated in Figure 2, which will lie at the same positions in the wild-type and engineered proteins, assuming that the surface cysteines do not significantly perturb the backbone structure. Similarly in the final state, when a disulfide bond has formed during a collision event, strong constraints can be placed on the relative positions of the two Cα–Cβ bonds, even though the structure of this state is generally unknown. These constraints are derived from the allowed conformations of disulfide bonds as revealed by the pool of known disulfide structures (Protein Data Bank). Finally, by comparing the relative positions of the two Cα–Cβ bonds in the initial and final states, the minimum translational and rotational components of the trapped backbone trajectory can be determined.
(ii) Translational component
The minimum translational motion needed for disulfide formation can be estimated by noting that the maximum Cβ–Cβ distance observed in protein disulfide bonds is 4·6 Å (Sowdhamini et al., 1989; J. Cate, C. L. Careaga & J. J. Falke, unpublished results). When a cysteine pair exceeds this separation, a minimum translation of is required for a productive collision. This calculation is equivalent to defining a sulfhydryl collision sphere of 2·3 Å radius, centered on each β-carbon (see Fig. 6, below). Only when two collision spheres intersect can a disulfide bond be formed. Of course this spherical approximation overestimates the volume of the true collision surface, which is smaller and non-spherical because sulfhydryl motions are constrained by side-chain bonding and local steric barriers. Moreover, the true reaction surfaces for disulfide formation are still smaller due to orientational constraints provided by the transition state. Finally, the true trajectory will generally not connect the two cysteine residues via a straight line. For these reasons, the translation amplitude provided by the collision sphere approximation is a lower limit.
Figure 6.
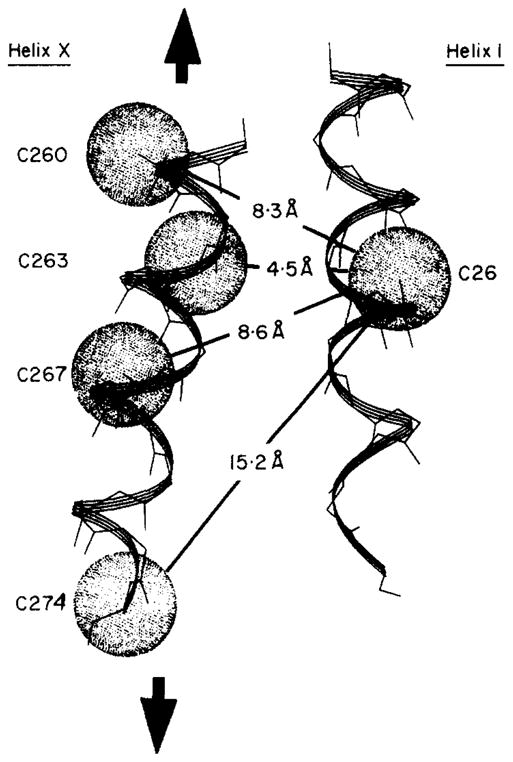
Model for the backbone motion observed by disulfide trapping. Shown are helix I (right) and helix X (left). For each engineered cysteine position the approximate sulfhydryl collision surface (2·3 Å) is indicated by the stippled sphere; in order for a disulfide bond to form, the collision surfaces of 2 cysteine residues must intersect. Helix X is proposed to give the largest translations, indicated by the bold arrows. The minimum translational distance, which is calculated as the distance between the 2 collision surfaces, is indicated for each cysteine pair. See Discussion for further details.
In the present application, the minimum translational motion ranges from 4·5 to 15·2 Å for the cysteine pairs observed to form disulfide bonds, while the control pair on opposite protein surfaces would require at least a 23·2 Å motion. The estimated minimum translational motions are summarized in Table 5.
Table 5.
Amplitudes and frequencies of the observed backbone motions
| Cysteine pair | Distances (minimum translation) |
Angles (minimum rotation) |
Rate constants (per molecule) |
||||
|---|---|---|---|---|---|---|---|
| (Å) | † | (deg.) | θij†(deg.) | θji† (deg.) | kss (×10−3 s−1) | kc‡(s−1) | |
| 26, 263 | 9·1 | (4·5) | −40 | 102 | 88 | 210±20 | ~104 |
| 26, 260 | 12·9 | (8·3) | −42 | 121 | 25 (+35) | 13±1·5 | ~103 |
| 26, 267 | 13·2 | (8·6) | −20 | 79 | 74 | 0·56±0·08 | ~102 |
| 26, 274 | 19·8 | (15·2) | −54 | 50 (+ 10) | 114 | 0·19±0·06 | ~101 |
| 26, 182 | 27·8 | (23·2) | 143 | 99 | 73 | 0 | 0 |
Values in parentheses indicate the minimum translation or rotation required to bring the 2 cysteine residues within the range required for disulfide formation. Distances and angles are defined in Fig. 2, and measured in the crystal structure of the wild-type receptor (Vyas et at., 1987). See Discussion for details.
The rate constant of sulfhydryl–sulfhydryl collisions (kc) at 37°C was estimated from the rate constant of disulfide formation (kss; Table 4) using eqn (7) in the text. The efficiency factor was σ ~ 1 × 10⁻⁵, determined for the conversion of free cysteine to cystine in aqueous solution under the standard redox conditions. See Experimental Procedures and Discussion for details.
(iii) Rotational component
The angular motions required for a productive collision can be analyzed in terms of three angles relating residues i and j, as illustrated in Figure 2: the pseudo-dihedral angle about the imaginary bond ( ); and the pseudo-bond angles and (θij and θji, respectively) (Balaji et al., 1989). While the ranges observed for these angles in known protein disulfide structures are relatively broad, there are distinct limits for each (J. Cate, C. L. Careaga & J. J. Falke, unpublished results). For orientations that do not fall within these limits, rotational motion is needed during the collision trajectory for disulfide formation. In the present case three cysteine pairs satisfy the angular requirements, while two pairs do not. The minimum rotational motions estimated for the latter pairs range up to Δrot ≥ 35°, as summarized in Table 5.
(iv) Correlations between motional amplitudes and rates
Table 5 illustrates that the disulfide formation rates observed for different helix I, X cysteine pairs differ by factors as large as 1·1 × 103. These variations stem primarily from inequalities in sulfhydryl–sulfhydryl collision rates rather than differences in chemical reactivites, since the cysteine pairs exhibit quite similar reactivities as judged by chemical modification studies.
Interestingly, the observed disulfide formation rates are generally strongly correlated with the minimum translational motion, such that cysteine pairs requiring smaller translational motions exhibit more rapid disulfide formation (Tables 4 and 5). This relationship is further analyzed in Figure 5, which plots log kss against the minimum translational motion, yielding a monotonically decreasing curve. Yet additional factors are also important, as illustrated by the Q26C/N260C and Q26C/D267C pairs, which exhibit a 20-fold difference in disulfide formation rates despite their similar calculated translational amplitudes (Table 5). In this case the latter rate may be depressed by the relatively buried nature of the side-chain at the 267 position, which could decrease the sulfhydryl–sulfhydryl collision rate. When this questionable rate is excluded from the spatial correlation, the dependence of log kss on translational amplitude becomes linear, as illustrated by the broken line in Figure 5, suggesting a, simple exponential relationship may exist between collision rate and proximity. In contrast, no angular correlation is observed, implying that the translational component is rate-limiting in this system. Additional studies are needed to ascertain whether such simple relationships actually exist, and to test their generality.
Figure 5.
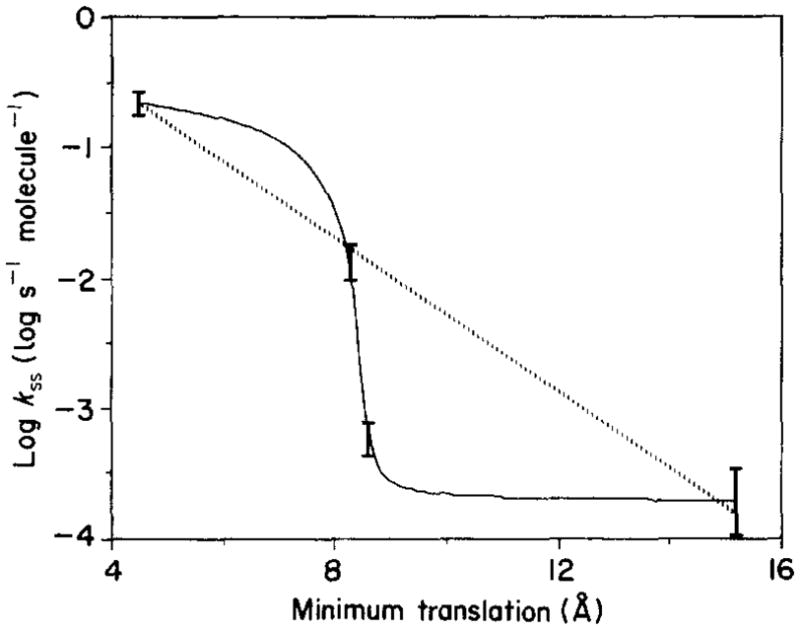
Dependence of the disulfide formation rate on the calculated minimum translation distance. For each di-cysteine receptor, the rate constant for intramolecular disulfide formation was determined (as in Fig. 4), and the minimum translation required for disulfide formation was calculated from the distance between the 2 cysteine β-carbons in the starting crystal structure ( ; see Discussion). Shown are rate constants for the Q26C/K263C, Q26C/N260C, Q26C/D267C and Q26C/D274C receptors, in order of increasing translation. The continuous curve is an interpolation including all 4 rate constants; the broken line is a linear least-squares best fit when the rate constant of Q26C/D267C is omitted. See Discussion for further details.
(c) Timescales of the observed motions
The rate of disulfide formation contains information on the timescale of the motion it detects, since it is linearly related to the rate constant of sulfhydryl–sulfhydryl collisions, as described by equation (7) (kss = σ·kc). The efficiency factor σ which quantifies the fraction of collisions resulting in disulfide formation, is observed to be σ ~ 1×10⁻⁵ for the aqueous reaction of free cysteine to from cystine under the redox conditions used in the present work. Thus, only a small fraction of collisions are successfully converted to disulfides. A similar efficiency is expected for the reaction of surface cysteine residues in a protein, due to the largely aqueous environment of these residues.
Making use of this approximation enables calculation of an estimated sulfhydryl–sulfhydryl collision rate from each disulfide formation rate as summarized in Table 5. The resulting collision rates range from ~104 to ~10 collisions s−1 molecule−1 for the 4·5 and 15·2 Å translations, respectively. Of course these collision frequencies are first approximations based on the assumption that the accessibility, environment, orientation and lifetime of sulfhydryl–sulfhydryl collisions, which together determine the efficiency of disulfide formation, are similar on the protein surface and in solution. Despite this uncertainty, it is likely that the estimated collision rates significantly underestimate the true frequencies of backbone motions in the helix I–helix X region, since only a minor fraction of these motions will result in sulfhydryl–sulfhydryl collisions. It follows that the detected motions are rapid relative to the sugar and Ca(II) dissociation (1·4 s−1 molecule−1 for D-glucose, and 10−3 s−1 molecule−1 for Ca(II); Miller et al., 1980; B. W. Buoscio & J. J. Falke, unpublished results), suggesting that these motions occur in the fully liganded receptor conformation.
(d) Models for the observed motions
The available evidence disfavors unfolding as an explanation for the motions observed in the fully liganded receptor. The strong relationship between spatial separation and the disulfide formation rate, as well as the rapid rate of collisions relative to ligand dissociation, each demonstrate that the observed motions are not the result of global unfolding. It remains formally possible that the motions stem from local unfolding, for example a helix–coil transition in helix I or X. However, such a model has difficulty explaining the observed spatial dependence of disulfide formation rates, since most types of local unfolding would destroy such relationships.
The simplest model consistent with the available data, both spatial and kinetic, proposes a relative parallel sliding motion of helices I and X, as illustrated in Figure 6, with additional minor helix rotations accounting for the needed angular dynamics. Analysis of the local structure indicates that helix X is likely to be relatively mobile, since this helix bridges an inter-domain hinge strand at its N terminus, and an extended 14-residue loop lacking regular secondary structure at its C terminus. Indirect evidence for thermal motions in the helix X region is provided by 19F n. m. r. spin lattice relaxation studies of the 5-fluorotryptophan-labeled receptor. Specifically, the tryptophan 284 side-chain, which lies in van der Waals contact with helix X, exhibits a longer T1 relaxation time than any of the four tryptophan residues located in other regions of the molecule, as expected for rapid and isotropic local motion (Table 3). By contrast, helix I is anchored at each end by short turns connecting to β-strands imbedded in the core β-sheets of the N-terminal domain and therefore is likely to be relatively immobile.
When sugar is removed from the receptor, the rates and amplitudes of the detected backbone motions increase, as is typically observed for apoproteins (MacKerell et al., 1989). Most dramatic is the disulfide formation between the control pair on opposite surfaces of the molecule (Q26C/M182C), which is not observed when D-glucose is bound unless the molecule is first unfolded by urea. While disulfide formation rate upon removal of sugar, the slower rates of the other four pairs become strikingly similar in magnitude, suggesting that the latter collisions occur during a rate-limiting structural fluctuation. The trajectory of this fluctuation could involve extensive twisting of the inter-domain hinge, enabling the control pair, with a cysteine on each domain, to collide. Alternatively, the fluctuation could be a global partial unfolding of the molecule. In the latter case refolding of the molecule In the latter case refolding must be rapid, since the bulk of the population remains folded (Luck & Falke, 1991a,c). The twofold increase in Tb(III) dissociation rate upon removal of sugar also suggests greater flexibility in the sugar free conformer.
(e) Implication for molecular dynamics calculations
The observation of extensive backbone motions by disulfide trapping in a typical globular protein suggests that the backbone dynamics previously indicated by molecular dynamics calculations are indeed a characteristic feature of proteins in solution (for a review, see McCammon & Hervey, 1987). Moreover, the present results predict that as highly accurate algorithms and increased computing power enable simulations to be extended to longer timescales, long-range backbone motions with amplitudes exceeding 10 Å will be observed on functionally relevant timescales Ultimately such simulations may be able to provide detailed trajectories for the motions detected by disulfide trapping.
(f) Implications for receptor function
It is quite plausible that the observed backbone motions near the inter-domain hinge region are an important component of hinge flexibility, which is known to enable the cleft angle to vary at least 18° in solution (Luck & Falke, 1991c; Newcomer et al., 1981). This hinge motion in turn is required for sugar binding and dissociation, and generates an allosteric conformational change regulating docking sites on the surface of the receptor, distant from the buried sugar binding site (Vyas et al., 1988; Quiocho, 1990). Large-amplitude thermal backbone motions may be characteristic of allosteric receptor molecules, or typical of proteins in general. More extensive application of the disulfide trapping approach will shed light on these and other issues.
Acknowledgments
The authors thank Jilla Sabeti for expert technical assistance; Dr Florante A. Quiocho and co-workers for graciously providing crystallographic co-ordinates; Drs Stanley J. Gill and Thomas C. Terwilliger for helpful comments; and members of the Falke group, particularly Kit Swaggert and Eric Snyder, for technical advice. Support of this work by the National Institutes of Health (RO1-GM40731 and 1F31-GM14909) is gratefully acknowledged.
Footnotes
Abbreviations used: r.m.s., root-mean-square; n.m.r., nuclear magnetic resonance; DTE, dithioerythritol.
References
- Altenbach C, Marti T, Khorana HG, Hubbell WL. Transmembrane protein structure: spin labeling of bacteriorhodopsin mutants. Science. 1990;248:1088–1092. doi: 10.1126/science.2160734. [DOI] [PubMed] [Google Scholar]
- Argos P, Mahoney WC, Hermodson MA, Hanei M. Structural prediction of sugar-binding proteins functional in chemotaxis and transport. J Biol Chem. 1981;256:4357–4361. [PubMed] [Google Scholar]
- Balaji VN, Mobasser A, Rao SN. Modification of protein stability by introduction of disulfide bridges and prolines: geometric criteria for mutation sites. Biochem Biophys Res Commun. 1989;160:109–114. doi: 10.1016/0006-291x(89)91627-6. [DOI] [PubMed] [Google Scholar]
- Boos W, Gordon AS, Hall RE, Price DH. Transport properties of the galactose-binding protein of Escherichia coli: substrate induced conformational change. J Biol Chem. 1972;247:917–924. [PubMed] [Google Scholar]
- Bowie JU, Reidhaarolson JF, Lim WA, Sauer RT. Deciphering the message in protein sequences: tolerance to amino acid substitutions. Science. 1990;247:1306–1310. doi: 10.1126/science.2315699. [DOI] [PubMed] [Google Scholar]
- Bull C, McClune GJ, Fee JA. The mechanism of Fe-EDTA catalyzed superoxide dismutation. J Amer Chem Soc. 1983;105:5290–5300. [Google Scholar]
- Careaga CL, Falke JJ. Use of disulfide bond formation to detect protein backbone motions. Biophys J. 1991;59:570a. [Google Scholar]
- Careaga CL, Falke JJ. Structure and dynamics of E. coli chemosensory receptors: engineered sulfhydryl studies. Biophys J. 1992;62:209–219. doi: 10.1016/S0006-3495(92)81806-4. [DOI] [PMC free article] [PubMed] [Google Scholar]
- Cecil R, McPhee JR. The sulfur chemistry of proteins. Advan Protein Chem. 1959;14:255–389. doi: 10.1016/s0065-3233(08)60613-0. [DOI] [PubMed] [Google Scholar]
- Creighton TE, Goldenberg DP. Kinetic role of a meta-stable native-like two-disulfide species in the folding transition of bovine pancreatic trypsin inhibitor. J Mol Biol. 1984;179:497–526. doi: 10.1016/0022-2836(84)90077-9. [DOI] [PubMed] [Google Scholar]
- Elber R, Karplus M. Multiple conformational states of proteins: a molecular dynamics analysis of myoglobin. Science. 1987;235:318–321. doi: 10.1126/science.3798113. [DOI] [PubMed] [Google Scholar]
- Falke JJ, Koshland DE. Global flexibility in a sensory receptor: a site directed disulfide approach. Science. 1987;237:1596–1600. doi: 10.1126/science.2820061. [DOI] [PubMed] [Google Scholar]
- Falke JJ, Dernburg AF, Sternberg DA, Zalkin N, Milligan DL, Koshland DE. Structure of a bacterial sensory receptor: a site directed sulfhydryl study. J Biol Chem. 1988;263:14850–14858. [PubMed] [Google Scholar]
- Frauenfelder H, Sligar SG, Wolynes PG. The energy landscape and motions of proteins. Science. 1991;254:1598–1603. doi: 10.1126/science.1749933. [DOI] [PubMed] [Google Scholar]
- Gill SC, von Hippel PH. Calculation of protein extinction coefficients from amino-acid sequence data. Anal Biochem. 1989;182:319–326. doi: 10.1016/0003-2697(89)90602-7. [DOI] [PubMed] [Google Scholar]
- Goldenberg DP, Creighton TE. Gel-electrophoresis in studies of protein conformation and folding. Anal Biochem. 1984;138:1–18. doi: 10.1016/0003-2697(84)90761-9. [DOI] [PubMed] [Google Scholar]
- Heppel LA. In: Structure and Function of Biological Membranes. Ruthfield LI, editor. Academic Press, Inc; New York: 1971. pp. 223–247. [Google Scholar]
- Ichiye T, Karplus M. Collective motions in proteins: a covariance analysis of atomic fluctuations in molecular-dynamics and normal mode simulations. Proteins: Struct Funct Genet. 1991;11:205–217. doi: 10.1002/prot.340110305. [DOI] [PubMed] [Google Scholar]
- Karplus M. Internal dynamics of proteins. Methods Enzymol. 1986;131:283–307. doi: 10.1016/0076-6879(86)31046-2. [DOI] [PubMed] [Google Scholar]
- Kellermann OK, Ferenci T. Maltose-binding protein from Escherichia coli. Methods Enzymol. 1982;90:459–463. doi: 10.1016/s0076-6879(82)90171-9. [DOI] [PubMed] [Google Scholar]
- Kobashi K. Catalytic oxidation of sulfhydryl groups by o-phenanthroline copper complex. Biochim Biophys Acta. 1968;158:239–245. doi: 10.1016/0304-4165(68)90136-0. [DOI] [PubMed] [Google Scholar]
- Kunkel TA, Roberts JD, Zakour RA. Rapid and efficient site-specific mutagenesis without phenotypic selection. Methods Enzymol. 1988;154:367–382. doi: 10.1016/0076-6879(87)54085-x. [DOI] [PubMed] [Google Scholar]
- Laemmli UK. Cleavage of structural proteins during the assembly of the head of bacteriophage T4. Nature (London) 1970;227:680–685. doi: 10.1038/227680a0. [DOI] [PubMed] [Google Scholar]
- Lakowicz JR. Fluorescence studies of structural fluctuations in macromolecules observed by fluorescence spectroscopy in the time, lifetime, and frequency domains. Methods Enzymol. 1986;131:518–568. doi: 10.1016/0076-6879(86)31054-1. [DOI] [PubMed] [Google Scholar]
- Levitt M. Molecular dynamics of macromolecules in water. Chem Script. 1989;29A:197–203. [Google Scholar]
- Luck LA, Falke JJ. 19F NMR studies of the D-galactose chemosensory receptor. 1. Sugar binding yields a global structural change. Biochemistry. 1991a;30:4248–4256. doi: 10.1021/bi00231a021. [DOI] [PMC free article] [PubMed] [Google Scholar]
- Luck LA, Falke JJ. 19F NMR studies of the D-galactose chemosensory receptor. 2. Ca(II) binding yields a local structural change. Biochemistry. 1991b;30:4257–4261. doi: 10.1021/bi00231a022. [DOI] [PMC free article] [PubMed] [Google Scholar]
- Luck LA, Falke JJ. Open conformation of a substrate binding cleft: 19F NMR studies of cleft angle in the D-galactose chemosensory receptor. Biochemistry. 1991c;30:6484–6490. doi: 10.1021/bi00240a019. [DOI] [PMC free article] [PubMed] [Google Scholar]
- Lyons A, King DJ, Owens RJ, Yarranton GT, Millican A, Whittle NR, Adair JR. Site specific attachment to recombinant antibodies via introduced surface cysteine residues. Protein Eng. 1990;3:703–708. doi: 10.1093/protein/3.8.703. [DOI] [PubMed] [Google Scholar]
- MacKerell AD, Jr, Nilsson L, Rigler R, Heinemann U, Saenger W. Molecular-dynamics simulation of ribonuclease-Tl: comparison of the free enzyme and the 2′ GMP enzyme complex. Proteins: Struct Funct Genet. 1989;6:20–31. doi: 10.1002/prot.340060103. [DOI] [PubMed] [Google Scholar]
- Matsumura M, Matthews BW. Control of enzyme activity by an engineered disulfide bond. Science. 1989;243:792–794. doi: 10.1126/science.2916125. [DOI] [PubMed] [Google Scholar]
- McCammon JA, Harvey SC. In Dynamics of Proteins and Nucleic Acids. Cambridge University Press; Cambridge, U.K: 1987. pp. 79–156. [Google Scholar]
- Miller DM, Olson JS, Quiocho FA. The mechanism of sugar binding to the periplasmic receptor for galactose chemotaxis and transport in Escherichia coli. J Biol Chem. 1980;255:2465–2471. [PubMed] [Google Scholar]
- Miller DM, Olson JS, Pflugrath JW, Quiocho FA. Rates of ligand binding to periplasmic proteins involved in bacterial transport and chemotaxis. J Biol Chem. 1983;258:13665–13672. [PubMed] [Google Scholar]
- Miller JH. Experiments in Molecular Genetics. Cold Spring Harbor Laboratory Press; Cold Spring Harbor, NY: 1972. [Google Scholar]
- Muller N, Heire HG, Boos W. Characterization of the Salmonella typhimurium mgl operon and its gene products. J Bacteriol. 1985;163:37–45. doi: 10.1128/jb.163.1.37-45.1985. [DOI] [PMC free article] [PubMed] [Google Scholar]
- Newcomer ME, Lewis BA, Quiocho FA. The radius of gyration of L-arabinose-binding protein decreases upon binding of ligand. J Biol Chem. 1981;256:3218–3222. [PubMed] [Google Scholar]
- Oae S. In: Organic Sulfur Chemistry: Structure and Mechanism. Doi JT, editor. CRC Press; Boca Raton: 1991. pp. 203–281. [Google Scholar]
- Pace CN. Determination and analysis of urea and guanidine hydrochloride denaturation curves. Methods Enzymol. 1986;131:266–280. doi: 10.1016/0076-6879(86)31045-0. [DOI] [PubMed] [Google Scholar]
- Paulsen MD, Ornstein RL. A 175 psec molecular dynamics simulation of camphor-bound cytochrome P450cam. Proteins: Struct Funct Genet. 1991;11:184–204. doi: 10.1002/prot.340110304. [DOI] [PubMed] [Google Scholar]
- Perry LJ, Wetzel R. Disulfide bond engineered into T4 lysozyme: stabilization of the protein toward thermal inactivation. Science. 1984;226:555–557. doi: 10.1126/science.6387910. [DOI] [PubMed] [Google Scholar]
- Pin SD, Alber T, Bell JA, Weaver LH, Matthews BW. Use of site-directed mutagenesis to obtain heavy-atom derivatives for protein crystallography. Protein Eng. 1987;1:115–123. doi: 10.1093/protein/1.2.115. [DOI] [PubMed] [Google Scholar]
- Planas A, Kirsch JF. Reengineering the catalytic lysine of aspartate aminotransferase by chemical elaboration of a genetically introduced cysteine. Biochemistry. 1991;30:8268–8276. doi: 10.1021/bi00247a023. [DOI] [PubMed] [Google Scholar]
- Post CB, Dobson CM, Karplus M. A molecular dynamics analysis of protein structural elements. Proteins: Struct Funct Genet. 1989;5:337–354. doi: 10.1002/prot.340050409. [DOI] [PubMed] [Google Scholar]
- Quiocho FA. Atomic structures of periplasmic binding proteins and the high affinity active transport systems in bacteria. Phil Trans Roy Soc ser B. 1990;326:341–351. doi: 10.1098/rstb.1990.0016. [DOI] [PubMed] [Google Scholar]
- Quiocho FA, Vyas NG, Sack JS, Vyas MN. Atomic protein structures reveal basic features of binding of sugars and ionic substrates, and calcium cation. Cold Spring Harbor Symp Quant Biol. 1987;52:453–463. doi: 10.1101/sqb.1987.052.01.052. [DOI] [PubMed] [Google Scholar]
- Richards FM. Areas, volumes, packing, and protein structure. Annu Rev Biophys Bioeng. 1977;6:151–176. doi: 10.1146/annurev.bb.06.060177.001055. [DOI] [PubMed] [Google Scholar]
- Ringe D, Petsko GA. Study of protein dynamics by X-ray diffraction. Methods Enzymol. 1986;131:389–433. doi: 10.1016/0076-6879(86)31050-4. [DOI] [PubMed] [Google Scholar]
- Rojewska D, Elber R. Molecular dynamics studies of secondary structure motions in proteins: applications to myohemerythrin. Proteins: Struct Funct Genet. 1990;7:265–279. doi: 10.1002/prot.340070308. [DOI] [PubMed] [Google Scholar]
- Sanger F, Nicklen S, Coulson AR. DNA sequencing with chain terminating inhibitors. Proc Nat Acad Sci, USA. 1977;74:5463–5467. doi: 10.1073/pnas.74.12.5463. [DOI] [PMC free article] [PubMed] [Google Scholar]
- Scholle A, Vreemann J, Blank V, Nold A, Boos W, Manson MD. Sequence of the mglB gene from Escherichia coil-K13: comparison of wild-type and mutant galactose chemoreceptors. Mol Gen Genet. 1987;208:247–253. doi: 10.1007/BF00330450. [DOI] [PubMed] [Google Scholar]
- Snyder EE, Buoscio BW, Falke JJ. Calcium(II) site specificity: effect of size and charge on metal ion binding to an EF-hand-like site. Biochemistry. 1990;29:3937–3943. doi: 10.1021/bi00468a021. [DOI] [PMC free article] [PubMed] [Google Scholar]
- Snyder GH. Intramolecular disulfide loop formation in a peptide containing two cysteines. Biochemistry. 1987;26:688–694. doi: 10.1021/bi00377a005. [DOI] [PubMed] [Google Scholar]
- Sowdhamini R, Srinivasanm N, Shoichet B, Santi DV, Ramakrishnan C, Balaram P. Stereochemical modeling of disulfide bridges. Criteria for introduction into proteins by site-directed mutagenesis. Protein Eng. 1989;3:95–103. doi: 10.1093/protein/3.2.95. [DOI] [PubMed] [Google Scholar]
- Steinfeld JI, Francisco JS, Hase WL. In Chemical Kinetics and Dynamics. Prentice Hall; New Jersey: 1989. pp. 156–168. [Google Scholar]
- Todd AP, Cong J, Levinthal F, Levinthal C, Hubbell WL. Site-directed mutagenesis of colicin El provides specific attachment sites for spin labels. Proteins. 1989;6:294–305. doi: 10.1002/prot.340060312. [DOI] [PubMed] [Google Scholar]
- Vaniwaarden PR, Driessen AJM, Menick DR, Kaback HR, Konings WN. Characterization of purified, reconstituted site-directed cysteine mutants of the lactose permease of Escherichia coli. J Biol Chem. 1991;266:15688–15692. [PubMed] [Google Scholar]
- Villafranca JE, Howell EE, Voet DH, Strobel MS, Ogden RC, Abelson JN, Kraut J. Directed mutagenesis of dihydrofolate-reductase. Science. 1983;222:782–788. doi: 10.1126/science.6356360. [DOI] [PubMed] [Google Scholar]
- Vyas MN, Jacobson BL, Quiocho FA. The calcium-binding site in the galactose chemoreceptor protein: crystallographic and metal-binding studies. J Biol Chem. 1989;264:20817–20821. [PubMed] [Google Scholar]
- Vyas NK, Vyas MN, Quiocho FA. A novel Ca(II) binding site in the galactose binding protein of bacterial transport and chemotaxis. Nature (London) 1987;327:635–638. doi: 10.1038/327635a0. [DOI] [PubMed] [Google Scholar]
- Vyas NK, Vyas MN, Quiocho FA. Sugar and signal transducer binding sites of the E. coli galactose chemoreceptor protein. Science. 1988;242:1290–1295. doi: 10.1126/science.3057628. [DOI] [PubMed] [Google Scholar]
- Wagner G, Wutrich K. Observation of internal motility of proteins by nuclear magnetic resonance in solution. Methods Enzymol. 1986;131:307–326. doi: 10.1016/0076-6879(86)31047-4. [DOI] [PubMed] [Google Scholar]
- Weissman JS, Kim PS. Reexamination of the folding of BPTI: predominance of native intermediates. Science. 1991;253:1386–1393. doi: 10.1126/science.1716783. [DOI] [PubMed] [Google Scholar]
- Wells JA. Systematic mutational analyses of protein-protein interfaces. Methods Enzymol. 1991;202:390–411. doi: 10.1016/0076-6879(91)02020-a. [DOI] [PubMed] [Google Scholar]
- Zahler WL, Cleland WW. A specific and sensitive assay for disulfides. J Biol Chem. 1968;243:716–719. [PubMed] [Google Scholar]