

Abstract
Tandem mass spectrometry, run in combination with liquid chromatography (LC-MS/MS), can generate large numbers of peptide and protein identifications, for which a variety of database search engines are available. Distinguishing correct identifications from false positives is far from trivial because all data sets are noisy, and tend to be too large for manual inspection, therefore probabilistic methods must be employed to balance the trade-off between sensitivity and specificity. Decoy databases are becoming widely used to place statistical confidence in results sets, allowing the false discovery rate (FDR) to be estimated. It has previously been demonstrated that different MS search engines produce different peptide identification sets, and as such, employing more than one search engine could result in an increased number of peptides being identified. However, such efforts are hindered by the lack of a single scoring framework employed by all search engines.
We have developed a search engine independent scoring framework based on FDR which allows peptide identifications from different search engines to be combined, called the FDRScore. We observe that peptide identifications made by three search engines are infrequently false positives, and identifications made by only a single search engine, even with a strong score from the source search engine, are significantly more likely to be false positives. We have developed a second score based on the FDR within peptide identifications grouped according to the set of search engines that have made the identification, called the combined FDRScore. We demonstrate by searching large publicly available data sets that the combined FDRScore can differentiate between between correct and incorrect peptide identifications with high accuracy, allowing on average 35% more peptide identifications to be made at a fixed FDR than using a single search engine.
Keywords: proteomics, mass spectrometry, decoy database, search engine, scoring, false discovery rate
Introduction
High-throughput proteome analyses are now commonplace, allowing researchers to assess the proteins present in a sample and, by utilising new technologies, to quantify protein abundance on a large scale. The high-throughput methods can generate large volumes of data for which manual verification of peptide and protein identification is not feasible, so automated methods are required to make correct identifications. It is not yet clear how best to determine which peptide or protein identifications are correct, and how to optimise identification pipelines such that false discovery is kept sufficiently low while maximising the number of proteins that can be identified correctly1.
There are a number of software applications, both commercial and open-source, for identifying peptides from mass spectra2-6. Each application produces a set of non-standard, algorithm-dependent measures of the quality of peptide and protein identifications. Several search engines produce an expectation value (e-value), which relates to the likelihood of a peptide identification having being made by chance. However it has been recently demonstrated that e-values are not comparable between different packages7. Without a search engine independent measure, it is difficult to optimise identification pipelines, and researchers are likely to set stringent thresholds (often with a limited understanding of the underlying statistical model), to ensure that the rate of false positives is acceptably low. One approach for validating identifications involves the use of a decoy database, which allows statistical confidence to be placed on an identification set, by showing the rate of hits to decoy sequences (such as reversed or randomised protein sequences), from which an estimate of the number of false positives can be calculated for a given threshold8.
It has been demonstrated that different software packages do not produce the same peptide identifications for large sets of spectra7, particularly for peptides scoring close to the threshold for acceptance or rejection. This means that it should be possible to extract more identifications from a set of spectra by employing multiple search engines, if there is a framework for combining the identification sets. In this work, we have developed a search engine independent scoring system that assigns a score to each peptide-spectrum match based on the frequency of false discovery for identifications made with such a score or better. The score is similar to a q-value, which has recently been demonstrated for use in proteomics [ref] as a search engine independent scoring system for each peptide-spectrum identification. A q-value is calculated as follows (a graphical example is shown in Figure 3). First, identifications are ordered according to some metric of quality, such as peptide ion score from Mascot or XCorr from Sequest. Second, for each score associated with a peptide-spectrum match, the cumulative FDR is estimated (for example from a decoy database search) that would result if that exact score was set as the threshold for acceptance or rejection of identifications. Third, a q-value is assigned to each match as the minimum FDR at which the identification could be made, i.e. the weakest threshold that could be set to include an identification without increasing the number of false positive (see Methods detailed algorithm). Q-values are useful for setting thresholds that guarantee the reported FDR is less than a given threshold. However, q-values are less useful for further calculations for the following reason. Q-values follow a stepwise distribution where all target identifications with no intervening decoy identifications share the same q-value and relative information about the quality of an identification is lost. Furthermore, within a set of identifications that share the same q-value, the strongest identification will always be a decoy identification, such that q-values are biased against decoy identifications. Therefore, we have adapted the calculation of q-values such that rather than following the stepwise distribution of q-values, the software uses localised linear regression to estimate the FDR for the target identifications between each decoy identification (see Methods for algorithm), called the FDRScore. Each peptide-spectrum identification therefore can have three related measures: i) the estimated FDR, ii) the q-value and iii) the FDRScore as demonstrated in Figure 1. Across an entire identification set, all three values are roughly similar however on a localised scale the FDRScore is more useful for further calculation, since it maintains the ordering of identification quality (which is lost in both estimated FDR and q-value), and each FDRScore assigned to a target identification is likely to be closer to the actual FDR associated with a peptide-spectrum match than either the estimated FDR or the q-value. Finally, all target identifications scoring higher than the best decoy hit have an estimated FDR and q-value = 0, although their probability of being incorrect is not zero. The regression method used to calculate FDRScores includes the origin (0,0) for the first calculation and hence no identification has an FDRScore = 0.
Figure 3.
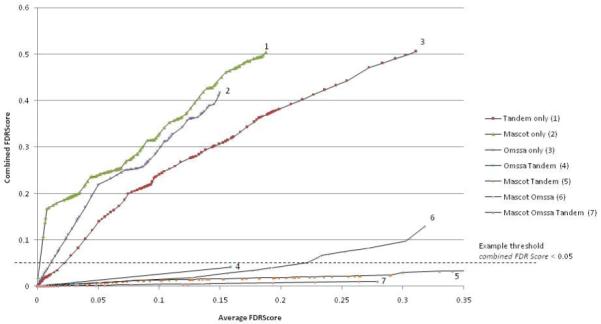
Relationship between average FDRScore and combined FDRScore from a single experiment with data set Peptide Altas PAe000162.
Figure 1.

An example to demonstrate the estimation of FDR and the calculation of q-values and FDRScore, from a set of peptide-spectrum matches ordered by increasing e-value.
The assignment of an FDRScore to each identification allows the identification sets produced by different search engines to be compared using a single metric, and enables the combination of the total identification set across all spectra searched with each engine. We have integrated the results from Mascot9, and two open source applications Omssa4 and X!Tandem3, and the process can be followed relatively simply by any laboratory using the search engines that are available to them.
Our results demonstrate that the FDR is far higher for peptides identified by only a single search engine. In contrast, if a peptide has been identified by all three search engines, it is highly unlikely to be a false positive. As such, we have developed a system for calculating a second metric using a similar basis to the FDRScore, called a combined FDRScore, which re-assesses the rates of false discovery for identifications made by only one search engine, by each distinct pair of search engines, or by all three search engines after data have been combined (see Methods for details). The combined FDRScore appears to be a highly effective discriminator between a correct and incorrect peptide identification, and as such, for a fixed false discovery rate, e.g. 1% FDR, on average gains of 35% total peptide identifications are possible over the best individual search engine.
Methods
Data sets searched
Proteome data sets from the public data repository PeptideAtlas10, shown in Table 1, were downloaded in mzXML format and converted to Mascot Generic format (MGF) using the RAMP parser (http://tools.proteomecenter.org/TPP.php). The majority of the data sets were from yeast (Saccharomyces cerevisiae), selected to cover a range of contributing laboratories, experimental approaches and data set sizes. The data sets were searched using Omssa (version 2.1.1), Mascot (version 2.0) and X!Tandem (version 07-07-01) using a parameter set matching the original search parameters as closely as possible: parent ion tolerance 2Da, fragment ion tolerance 0.8Da and average mass setting. Data sets contained different types of variable and fixed modification, e.g. ICAT, carbamidomethyl of cysteine and oxidation of methionine. The system was also tested using searches of human and mouse data from PeptideAtlas, and validated by data sets released by ABRF (Association of Biomolecular Research Facilities [ref]). ABRF have generated a standard protein set containing 49 known proteins, which allow the actual false discovery rate to be calculated and compared to the estimates from the decoy search approach. ABRF data sets were searched with parent ion tolerance 1.2Da, fragment ion tolerance 0.6Da and monoisotopic mass, to reflect more closely the setting used by the laboratories that produced the data.
Table 1.
Data sets from PeptideAtlas re-searched in the analysis. ICAT new corresponds with the newer form of the Isotope coded affinity tag (227.13 Da mass); ICAT old is the original form (442.2 Da mass)
| Experiment | Study authors |
Species | Variable modifications |
Fixed modifications |
|---|---|---|---|---|
|
| ||||
| PA66 | Omenn et al. | Human | Oxidation (M) | None |
| PA77 | Raught et al. | Yeast | Oxidation (M), ICAT new (heavy) |
ICAT new (light) |
| PA93 | Flory et al. | Yeast | Oxidation (M), ICAT old (heavy) |
ICAT old (light) |
| PA98 | Omenn et al. | Human | Oxidation (M) | Carbamidomethyl (C) |
| PA138 | Marelli et al. | Yeast | Oxidation (M), ICAT new (heavy) |
ICAT new (light) |
| PA146 | Raught et al. | Yeast | Oxidation (M), ICAT new (heavy) |
ICAT new (light) |
| PA157 | Marelli et al. | Yeast | Oxidation (M), ICAT new (heavy) |
ICAT new (light) |
| PA158 | Breci et al. | Yeast | Oxidation (M), ICAT new (heavy) |
ICAT new (light) |
| PA160 | Breci et al. | Yeast | Oxidation (M) | Carbamidomethyl (C) |
| PA162 | Breci et al. | Yeast | Oxidation (M) | Carbamidomethyl (C) |
| PA165 | Breci et al. | Yeast | Oxidation (M) | Carbamidomethyl (C) |
| PA166 | Breci et al. | Yeast | Oxidation (M) | Carbamidomethyl (C) |
| PA167 | Aebersold and Kregenow |
Yeast | Oxidation (M) | None |
| PA292 | Rong Wang | Mouse | Oxidation (M) | None |
The following databases were searched: Yeast SGD ORFs (http://www.yeastgenome.org/), IPI human and IPI mouse (http://www.ebi.ac.uk/IPI/). ABRF data sets were searched against a database constructed specifically by ABRF containing a combination of UniProt human, SwissProt human and additional contaminant proteins expected to be in the sample [ref]. Decoy databases were created by reversing all the protein sequences, and adding the set of reversed sequences to the standard sequences in the same database file. While there is still some discussion in the field, this method of creating a decoy database has been demonstrated to be a robust model for calculating FDR8. By searching the forward and reverse database simultaneously, standard and decoy sequences can compete equally to be the highest ranking identification for each spectrum, adequately representing how normal false positive identifications are made.
In the results set, only the top ranking peptide identification for each spectrum is included. We compared the results sets including only the top ranking identification with those including the top three ranking identifications and discovered that there is no significant increase in the number of peptides identified for a fixed FDR (data not shown).
Calculating false discovery rate for peptide identifications
A method has been published by Elias and Gygi for calculating false discovery rate (FDR) using decoy databases [ref]. Assuming a search is made against a database constructed from equal sized target and decoy database, the number of false positive peptide identifications is calculated for a given threshold by doubling the number of hits to the decoy database, following the logic that for every hit to a decoy sequence, there will be a “silent” incorrect hit in the standard database. However, we believe this measure of false discovery rate can be misleading, since it does not reflect the false discovery rate within the targets, which ultimately is the measure that researchers are interested in. It is trivial to remove the decoy identifications from a set of peptide identifications (since they are flagged with a particular identifier). In the remaining set of targets, it can be assumed on average that the number of targets which are false positives is approximately equal to the number of decoy hits that have been removed. The calculated value is different from the measure of FDR using the equation of Elias and Gygi.
Method from Elias and Gygi
| False positives (FP) | = 2 * decoy hits |
| True positives (TP) | = All targets above threshold - FP |
| False discovery rate (FDR) | = FP / FP + TP |
Example for 1000 identifications, 20 decoy identifications.
FDR = 40 / 1000 = 4%
Alternative method used here
| All targets | = Target hits only (above threshold) |
| False positives (FP) | = Decoy hits |
| True positives (TP) | = All targets above threshold - FP |
| False discovery rate (FDR) | = FP / FP + TP |
Example for 1000 identifications, 20 decoy identifications.
All targets = 980 (1000-20)
FP = 20
TP = 960 (980-20)
FDR = 2.04% (20 / 980)
Assigning FDRScore
Mascot, Omssa and X!Tandem each produce an e-value for each identification, which relates to the frequency at which such match would have been expected to be made by chance. Low e-values indicate that an identification is unlikely to have been made by chance. As has been demonstrated previously [ref], the e-values produced by the three search engines are not comparable. Table 2 displays the e-value threshold that produces a 50% FDR for the different test Yeast data sets (all searched against the same database, since e-values are proportional to database size). Clearly, there are significant differences in the threshold at which 50% FDR is achieved in different experiments, and as such an e-value should not be used except to rank the quality of matches within a single experiment for a particular search engine.
Table 2.
The e-value threshold at which 50% peptide FDR is achieved in the three search engines
| Experiment identifier |
Mascot 50% FDR |
Omssa 50% FDR |
X!Tandem 50% FDR |
|---|---|---|---|
|
| |||
| PA77 | 4 | 200 | 0.3 |
| PA93 | 4 | 60 | 0.125 |
| PA138 | 0.6 | 35 | 0.175 |
| PA146 | 5 | 80 | 0.125 |
| PA157 | 0.9 | 35 | 0.07 |
| PA158 | 3 | 500 | 1.5 |
| PA160 | 4 | 200 | 1.5 |
| PA162 | 0.8 | 60 | 0.125 |
| PA165 | 4 | 500 | 1 |
| PA166 | 2 | 100 | 1.5 |
| PA167 | 0.9 | 25 | 0.4 |
|
| |||
| Mean | 2.65 | 163 | 0.62 |
Identifications produced by the three search engines are treated independently by the software. For each search engine, the identification set is ordered by increasing e-value (decreasing quality of match). The estimated FDR, q-value and FDRScore are calculated for each peptide-spectrum match as follows (illustrated graphically in Figure 1).
For each set of peptide identifications made by one search engine:
Order identifications according to e-value
- Traverse identifications from lowest e-value to highest
- Calculate the estimated FDR for each identification according to the equation above.
- Traverse identifications from highest e-value to lowest, storing the lowest estimated FDR (FDRmin) that has been observed so far.
- For each identification, retrieve the assigned estimated FDR value (FDRest).
- If FDRest > FDRmin, q-value = FDRmin.
- Else, q-value = FDRest and FDRmin = FDRest.
- Traverse identifications from lowest q-value to highest, identifying step-points, where the q-value changes.
- At step-pointi, perform linear regression between previous step-pointi-1 (e-valuei-1, q-valuei-1) and current step-pointi (e-valuei, q-valuei).
- Calculate intercept i and gradient g between step-pointi-1 and step-pointi.
- For each identification with e-value ex between, step-pointi-1 and step-pointi assign FDRScore = ex * g + i
Recalculating FDRScores to reflect search engine agreement
For each peptide-spectrum identification the calculated FDRScore approximates the frequency of false positives that would be observed if a particular score was set as a threshold for an individual search engine. However, we observe that peptide-spectrum matches that are made by all three search engines tested have a far lower actual FDR than the general distribution. Indeed in certain data sets, decoy identifications are never observed in the set of identifications made by all three search engines, even if the individual scores from each search engine are weak. Conversely, the distribution of peptide-spectrum identifications made by only a single search engine shows that the FDR is high, even for identifications with strong scores from the source search engine.
In order to quantify the effect of search engine agreement, all peptide-spectrum identifications are divided into seven sets according to which search engines have identified them (Figure 2): 1) Tandem only, 2) Mascot only, 3) Omssa only, 4) Omssa and Tandem, 5) Mascot and Tandem, 6) Omssa and Mascot, and 7) Mascot, Omssa, and Tandem. The same algorithm as above is used to re-assign FDRScores calculated within each of the seven distinct sets. Instead of identifications being ordered by e-value, they are ordered by the FDRScores calculated in the first stage. In sets 4-6 all peptide-spectrum matches have an FDRScore assigned from each of the two search engines, and in set 7, the peptide-spectrum matches have three FDRScores, one assigned from each search engine. As such, an average FDRScore is assigned to each identification. For the average FDRScore, the geometric mean is used (calculated as the nth root of the product of n numbers) as we found empirically that a geometric mean is a better differentiator between correct and incorrect identifications than an arithmetic mean, since an arithmetic mean can mask the contribution of low FDRScores (data not shown).
Figure 2.

A flow chart of the stages in the calculated of FDRScores for each individual search engine, and combined FDRScores across search engines. The combined FDRScore can be used to set a single threshold to return identifications from each distinct set with estimated FDR approximately equal to the threshold.
For each of the seven sets of peptide-spectrum matches, the same algorithm as above is used to re-calculate the FDRScore for each identification, but rather than using the e-value produced by a single search engine to order identifications, identifications are ordered within each set by the average FDRScore. Each identification is assigned a second FDRScore, called the combined FDRScore which reflects the estimated false discovery rate within the set.
For each set of peptide identifications made by a particular combination search engine:
- Calculate average FDRScore (AFS) as
- AFS = FDRScore (sets 1-3)
- AFS = square root of FDRScorese1 * FDRScorese2 (sets 4-6)
- AFS = cube root of FDRScorese1 * FDRScorese2* FDRScorese3 (set 7).
Order identifications according to AFS
- Traverse identifications from lowest AFS to highest
- Calculate the estimated FDR for each identification according to the equation above.
- Traverse identifications from highest AFS to lowest, storing the lowest estimated FDR (FDRmin) that has been observed so far.
- For each identification, retrieve the assigned estimated FDR value (FDRest).
- If FDRest > FDRmin, q-value = FDRmin.
- Else, q-value = FDRest and FDRmin = FDRest.
- Traverse identifications from lowest q-value to highest, identifying step-points, where the q-value changes.
- At step-pointi, perform linear regression between previous step-pointi-1 (AFSi-1, q-valuei-1) and current step-pointi (AFSi, q-valuei).
- Calculate intercept i and gradient g between step-pointi-1 and step-pointi.
- For each identification with AFS ax between, step-pointi-1 and step-pointi assign FDRScore = ax * g + i
This process is performed independently for each of the seven sets of identification and is demonstrated in Figure 3 for an example experiment from Peptide Atlas. We can observe that the peptide spectrum matches made by only a single search engine have a considerably higher estimated FDR (represented by the combined FDRScore on the y-axis) than those made by a pair of search engines. In the set of identifications made by all three search engines (set 7), the estimated FDR is low, and false positives are rarely observed. In certain data sets, decoy hits are not observed at any score threshold for identifications made by all three search engines. To correct for the size of the result set, an artificial decoy hit is added at the end of each data series, such that no identification has a combined FDRScore = 0.
The combined FDRScore also has the property that it can be used to set a threshold x, returning a set of identifications with FDR ~= x (in practice almost always < x). The seven identification sets are distinct, as such a final set of peptide identifications is made by accepting all identifications with say combined FDRScore < 0.05. Each of the seven sets returns a certain number of identifications with no more than 5% FDR. In practice sets 1-3 (single search engine only) may return few, if any, identifications. This is demonstrated by the dashed line on Figure 3. All identifications with a combined FDRScore below 0.05 would pass the threshold.
The advantage of this approach is that it extracts the maximum number of peptide-spectrum matches that have the profile of being “correct” while excluding those that have the profile of being incorrect.
Results
Improvement in peptide discovery
The method outlined above was used to combine results and weight the contribution of different search engines. The number of peptides identified by each search engine with FDR < 0.01 and FDR < 0.05 was calculated, and compared with the number of peptides identified using the combined FDRScore to set threshold for data combined from the three search engines. Table 3 displays the percentage improvement using combined FDRScores over the best individual search engine (defined as the search engine that returns the highest number of peptide identifications at particular q-value threshold) in columns 2 and 3. On average the combined scoring method identifies 35% more peptides than the best individual search engine at FDR < 0.01. There is quite a large difference in the percentage gain between the lowest PA66 (7%) and the highest PA162 (68%). It is interesting to note that in the experiments where only modest gains in the number of peptides are made (PA66, PA77, PA93 and PA146) that X!Tandem performs poorly, identifying only a fraction of the number of peptides as Omssa and Mascot (see supplementary data). As such, data are effectively being combined from two search engines only. In other experiments, Omssa, X!Tandem and Mascot all perform similarly well, with either Omssa or X!Tandem identifying the highest number of peptides at 1% FDR.
Table 3.
The maximum number of peptides identified by a single search engine at FDR < 1% compared with
| ID | Threshold | Maximum Peptides identified by single search engine |
Maximum search engine |
Combined search |
Percent improvement |
|---|---|---|---|---|---|
| PAe000066 | 1% | 5405 | Omssa | 5794 | 7.2 |
| PAe000077 | 1% | 2636 | Omssa | 3016 | 14.4 |
| PAe000093 | 1% | 5924 | Omssa | 6914 | 16.7 |
| PAe000098 | 1% | 184 | Mascot | 271 | 47.3 |
| PAe000138 | 1% | 1915 | Omssa | 2628 | 37.2 |
| PAe000146 | 1% | 18710 | Omssa | 20776 | 11.0 |
| PAe000157 | 1% | 648 | Omssa | 866 | 33.6 |
| PAe000158 | 1% | 11503 | Omssa | 17091 | 48.6 |
| PAe000160 | 1% | 7687 | Tandem | 11987 | 55.9 |
| PAe000162 | 1% | 1638 | Omssa | 2757 | 68.3 |
| PAe000165 | 1% | 22151 | Omssa | 27904 | 26.0 |
| PAe000166 | 1% | 7091 | Tandem | 9007 | 27.0 |
| PAe000167 | 1% | 1194 | Tandem | 1939 | 62.4 |
| PAe000292 | 1% | 570 | Omssa | 822 | 44.2 |
|
Mean
improvement |
35.7 | ||||
Validation with standard data sets
The Association of Biomolecular Research Facilities (ABRF) have generated an artificial mixture of 49 known proteins to allow proteome technologies to be validated in laboratories. Data sets generated by several laboratories have been released, and are publicly available, although detailed analyses of the data sets has yet to be published. From the different laboratories, we selected the highest quality data set (laboratory 12874) that was available from ProteomeCommons [ref] to test that the software was correctly differentiating true and false positive peptide identifications. According to ABRF preliminary data from ABRF [ref] laboratory 12874 correctly identified 45 out of 49 of the proteins with 0 false positive identifications.
The data set was searched with the three search engines and combined FDRScores calculated. At a threshold of combined FDRScore < 0.01, 2451 peptide-spectrum matches were made combining results from the three search engines as outlined above from 6027 spectra. There were 10 decoy identifications within the list of 2451 which were removed. Of the remaining peptides 16 could be matched to proteins not expected in the analysis and the resulting peptide FDR is thus 0.0066 (16/2441). Of the 16 target false positive peptides, it is not possible to distinguish whether these are false positives caused by the search method or contaminants in the sample. However, it is clear that setting an combined FDRScore < 0.01 results in an acceptably low false positive rate, and that the method does not introduce a major bias to identify targets over decoys.
Since the complete data sets have yet to be published for the ABRF data sets it is not feasible to make a detailed comparison of the total number of peptide identifications made by our method. However, laboratory 12874 submitted 442 non-redundant peptide identifications. The combined scoring methods identifies 677 non-redundant peptides identifications (from the 2451 total redundant set), an increase of 53%.
Discussion
Large scale proteome analyses produce significant quantities of data but they are time-consuming and costly to run. Running more technical replicates can lead to larger numbers of identifications, but is not always practical or cost-effective. Furthermore, software has been developed to determine absolute protein quantitation by counting the frequency of peptides identified by mass spectra16,17. Any methods that can greatly increase the number of peptide identifications from a single study are therefore significant, as they can reduce the number of replicates required, and reduce the overall cost and time to run an experiment. It has been previously suggested that by using multiple search engines, a higher proportion of the proteome can be sampled18, but such efforts have been hampered by the lack of consensus on a software independent score.
We have re-searched considerable volumes of data, downloaded from PeptideAtlas, with Mascot, Omssa and X!Tandem. Each of the search engines produces an e-value that can be used within an experiment to score the relative quality of peptide-spectrum matches. However, the e-values have little correlation across different search engines and are not a reliable indicator of identification quality. By using a decoy database search, in each experiment a threshold can be set that ensures the rate of false discovery is sufficiently low. In this work, we introduce the concept of an FDRScore, which reflects the predicted rate of false discovery for an identification made with a particular score, reported by a single search engine on a specific data set. The FDRScore has a similar basis to the statistical measure of a q-value but incorporates simple linear regression to maintain the order of identification quality which is lost in the calculation of q-values. Crucially, FDRScores allow identifications from different search engines to be combined within the same scoring framework. It has previously been demonstrated that due to differences in how search engines score identifications, there are differences in the sets of peptides discovered. By analysing false discovery rates, we are able to demonstrate that if different search engines agree on identifications, the frequency of false positives is low. However, even in the sets of peptides identified by a single search engine, true positives can still be found. The combined FDRScore allows identifications to be extracted from identifications made by one, two or three search engines, maximising the number of peptide identifications while ensuring that the minimum number of false positives pass the threshold.
The benefits of combining multiple search engine results has also been demonstrated by the Scaffold software21. Scaffold does not rely on rates of false discovery but instead works on a related metric: the probability of a peptide being correct or incorrect. Identification probabilities can be calculated for each search engine, and Scaffold calculates a combined probability of correct identification if more than one search engine has identified the same peptide from a spectrum. The relationship between identification probability (or error probabilities) and FDR has been examined recently by Käll et al.22. They argue that error probabilities are more relevant where the presence of a specific peptide or protein is being considered. In large scale proteome scans, setting thresholds by FDR appears to provide a better measure for balancing the trade-off of between false positives and sensitivity. In the data presented for Scaffold21, a 33% gain in peptide identifications is reported over the best performing single search engine in an 18 protein sample, and a 14% increase in a more complex sample, at a 1% FDR. On average, our method identifies 35% more peptides than the best single search engine at 1% FDR in complex data sets. It appears that analysing FDR rather than identification probability allows larger gains in sensitivity, and that the Scaffold software could be further improved by incorporating an FDR-based score.
In summary, we present a proposal for a software-independent measure of the quality of an identification, the FDRScore, which can be assigned to all identifications when a decoy database search has been performed. We have utilised the FDRScore to combine data across search engines, and estimated the total number of true positive proteins that could be detected. We have demonstrated how the FDRScore can be re-assessed to reflect the contribution of evidence from different search engines. The combined FDRScore is an effective discriminator between correct and incorrect identifications, allowing considerable gains in the number of peptides that can be identified for a fixed FDR.
Acknowledgements
Work in Manchester by AJ was funded by a grant from the BBSRC. JAS, SJH, NWP also acknowledge BBSRC funding on the ISPIDER grant, ref BBS/B/17204. The authors thank Julian Selley for assistance with Mascot searches.
References
- 1.Matthiesen R. Methods, algorithms and tools in computational proteomics: A practical point of view. PROTEOMICS. 2007;7(16):2815–2832. doi: 10.1002/pmic.200700116. [DOI] [PubMed] [Google Scholar]
- 2.Colinge J, Masselot A, Giron M, Dessingy T, Magnin J. OLAV: Towards high-throughput tandem mass spectrometry data identification. PROTEOMICS. 2003;3(8):1454–1463. doi: 10.1002/pmic.200300485. [DOI] [PubMed] [Google Scholar]
- 3.Fenyo D, Beavis RC. A Method for Assessing the Statistical Significance of Mass Spectrometry-Based Protein Identifications Using General Scoring Schemes. Anal. Chem. 2003;75(4):768–774. doi: 10.1021/ac0258709. [DOI] [PubMed] [Google Scholar]
- 4.Geer LY, Markey SP, Kowalak JA, Wagner L, Xu M, Maynard DM, Yang X, Shi W, Bryant SH. Open Mass Spectrometry Search Algorithm. J. Proteome Res. 2004;3(5):958–964. doi: 10.1021/pr0499491. [DOI] [PubMed] [Google Scholar]
- 5.MacCoss MJ, Wu CC, Yates JR. Probability-Based Validation of Protein Identifications Using a Modified SEQUEST Algorithm. Anal. Chem. 2002;74(21):5593–5599. doi: 10.1021/ac025826t. [DOI] [PubMed] [Google Scholar]
- 6.Perkins DN, Pappin DJC, Creasy DM, Cottrell JS. Probability-based protein identification by searching sequence databases using mass spectrometry data. Electrophoresis. 1999;20(18):3551–3567. doi: 10.1002/(SICI)1522-2683(19991201)20:18<3551::AID-ELPS3551>3.0.CO;2-2. [DOI] [PubMed] [Google Scholar]
- 7.Balgley BM, Laudeman T, Yang L, Song T, Lee CS. Comparative Evaluation of Tandem MS Search Algorithms Using a Target-Decoy Search Strategy. Mol Cell Proteomics. 2007;6(9):1599–1608. doi: 10.1074/mcp.M600469-MCP200. [DOI] [PubMed] [Google Scholar]
- 8.Elias JE, Gygi SP. Target-decoy search strategy for increased confidence in large-scale protein identifications by mass spectrometry. Nat Meth. 2007;4(3):207–214. doi: 10.1038/nmeth1019. [DOI] [PubMed] [Google Scholar]
- 9.David N, Perkins DJCPDMCJSC. Probability-based protein identification by searching sequence databases using mass spectrometry data. Electrophoresis. 1999;20(18):3551–3567. doi: 10.1002/(SICI)1522-2683(19991201)20:18<3551::AID-ELPS3551>3.0.CO;2-2. [DOI] [PubMed] [Google Scholar]
- 10.Desiere F, Deutsch EW, King NL, Nesvizhskii AI, Mallick P, Eng J, Chen S, Eddes J, Loevenich SN, Aebersold R. The PeptideAtlas project. Nucl. Acids Res. 2006;34(suppl_1):D655–658. doi: 10.1093/nar/gkj040. [DOI] [PMC free article] [PubMed] [Google Scholar]
- 11.Arnott D, Gawinowicz MA, Kowalak JA, Lane WS, Speicher KD, Turck CW, West KA, Neubert TA. ABRF-PRG04: Differentiation of Protein Isoforms. J Biomol Tech. 2007;18(2):124–134. [PMC free article] [PubMed] [Google Scholar]
- 12.Turck CW, Falick AM, Kowalak JA, Lane WS, Lilley KS, Phinney BS, Weintraub ST, Witkowska HE, Yates NA, The Association of Biomolecular Resource Facilities Proteomics Research Group 2006 Study Relative Protein Quantitation. Mol Cell Proteomics. 2007;6(8):1291–1298. doi: 10.1074/mcp.M700165-MCP200. [DOI] [PubMed] [Google Scholar]
- 13.Wu L, Han DK. Overcoming the dynamic range problem in mass spectrometry-based shotgun proteomics. Expert Review of Proteomics. 2006;3(6):611–619. doi: 10.1586/14789450.3.6.611. [DOI] [PubMed] [Google Scholar]
- 14.Chepanoske CL, Richardson BE, von Rechenberg M, Peltier JM. Average peptide score: a useful parameter for identification of proteins derived from database searches of liquid chromatography/tandem mass spectrometry data. Rapid Communications in Mass Spectrometry. 2005;19(1):9–14. doi: 10.1002/rcm.1741. [DOI] [PubMed] [Google Scholar]
- 15.Shadforth I, Dunkley T, Lilley K, Crowther D, Bessant C. Confident protein identification using the average peptide score method coupled with search-specific, ab initio thresholds. Rapid Communications in Mass Spectrometry. 2005;19(22):3363–3368. doi: 10.1002/rcm.2203. [DOI] [PubMed] [Google Scholar]
- 16.Lu P, Vogel C, Wang R, Yao X, Marcotte EM. Absolute protein expression profiling estimates the relative contributions of transcriptional and translational regulation. Nat Biotech. 2007;25(1):117–124. doi: 10.1038/nbt1270. [DOI] [PubMed] [Google Scholar]
- 17.Old WM, Meyer-Arendt K, Aveline-Wolf L, Pierce KG, Mendoza A, Sevinsky JR, Resing KA, Ahn NG. Comparison of label free methods for quantifying human proteins by shotgun proteomics. Mol Cell Proteomics. 2005:M500084–MCP200. doi: 10.1074/mcp.M500084-MCP200. [DOI] [PubMed] [Google Scholar]
- 18.Kapp EA, Schütz F, Connolly LM, Chakel JA, Meza JE, Miller CA, Fenyo D, Eng JK, Adkins JN, Omenn GS, Simpson RJ. An evaluation, comparison, and accurate benchmarking of several publicly available MS/MS search algorithms: Sensitivity and specificity analysis. PROTEOMICS. 2006;5(13):3475–3490. doi: 10.1002/pmic.200500126. [DOI] [PubMed] [Google Scholar]
- 19.Käll L, Storey JD, MacCoss MJ, Noble WS. Assigning Significance to Peptides Identified by Tandem Mass Spectrometry Using Decoy Databases. J. Proteome Res. 2008;7(1):29–34. doi: 10.1021/pr700600n. [DOI] [PubMed] [Google Scholar]
- 20.Storey JD, Tibshirani R. Statistical significance for genomewide studies. Proceedings of the National Academy of Sciences. 2003;100(16):9440–9445. doi: 10.1073/pnas.1530509100. [DOI] [PMC free article] [PubMed] [Google Scholar]
- 21.Searle BC, Turner M, Nesvizhskii AI. Improving Sensitivity by Probabilistically Combining Results from Multiple MS/MS Search Methodologies. J. Proteome Res. 2008;7(1):245–253. doi: 10.1021/pr070540w. [DOI] [PubMed] [Google Scholar]
- 22.Käll L, Storey JD, MacCoss MJ, Noble WS. Posterior Error Probabilities and False Discovery Rates: Two Sides of the Same Coin. J. Proteome Res. 2008;7(1):40–44. doi: 10.1021/pr700739d. [DOI] [PubMed] [Google Scholar]