

Abstract
The solid-state NMR orientation-dependent frequencies measured for membrane proteins in macroscopically oriented lipid bilayers provide precise orientation restraints for structure determination in membranes. Here we show that this information can also be used to supplement crystallographic structural data to establish the orientation of a membrane protein in the membrane. This is achieved by incorporating a few orientation restraints, measured for the Escherichia coli outer membrane protein OmpX in magnetically oriented lipid bilayers (bicelles), in a simulated annealing calculation with the coordinates of the OmpX crystal structure. The 1H–15N dipolar couplings measured for the seven Phe residues of OmpX in oriented bilayers can be assigned by back-calculation of the NMR spectrum from the crystal structure and are sufficient to establish the three-dimensional orientation of the protein in the membrane, while the 15N chemical shifts provide a measure of cross-validation for the analysis. In C14 lipid bilayers, OmpX adopts a transmembrane orientation with a 7° tilt of its β-barrel axis relative to the membrane normal, matching the hydrophobic thickness of the barrel with that of the membrane.
The spatial orientation adopted by membrane proteins in cellular membranes is an intrinsic component of their biological function. Such directional information is lost in both the crystalline and micellar samples of membrane proteins used for structure determination by X-ray diffraction and solution NMR spectroscopy; however, it is retained in samples where the proteins are embedded in lipid bilayer membranes, such as those suitable for solid-state NMR spectroscopy.
Solid-state NMR experiments with lipid bilayer samples that are macroscopically oriented in the magnetic field can provide very precise orientation restraints for structure determination and refinement in environments that closely resemble cellular membranes, and since the direction of alignment is fixed by the sample geometry, they also provide the three-dimensional orientation of the protein in the membrane (1, 2). This information can also be used to supplement solution NMR structural data obtained from micelle samples, either to resolve the relative orientations of protein domains (3) or to establish a protein’s transmembrane orientation (4), provided that similar structural features are present in the two types of samples. The potential also exists for combining solid-state NMR with crystallographic data. In this paper, we show how this can be achieved by incorporating a few solid-state NMR orientation restraints, measured for the Escherichia coli outer membrane protein OmpX in macroscopically oriented lipid bilayers, in a rigid body simulated annealing calculation with the coordinates of the OmpX 1.9 Å crystal structure (5). The 1H–15N dipolar couplings and 15N chemical shifts measured for the seven Phe residues of OmpX in magnetically oriented lipid bilayers can be assigned by back-calculation of the NMR spectrum from the crystal structure and are sufficient to establish the spatial orientation of the protein in the membrane.
E. coli OmpX and its homologues in the human pathogens Yersinia, Enterobacter, Klebisiella, and Salmonella constitute a family of outer membrane virulence factors that regulate the ability of pathogenic Gram-negative bacteria to resist the host defense system (6). The structure of OmpX has been determined by both X-ray crystallography (5) and solution NMR in detergent micelles (7). It forms an eight-stranded transmembrane β-barrel and a protruding extracellular four-stranded β-sheet that is thought to mediate host cell adhesion and invasion during pathogenesis (5). The interactions between membrane proteins and lipids are very important factors influencing the folding, structure, stability, and biological function, of both α-helical and β-barrel membrane proteins (8-11). Structural studies of β-barrel outer membrane proteins via molecular dynamics simulations (12), infrared spectroscopy (13), and NMR (14-16) indicate that they can adopt tilted transmembrane orientations dictated by the protein structure and the hydrophobic thickness of the lipid bilayer, as observed for helical membrane proteins (17-20). For example, the β-barrel of the E. coli outer membrane protein PagP was found to be tilted by 25° relative to the hydrocarbon chain of its bound detergent, which was proposed to define the membrane normal orientation (21). This 25° tilt is consistent with solution NMR oxygen–water contrast data from PagP in micelles (22) and accommodates the surface distribution of hydrophobic residues and a periplasmic N-terminal amphipathic helix that rests on the membrane surface at the lipid–water interface. On the other hand, the transmembrane β-barrel domain of the E. coli outer membrane protein OmpA has been suggested to adopt a much smaller tilt (<5°) from the membrane normal, on the basis of one-dimensional 15N solid-state NMR (15).
Recently, we described the preparation of highly oriented samples of OmpX in both macroscopically oriented glass-supported phospholipid bilayers and magnetically oriented phospholipid bilayers, also known as bicelles (16). The observations of several resolved peaks in the solid-state NMR spectra of these samples, and of a strongly hydrogen bonded protein domain that resists exchange with D2O for days, demonstrated that the OmpX β-barrel is folded in both types of oriented membranes. Furthermore, the observation of single-line spectra for bicelles oriented parallel or perpendicular to the magnetic field demonstrated that the protein undergoes rapid (<10 μs) rotational diffusion around the membrane normal. In that study, the one- and two-dimensional NMR spectra indicated only a slight tilt of the OmpX β-barrel from the membrane normal. However, the barrel tilt could be estimated only qualitatively, by visually comparing the experimental spectra with those back-calculated from the tilted coordinates of the OmpX crystal structure, and experimental determination of the barrel orientation was precluded by the absence of resonance assignments to specific amino acids. The NMR spectra from selectively labeled OmpX, presented in this paper, enable resonance assignments to be made and allow the transmembrane orientation of OmpX to be experimentally determined. We show that OmpX traverses the membrane with a 7.3° (±1.6°) tilt, matching the hydrophobic thickness of the β-barrel with that of the lipid bilayer.
MATERIALS AND METHODS
Sample Preparation
Protein purification from E. coli and NMR sample preparation were as described previously (16). [15N]Phe-labeled OmpX was obtained by growing bacterial cells in minimal medium, supplemented with individual amino acids where only Phe was labeled with 15N. The bicelle samples contained 8 mg of OmpX, 46.5 mg of 14-O-PC1 (1,2-O-ditetradecyl-sn-glycero-3-phosphocholine), and 9.5 mg of 6-O-PC (1,2-O-dihexyl-sn-glycero-3-phosphocholine) in 200 μL of 1 mM Tris buffer at pH 8, and the molar ratio of long to short chain lipids was 3.2/1. Parallel bicelles, with the membrane normal parallel to the magnetic field, were obtained by adding 3 mM YbCl3 to the sample.
NMR Spectroscopy
Solution NMR experiments were performed at 40 °C, on a Bruker AVANCE 600 spectrometer equipped with a 600/54 Magnex magnet, using a cryoprobe. The standard fast HSQC (heteronuclear single-quantum correlation) experiment was used for isotropic samples with 1024 points in t2 and 256 points in t1 (23). Solid-state NMR experiments were performed at 43 °C, on a Bruker AVANCE 500 spectrometer equipped with a 500/89 AS Magnex magnet, using a double-resonance 1H/15N probe with a 5 mm inner diameter cylindrical coil built at the University of California at San Diego NIH Resource for Molecular Imaging of Proteins. The complete orientation of the bicelle samples was obtained after equilibration in the magnetic field at 43 °C for 1 h. One-dimensional 15N chemical shift spectra were obtained using single-contact CPMOIST (24). Two-dimensional 1H–15N SLF (separated local field) spectra were obtained using the SAMPI-4 experiment (25), with 1024 points in t2 and 2800 transients for each of 27 t1 increments, 1H irradiation field strengths of 50–55 kHz, a cross-polarization time of 1 ms, a recycle delay of 8 s, acquisition times of 5 or 10 ms, and SPINAL-16 heteronuclear decoupling during acquisition (26, 27). Other parameters were as described previously (25). The chemical shifts were referenced to the 1H2O resonance set to its expected position of 4.5 ppm at 43 °C (28). The NMR data were processed using NMRPipe (29), and the spectra were analyzed using Sparky (30).
Data Analysis
All calculations were performed with the XPLOR-NIH molecular structure determination package (31). Molecular structures were analyzed and visualized with the Pymol molecular analysis program (32).
The coordinates of the 1.90 Å OmpX crystal structure (5) were obtained from the Protein Data Bank (PDB) (entry 1QJ8). Missing hydrogens were added using XPLOR-NIH, and the structure was subjected to 100 cycles of Cartesian coordinate Powell minimization using a simple repulsive potential with a weak van der Waals repulsion term (kVDW = 2.0 kcal mol−1 Å−4), the van der Waals radii scaled to 0.75 times their CHARMM values in XPLOR-NIH (krad = 0.75), and no interactions between bonded atoms and atoms separated by two bonds. The resulting coordinates have an average backbone pairwise rmsd of 0.10 Å, and an average non-hydrogen atom pairwise rmsd of 0.17 Å, from the coordinates of the original PDB entry.
Simulated annealing calculations were performed with internal coordinates dynamics (33). Dipolar coupling restraints (in kilohertz) were implemented with the SANI potential (34) ramping the force constant (kSANI) from 0.001 to 1.0 kcal kHz−2, set to yield a target error of ±0.5 kHz between the calculated and experimental dipolar couplings. The comparison sets of chemical shift anisotropies (in parts per million) were implemented with the DCSA potential (35) by fixing the force constant (kCSA) to 0.0 kcal ppm−2.
The initial rigid body simulated annealing calculations for the six test assignments of F90, F107, and F148 were performed as described previously (36), by grouping all backbone and side chain atoms of OmpX as a rigid body. In the final semi-rigid body simulated annealing step, 20 structures were calculated for the lowest-rmsd resonance assignment of the SLF spectrum (Figure S2). The backbone N, O, C, and CA atoms were grouped as a rigid body leaving the HN, HA, and side chain atoms free, and preferred side chain conformations were selected using the torsion angle database Rama potential (37). The temperature was decreased from 300 to 20 K in steps of 10 K, with 8 ps of internal dynamics at each temperature. The force constants were ramped as follows: kRAMA from 0.02 to 0.2, kVDW from 0.002 to 4.0 kcal mol−1 Å−4, krad from 0.4 to 0.8, kang from 0.4 to 1.0 kcal mol−1 deg−2, and kimp from 0.1 to 1.0 kcal mol−1 deg−2.
The magnitude (Da) and rhombicity (R) of the NH dipolar coupling alignment tensor used in the calculations are defined as Da = ½(Dmax)(Szz) and R = ⅔(Sxx − Syy)/Szz, respectively, where Sxx, Syy, and Szz are the principal traceless components of the order tensor and Dmax is the maximum value of the dipolar coupling, which is 21.035 kHz for an N–H bond length of 1.05 Å (34, 38, 39). For planar phospholipid bilayers macroscopically oriented with the membrane normal parallel to the magnetic field, the order tensor is axially symmetric and its principal axis coincides with the membrane normal so that Szz = 1, Sxx = Syy, R = 0, and Da(bilayer) = ½(Dmax) = 10.52 kHz. For magnetically aligned bicelles, the “wobble” of the bilayer normal about the principal axis of alignment, parallel to the magnetic field, scales the observed dipolar coupling frequencies and chemical shift anisotropies by a factor Szz of 0.75–0.83 relative to the frequencies observed in the absence of motion (40, 41). Since the bicelle wobble motion is axially symmetric, R = 0, Da(bicelle) = SzzDa(bilayer), and the observed NMR frequencies reflect the orientation of the molecule relative to the membrane, which is similar to the case of static oriented bilayers.
In this study, the NMR experiments were performed using parallel bicelles, oriented with the membrane normal parallel to the magnetic field, and values of Dmax = 21.035 kHz, Szz = 0.8, Da(bicelle) = 8.41 kHz, and R = 0.0 were used in the calculation. These parameters gave the best agreement between experimental and calculated frequencies. The effect of varying Szz on the calculated spectra is shown in Figure 5.
Figure 5.
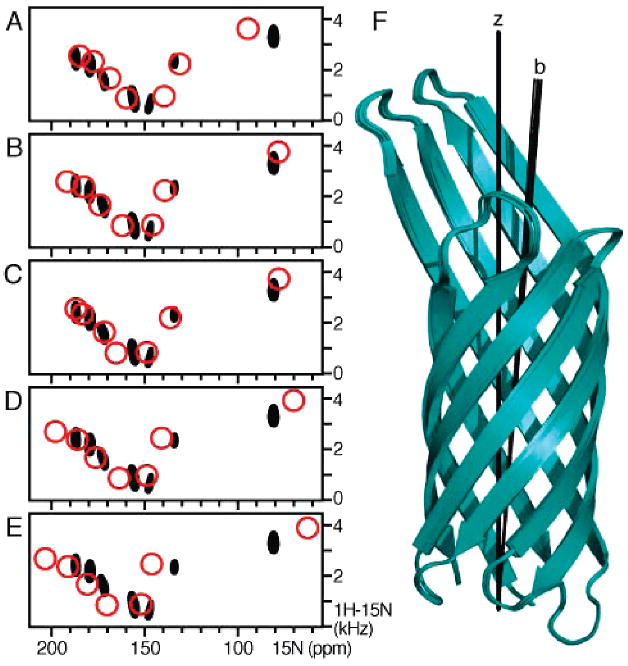
Effect of varying the bicelle order parameter, Szz, on the Phe SLF spectra calculated in the final simulated annealing step with the seven resonance assignments. The experimental spectrum is colored black. The spectra shown as red circles were calculated with the following values: (A) Szz = 0.7 and Da = 7.36; (B and C) Szz = 0.8 and Da = 8.41; (D) Szz = 0.9 and Da = 9.47; and (E) Szz = 1.0 and Da = 10.52. The orientation-dependent chemical shift frequencies were obtained from the back-calculated chemical shift anisotropies using a δiso of 125 ppm, except in panel C where the residue-specific values of δiso measured from the HSQC spectrum of OmpX in micelles were used. The overall (dipolar coupling + chemical shift) rmsds between experimental and calculated frequencies were (A) 0.030, (B) 0.021, (C) 0.022, (D) 0.031, and (E) 0.049. (F) Overlay of the coordinates obtained for each value of Szz, corresponding to the spectra in panels A–E. The barrel axes (b) adopt a similar tilt relative to the membrane normal and magnetic field (Z).
The traceless values and the molecular orientation of the 15N chemical shift tensor were as follows: δ11 = −45.7 ppm, δ22 = −62.8 ppm, δ33 = 108.5 ppm, β = 20°, and γ = 11°(42) [reported following the convention ∣δ33∣ > ∣δ22∣ > ∣δ11∣ (Figure S1)]. The chemical shift anisotropy alignment tensor was normalized to the maximum value of the dipolar coupling by setting the XPLOR-NIH DCSA parameter “scale” to 21035 Hz. The chemical shift anisotropy (CSA) for each Phe residue was calculated by subtracting the isotropic 15N chemical shift frequency (δiso) from the orientation-dependent chemical shift frequency (δbicelle) measured in the solid-state NMR SLF spectrum of OmpX in oriented bicelles; similarly, the CSA values back-calculated by simulated annealing were converted to orientation-dependent frequencies by adding δiso. The value of δiso was taken as the average (125 ppm) of the isotropic frequencies measured for the Phe peaks in the solution NMR HSQC spectrum of OmpX in 6-O-PC micelles.
Definition of the Barrel Axis
The OmpX barrel axis was determined using the equation tan α = S(a/n)b, derived to describe the geometric parameters of β-barrels (43-45), where α is the mean angle between the β-strands and the barrel axis, S is the shear number, nis the number of strands, a is the average distance between consecutive CA atoms along the strand, and b is the average distance between CA atoms on neighboring strands. For OmpX, n = 8, S = 8, and the values of a = 3.48 Å, b = 4.90 Å, and α = 35° were measured from the crystal structure. The barrel axis obtained in this way provides a frame of reference for describing the barrel tilt. The coordinates of the barrel axis were fixed to those of OmpX during the simulated annealing calculations so that the angle between the barrel axis and the external fixed axis system, with Z parallel to the magnetic field and the membrane normal, could be readily measured for each calculated structure. The barrel axis orientation for each of the 20 structures calculated in the final simulated annealing step is shown in Figure S2.
RESULTS AND DISCUSSION
The one- and two-dimensional 1H–15N spectra of [15N]Phe-labeled OmpX in 14-O-PC/6-O-PC parallel phospholipid bicelles are shown in Figure 1A–C. The seven Phe residues in the protein sequence give seven fully resolved peaks, and each peak in the SLF spectrum provides a pair of 15N chemical shift and 1H–15N dipolar coupling frequencies that can be used as residue-specific orientation restraints for protein structure determination, provided that peak assignments are determined. Peak assignments were obtained by an iterative method of simulated annealing and back-calculation from the crystal structure of OmpX, as described below.
Figure 1.
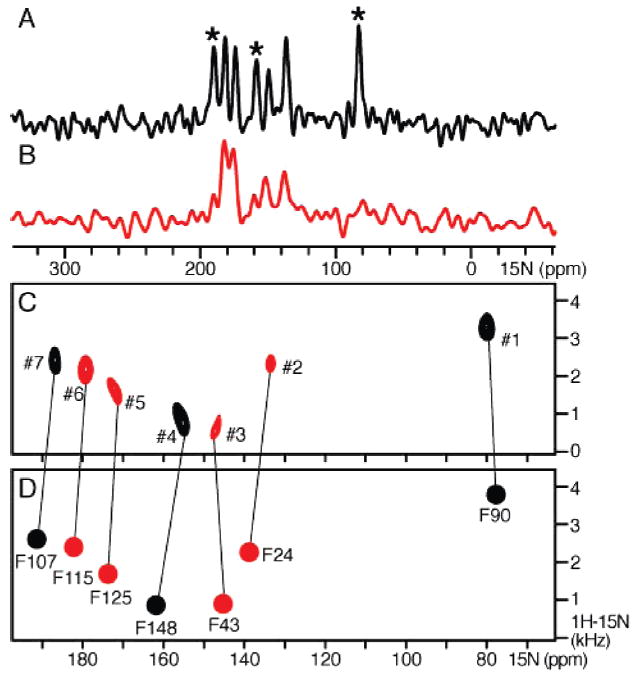
One- and two-dimensional 1H–15N spectra of [15N]Phe-labeled OmpX in 14-O-PC/6-O-PC parallel bicelles, in H2O (black) or D2O (red). (A and B) 15N chemical shift spectra. Asterisks denote peaks that disappear in D2O. (C) Experimental SLF spectrum. Peaks that persist in D2O are colored red. (D) SLF spectrum back-calculated after refinement and orientation of the crystal structure using the dipolar coupling restraints for the final resonance assignments. The orientation-dependent chemical shift frequencies were obtained from the calculated chemical shift anisotropies using a δiso of 125 ppm. Peak numbers and assignments are listed in Table 1. The rmsds between experimental and calculated frequencies are reported in Table 2.
The frequencies measured for the seven Phe peaks are reported in Table 1. Although the SLF experiment does not provide direct information about the signs of the dipolar couplings, the signs can be determined from the peak positions in the spectrum. The dipolar coupling signs for peaks assigned to F90, F107, F115, F125, and F148 (−, +, +, +, and +, respectively) can be determined with a high degree of confidence since these peaks fall in well-defined regions of the SLF spectrum where the sign is unambiguous (46). The signs for peaks assigned to F24 and F43 are less easily determined by simple inspection. They were estimated (− and −, respectively) from the spectra predicted for oriented β-strands (47) analogous to the characteristic wheel-like patterns observed for α-helices (48, 49), and verified by the back-calculation analysis.
Table 1.
Dipolar Coupling (DC) and Chemical Shift (δ) Frequencies Measured for [15N]Phe-Labeled OmpX in 14-O-PC/6-O-PC Bicelles or in Isotropic 6-O-PC Micellesa
| peak no. | residue assignment | 1H–15N DCb (kHz) | 15N δbicelleb (ppm) | 15N δisoc (ppm) |
|---|---|---|---|---|
| 2 | F24 | −5.30 | 133.70 | 122.15 |
| 3 | F43 | −1.88 | 146.70 | 128.25 |
| 1 | F90 | −7.56 | 80.25 | |
| 7 | F107 | 5.38 | 186.70 | 120.25 |
| 6 | F115 | 4.86 | 179.10 | 126.00 |
| 5 | F125 | 3.52 | 171.40 | 122.65 |
| 4 | F148 | 1.80 | 155.10 | 128.35 |
Assignments are as shown in Figure 1 and were obtained as described in the text.
Measured in magnetically oriented parallel bicelles.
Measured in isotropic micelles.
To obtain residue-specific assignments, we first identified three peaks that disappear from the spectrum after H–D exchange (Figure 1C, black, #1, #4, and #7) and assigned them to three possible residues (F90, F107, and F148) by comparison with the HSQC spectra of OmpX in 6-O-PC micelles obtained in H2O or D2O (Figure 2), using the assignments for OmpX in DHPC (1,2-dihexyl-sn-glycero-3-phosphocholine, the phosphodiester analogue of 6-O-PC) deposited by Wuthrich and co-workers (7) in the Biological Magnetic Resonance Data Bank (BMRB entry 4936).
Figure 2.
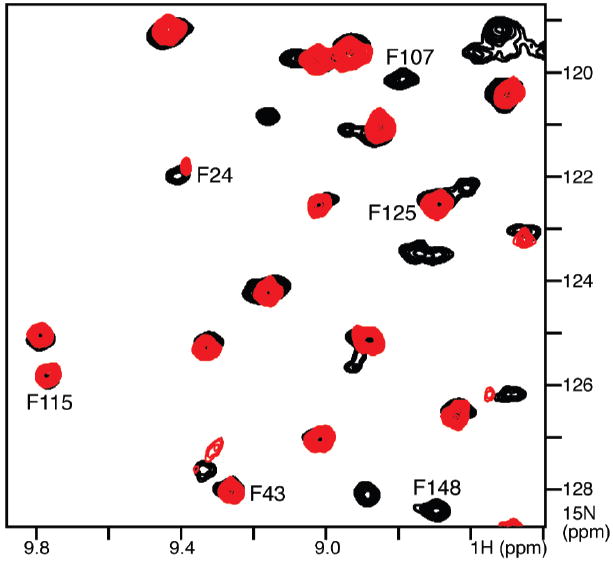
Selected region of the superimposed 1H–15N HSQC spectra of OmpX in 6-O-PC micelles, in H2O (black) or D2O (red). Peaks for F24, F43, F115, and F125 persist in the D2O spectrum.
Next we generated six (3!) test assignments (Figure 3A–F) for the possible permutations of three labels among three peaks, and six corresponding lists of dipolar couplings and chemical shift anisotropies, which were used in a rigid body simulated annealing calculation to orient the coordinates of the crystal structure relative to the magnetic field and to the membrane. Rigid body simulated annealing calculations for each of the six test assignments of F90, F107, and F148 were performed with an energy function that included only dipolar coupling restraints, while the chemical shift anisotropies were used as a comparison set to assess the closeness of fit to the experimental data. In this calculation, all the atoms of the minimized coordinates of OmpX were grouped as a rigid body and allowed to undergo both rotation and translation, while the coordinates of an external axis system with the Z axis parallel to the magnetic field were held fixed. The resulting oriented coordinates were used, in turn, to back-calculate the SLF spectrum, which was then evaluated for its closeness of fit to the experimental solid-state NMR spectrum by computing the rmsds between the observed and calculated NMR frequencies. To obtain comparable, frequency-independent, estimates of the rmsds for the dipolar couplings and chemical shifts, the deviations were scaled by the spectral range available for each spin interaction (20 kHz; 150 ppm). Since the chemical shifts were not implemented as working restraints during simulated annealing, their rmsd provides a measure of cross-validation for the structural analysis. The resulting back-calculated spectra and protein orientations are shown in Figure 3, and the corresponding rmsds are reported in Table 2.
Figure 3.
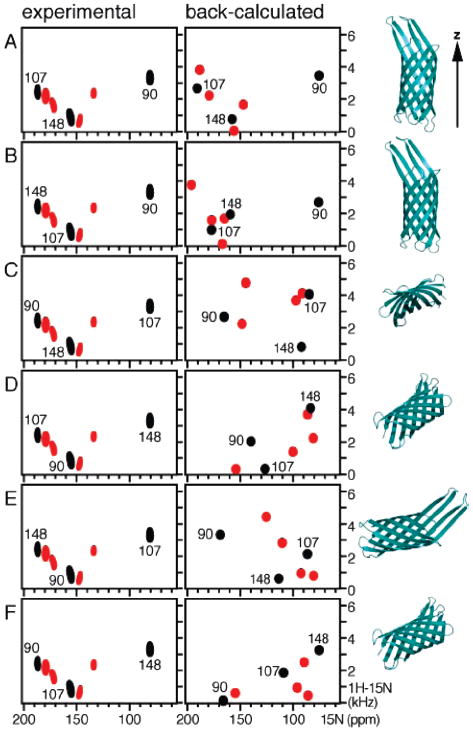
Test assignments generated for six possible ways (A–F) of distributing three Phe labels (F90, F107, and F148) among three peaks, shown in black to indicate that they disappear in D2O; peaks in red persist in D2O. For each test assignment, the experimental spectrum is shown at the left, the spectrum back-calculated after rigid-body simulated annealing with the three dipolar coupling restraints is shown in the center, and the corresponding orientations of the OmpX coordinates are shown at the right. The Z axis shown at the top is parallel to the membrane normal and the magnetic field.
Table 2.
Root-Mean-Square Deviations between Experimental and Calculated Values of the Dipolar Coupling (DC), Chemical Shift Anisotropy (CSA), and Combined DC and CSA (TOT), Obtained for Each of the Six Test Assignments of F90, F107, and F148, shown in Figure 3, and for the Final Assignment for All Phe Peaks in Figure 1D
| test assignment | DC rmsda | CSAc rmsdb | total rmsd |
|---|---|---|---|
| A | 0.019 | 0.028 | 0.023 |
| B | 0.075 | 0.136 | 0.106 |
| C | 0.019 | 0.259 | 0.139 |
| D | 0.218 | 0.239 | 0.229 |
| E | 0.254 | 0.288 | 0.271 |
| F | 0.220 | 0.195 | 0.208 |
| final (Figure 1D) | 0.015 | 0.028 | 0.021 |
Scaled by the frequency range of 20 kHz.
Scaled by the frequency range of 150 ppm.
CSA = δbicelle − 125 ppm.
Of the six test assignments, only two (Figure 3A,B) generated plausible transmembrane orientations of the OmpX β-barrel, while the others gave inconsistent and highly tilted orientations that are incompatible with membrane insertion or with the membrane hydrophobic thickness. The first test assignment (Figure 3A) was able to reproduce the pattern of resonances in the experimental spectrum very well and gave the lowest rmsds for both dipolar coupling and chemical shift frequencies.
The frequencies obtained by back-calculation from the lowest-rmsd test assignment of F90, F107, and F148, in Figure 3A, were further compared to the 24 (4!) possible assignments for the four remaining peaks of residues F24, F43, F115, and F125 (Table S1). One result with significantly lower rmsds from the experimental frequencies was accepted, and the seven dipolar couplings assigned in this way were used as working restrains in a second and final simulated annealing calculation performed with semi-rigid body dynamics, while the corresponding chemical shift anisotropies were used as a comparison set. In this step, only the backbone CA, C, N, and O atoms were grouped as a rigid body and allowed to undergo rotation and translation, and the coordinates of the external axis were fixed. The energy function included dipolar coupling restraints, as well as terms for covalent geometry, van der Waals contacts, and the torsion angle database Rama potential (37) for selection of preferred side chain conformations relative to the backbone dihedral angles.
This final simulated annealing step yields the coordinates for oriented OmpX shown in Figure 4A,D and the corresponding back-calculated spectrum in Figure 1D. The results show that OmpX traverses the membrane with a modest (7.3 ± 1.6°) tilt of the barrel axis relative to the membrane normal. The 20 calculated structures have average pairwise rmsds of 0.23 Å for the backbone atoms and 1.15 Å for all non-hydrogen atoms. Within this set, the structure with the lowest energy (Figure 4A,D) has backbone and non-hydrogen atom rmsds of 0.49 and 1.62 Å, respectively, from those of the original PDB file. The calculated spectrum is very similar to that obtained experimentally, and the resulting rmsds of 0.015 for the dipolar couplings, 0.028 for the chemical shifts, and 0.021 for the combined frequencies reflect experimental errors as well as uncertainties in the N–H bond length, in the Szz value of the bicelle order parameter, in the 15N chemical shift tensor, and in the atomic coordinates of the molecular structure.
Figure 4.
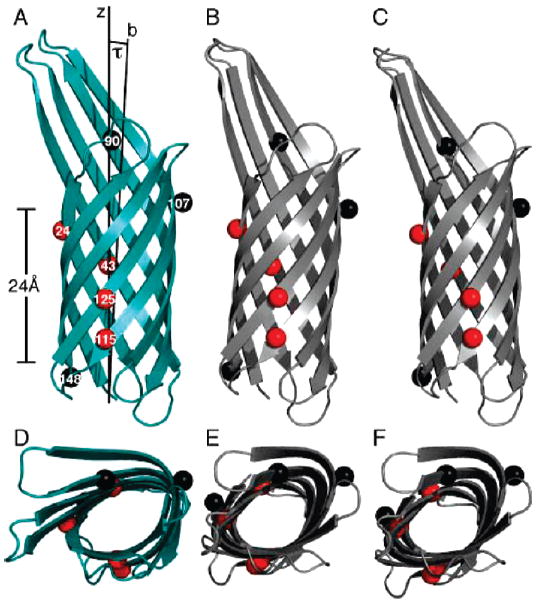
Membrane orientation of OmpX. (A and D) OmpX after refinement against the dipolar couplings measured for the seven Phe residues. The average tilt angle (τ) between the barrel axis (b) and the membrane normal (Z) is 7.3° (±1.6°). The hydrophobic thickness of the barrel is ~24 Å. (B and E) OmpX orientation from the PDBTM database. (C and F) OmpX orientation from the OPM database. The PDBTM and OPM coordinates were rotated around the Z axis to obtain views comparable to those in panels A and D. Amide nitrogen atoms are shown as spheres, with H–D exchangeable residues colored black (F90, F107, and F148) and nonexchangeable residues colored red (F24, F43, F115, and F125). (D–F) Views from the top of the Z axis.
Varying the order parameter Szz from 1.0 to 0.7 [corresponding to values of Da(bicelle) from 10.52 to 7.36 kHz] yields back-calculated spectra with dipolar couplings and chemical shift anisotropies that scale as Szz, as expected, but has no effect on the orientation of OmpX in the membrane (Figure 5). Among these values of Szz, the best agreement between experimental and calculated frequencies was obtained for Szz = 0.8 and Da(bicelle) = 8.41 kHz (Figure 5B).
Since the chemical shifts were not implemented as working restraints during simulated annealing, they play no role in determining the membrane orientation of OmpX, and given that a common chemical shift tensor was used for all Phe peaks in the analysis, it is remarkable that the back-calculated SLF spectrum reproduces both dipolar couplings as well as chemical shifts so well. Furthermore, using the residue-specific values of δiso, measured for each Phe peak in the HSQC spectrum of OmpX in micelles, instead of the average value of all the Phe peaks, has little effect on the back-calculated orientation-dependent chemical shifts (Figure 5C). The very low rmsds between the experimental and calculated spectra suggest that residue-specific tensor variations are minor compared to the spectral manifestation of molecular orientation, indicating that chemical shifts as well as dipolar couplings can be used as useful restraints for structure determination and refinement.
The oriented coordinates show that OmpX traverses the membrane with a 7° tilt of the barrel axis relative to the membrane normal. This is similar to the orientations of OmpX reported in the PDB_TM [Protein Data Bank of Transmembrane Proteins (http://pdbtm.enzim.hu/)] and OPM [Orientations of Proteins in Membranes (http://opm.phar.umich.edu/)] databases, where computational methods are used to position proteins in membranes. The oriented membrane protein coordinates in the OPM database are obtained by minimizing the energy involved in transferring a protein from water to a hydrophobic slab approximating the membrane hydrocarbon core (50, 51), while the PDBTM database orientations are derived from hydrophobicity scales of amino acid residues and estimates of nonpolar accessible surface area (52, 53). Lee (9) has noted that although the fatty acyl chain lengths of the phospholipid component of the bacterial outer membrane are predominantly C16 or C18, the fatty acyl chains of the lipopolysaccharide component are mostly saturated with a length of C14 and some C12 (54), suggesting that the thickness of the bacterial outer membrane will be similar to that of a 14-O-PC lipid bilayer, which is 23 Å, matching the hydrophobic thickness of the protein very well. Therefore, our result obtained in 14-O-PC is likely to reflect the state in the natural membrane environment.
CONCLUSIONS
The structures of several outer membrane proteins have been determined by X-ray crystallography (reviewed in refs 45 and 55-57) and more recently, the structures of OmpX, OmpA, PagP, and OmpG have also been determined in micelles by solution NMR (7, 58-60). For β-barrels, solution NMR structure determination is aided by the greater frequency dispersion observed for β-stranded compared to α-helical structures, by the lower proportion of hydrophobic amino acids and greater variability of amino acid types found in β-barrels compared to transmembrane α-helices, and, possibly, by the greater structural rigidity of β-barrels compared to α-helical proteins. The precision of NMR structures is greatly improved when orientation restraints, derived from residual dipolar couplings, are included in the structure calculation and refinement. Nevertheless, although both X-ray crystallography and solution NMR can provide high-resolution structures of membrane proteins, neither method can provide the spatial orientation of a membrane protein in the lipid bilayer membrane.
Here we have shown that this information can be obtained by combining the orientation-dependent restraints measured by solid-state NMR spectroscopy of the protein embedded in phospholipid bilayers with the atomic coordinates obtained by X-ray crystallography. In this example, the solid-state NMR data were used only to position the protein in the membrane; however, they could also be useful in refinement to improve the structural precision, which is typically much lower for membrane proteins than for their globular counterparts. The high quality of the SLF spectra obtained for OmpX also indicates that independent structure determination of β-barrel membrane proteins in lipid bilayers will be possible, since resonance assignments can be obtained spectroscopically and by analysis of the characteristic resonance patterns of oriented proteins (1, 2).
In a previous study, we also demonstrated that solid-state NMR orientation restraints can be combined with the solution NMR structure of a membrane protein to obtain its orientation in the membrane (4). The ability to back calculate the solid-state NMR spectra of membrane proteins in lipid bilayer membranes from their structures determined in crystals or in micelles indicates that their principal structural features in these distinct environments are similar, allowing the data obtained from these different types of samples to be used in a complementary fashion to obtain membrane-specific structural information.
Supplementary Material
Acknowledgments
We thank Georg Schulz for providing the OmpX expression plasmid.
Footnotes
This research was supported by the National Institutes of Health (NIH) (Grant R21GM075917). It utilized the NIH-supported Resource for NMR Molecular Imaging of Proteins (P41EB002031) and the NIH-supported Burnham Institute NMR Facility (P30CA030199).
Abbreviations: HSQC, heteronuclear single quantum correlation; SLF, separated local field; 6-O-PC, 1,2-O-dihexyl-sn-glycero-3-phosphocholine; 14-O-PC, 1,2-O-ditetradecyl-sn-glycero-3-phosphocholine; DHPC, 1,2-dihexyl-sn-glycero-3-phosphocholine; rmsd, root-meansquare deviation.
SUPPORTING INFORMATION AVAILABLE Additional data and information showing rmsds for the 24 test assignments of F24, F43, F115, and F125; the magnitudes and orientations of the components of the 15N chemical shift tensor used in the data analysis; and an overlay of the 20 oriented structures and barrel axes calculated for OmpX. This material is available free of charge via the Internet at http://pubs.acs.org.
References
- 1.Opella SJ, Marassi FM. Structure determination of membrane proteins by NMR spectroscopy. Chem Rev. 2004;104:3587–3606. doi: 10.1021/cr0304121. [DOI] [PMC free article] [PubMed] [Google Scholar]
- 2.Page RC, Li C, Hu J, Gao FP, Cross TA. Lipid bilayers: An essential environment for the understanding of membrane proteins. Magn Reson Chem. 2007;45:S2–S11. doi: 10.1002/mrc.2077. [DOI] [PubMed] [Google Scholar]
- 3.Teriete P, Franzin CM, Choi J, Marassi FM. Structure of the Na,K-ATPase Regulatory Protein FXYD1 in Micelles. Biochemistry. 2007;46:6774–6783. doi: 10.1021/bi700391b. [DOI] [PMC free article] [PubMed] [Google Scholar]
- 4.Franzin CM, Teriete P, Marassi FM. Structural similarity of a membrane protein in micelles and membranes. J Am Chem Soc. 2007;129:8078–8079. doi: 10.1021/ja0728371. [DOI] [PMC free article] [PubMed] [Google Scholar]
- 5.Vogt J, Schulz GE. The structure of the outer membrane protein OmpX from Escherichia coli reveals possible mechanisms of virulence. Structure. 1999;7:1301–1309. doi: 10.1016/s0969-2126(00)80063-5. [DOI] [PubMed] [Google Scholar]
- 6.Mecsas J, Welch R, Erickson JW, Gross CA. Identification and characterization of an outer membrane protein, OmpX, in Escherichia coli that is homologous to a family of outer membrane proteins including Ail of Yersinia enterocolitica. J Bacteriol. 1995;177:799–804. doi: 10.1128/jb.177.3.799-804.1995. [DOI] [PMC free article] [PubMed] [Google Scholar]
- 7.Fernandez C, Hilty C, Wider G, Guntert P, Wuthrich K. NMR structure of the integral membrane protein OmpX. J Mol Biol. 2004;336:1211–1221. doi: 10.1016/j.jmb.2003.09.014. [DOI] [PubMed] [Google Scholar]
- 8.Lee AG. How lipids affect the activities of integral membrane proteins. Biochim Biophys Acta. 2004;1666:62–87. doi: 10.1016/j.bbamem.2004.05.012. [DOI] [PubMed] [Google Scholar]
- 9.Lee AG. Lipid-protein interactions in biological membranes: A structural perspective. Biochim Biophys Acta. 2003;1612:1–40. doi: 10.1016/s0005-2736(03)00056-7. [DOI] [PubMed] [Google Scholar]
- 10.Hong H, Tamm LK. Elastic coupling of integral membrane protein stability to lipid bilayer forces. Proc Natl Acad Sci USA. 2004;101:4065–4070. doi: 10.1073/pnas.0400358101. [DOI] [PMC free article] [PubMed] [Google Scholar]
- 11.Kleinschmidt JH, Tamm LK. Secondary and tertiary structure formation of the β-barrel membrane protein OmpA is synchronized and depends on membrane thickness. J Mol Biol. 2002;324:319–330. doi: 10.1016/s0022-2836(02)01071-9. [DOI] [PubMed] [Google Scholar]
- 12.Baaden M, Sansom MS. OmpT: Molecular dynamics simulations of an outer membrane enzyme. Biophys J. 2004;87:2942–2953. doi: 10.1529/biophysj.104.046987. [DOI] [PMC free article] [PubMed] [Google Scholar]
- 13.Ramakrishnan M, Qu J, Pocanschi CL, Kleinschmidt JH, Marsh D. Orientation of β-barrel proteins OmpA and FhuA in lipid membranes. Chain length dependence from infrared dichroism. Biochemistry. 2005;44:3515–3523. doi: 10.1021/bi047603y. [DOI] [PubMed] [Google Scholar]
- 14.Evanics F, Hwang PM, Cheng Y, Kay LE, Prosser RS. Topology of an outer-membrane enzyme: Measuring oxygen and water contacts in solution NMR studies of PagP. J Am Chem Soc. 2006;128:8256–8264. doi: 10.1021/ja0610075. [DOI] [PubMed] [Google Scholar]
- 15.Triba MN, Zoonens M, Popot JL, Devaux PF, Warschawski DE. Reconstitution and alignment by a magnetic field of a β-barrel membrane protein in bicelles. Eur Biophys J. 2006;35:268–275. doi: 10.1007/s00249-005-0014-x. [DOI] [PubMed] [Google Scholar]
- 16.Mahalakshmi R, Franzin CM, Choi J, Marassi FM. NMR structural studies of the bacterial outer membrane protein OmpX in oriented lipid bilayer membranes. Biochim Biophys Acta. 2007;1768:3216–3224. doi: 10.1016/j.bbamem.2007.08.008. [DOI] [PMC free article] [PubMed] [Google Scholar]
- 17.Mouritsen OG, Bloom M. Models of lipid-protein interactions in membranes. Annu Rev Biophys Biomol Struct. 1993;22:145–171. doi: 10.1146/annurev.bb.22.060193.001045. [DOI] [PubMed] [Google Scholar]
- 18.White SH, Wimley WC. Hydrophobic interactions of peptides with membrane interfaces. Biochim Biophys Acta. 1998;1376:339–352. doi: 10.1016/s0304-4157(98)00021-5. [DOI] [PubMed] [Google Scholar]
- 19.Killian JA. Hydrophobic mismatch between proteins and lipids in membranes. Biochim Biophys Acta. 1998;1376:401–415. doi: 10.1016/s0304-4157(98)00017-3. [DOI] [PubMed] [Google Scholar]
- 20.Park SH, Opella SJ. Tilt angle of a trans-membrane helix is determined by hydrophobic mismatch. J Mol Biol. 2005;350:310–318. doi: 10.1016/j.jmb.2005.05.004. [DOI] [PubMed] [Google Scholar]
- 21.Ahn VE, Lo EI, Engel CK, Chen L, Hwang PM, Kay LE, Bishop RE, Prive GG. A hydrocarbon ruler measures palmitate in the enzymatic acylation of endotoxin. EMBO J. 2004;23:2931–2941. doi: 10.1038/sj.emboj.7600320. [DOI] [PMC free article] [PubMed] [Google Scholar]
- 22.Evanics F, Kitevski JL, Bezsonova I, Forman-Kay J, Prosser RS. 19F NMR studies of solvent exposure and peptide binding to an SH3 domain. Biochim Biophys Acta. 2007;1770:221–230. doi: 10.1016/j.bbagen.2006.10.017. [DOI] [PubMed] [Google Scholar]
- 23.Mori S, Abeygunawardana C, Johnson MO, Vanzijl PCM. Improved Sensitivity of HSQC Spectra of Exchanging Protons at Short Interscan Delays Using a New Fast HSQC (FHSQC) Detection Scheme That Avoids Water Saturation. J Magn Reson Ser B. 1995;108:94–98. doi: 10.1006/jmrb.1995.1109. [DOI] [PubMed] [Google Scholar]
- 24.Levitt MH, Suter D, Ernst RR. Spin Dynamics and Thermodynamics in Solid-State NMR Cross-Polarization. J Chem Phys. 1986;84:4243–4255. [Google Scholar]
- 25.Nevzorov AA, Opella SJ. Selective averaging for high-resolution solid-state NMR spectroscopy of aligned samples. J Magn Reson. 2007;185:59–70. doi: 10.1016/j.jmr.2006.09.006. [DOI] [PubMed] [Google Scholar]
- 26.Fung BM, Khitrin AK, Ermolaev K. An improved broadband decoupling sequence for liquid crystals and solids. J Magn Reson. 2000;142:97–101. doi: 10.1006/jmre.1999.1896. [DOI] [PubMed] [Google Scholar]
- 27.Sinha N, Grant CV, Wu CH, De Angelis AA, Howell SC, Opella SJ. SPINAL modulated decoupling in high field double- and triple-resonance solid-state NMR experiments on stationary samples. J Magn Reson. 2005;177:197–202. doi: 10.1016/j.jmr.2005.07.008. [DOI] [PubMed] [Google Scholar]
- 28.Cavanagh J. Protein NMR spectroscopy: Principles and practice. Academic Press; San Diego: 1996. [Google Scholar]
- 29.Delaglio F, Grzesiek S, Vuister GW, Zhu G, Pfeifer J, Bax A. NMRPipe: A multidimensional spectral processing system based on UNIX pipes. J Biomol NMR. 1995;6:277–293. doi: 10.1007/BF00197809. [DOI] [PubMed] [Google Scholar]
- 30.Goddard TD, Kneller DG. SPARKY 3. University of California; San Francisco: 2004. [Google Scholar]
- 31.Schwieters CD, Kuszewski JJ, Tjandra N, Marius Clore G. The Xplor-NIH NMR molecular structure determination package. J Magn Reson. 2003;160:65–73. doi: 10.1016/s1090-7807(02)00014-9. [DOI] [PubMed] [Google Scholar]
- 32.DeLano WL. PyMol. DeLano Scientific, San Carlos, CA: 2005. [Google Scholar]
- 33.Schwieters CD, Clore GM. Internal coordinates for molecular dynamics and minimization in structure determination and refinement. J Magn Reson. 2001;152:288–302. doi: 10.1006/jmre.2001.2413. [DOI] [PubMed] [Google Scholar]
- 34.Clore GM, Gronenborn AM, Tjandra N. Direct structure refinement against residual dipolar couplings in the presence of rhombicity of unknown magnitude. J Magn Reson. 1998;131:159–162. doi: 10.1006/jmre.1997.1345. [DOI] [PubMed] [Google Scholar]
- 35.Lipsitz RS, Tjandra N. 15N chemical shift anisotropy in protein structure refinement and comparison with NH residual dipolar couplings. J Magn Reson. 2003;164:171–176. doi: 10.1016/s1090-7807(03)00176-9. [DOI] [PubMed] [Google Scholar]
- 36.Clore GM. Accurate and rapid docking of protein-protein complexes on the basis of intermolecular nuclear overhauser enhancement data and dipolar couplings by rigid body minimization. Proc Natl Acad Sci USA. 2000;97:9021–9025. doi: 10.1073/pnas.97.16.9021. [DOI] [PMC free article] [PubMed] [Google Scholar]
- 37.Kuszewski J, Gronenborn AM, Clore GM. Improvements and extensions in the conformational database potential for the refinement of NMR and X-ray structures of proteins and nucleic acids. J Magn Reson. 1997;125:171–177. doi: 10.1006/jmre.1997.1116. [DOI] [PubMed] [Google Scholar]
- 38.Bax A, Kontaxis G, Tjandra N. Dipolar couplings in macromolecular structure determination. Methods Enzymol. 2001;339:127–174. doi: 10.1016/s0076-6879(01)39313-8. [DOI] [PubMed] [Google Scholar]
- 39.Prestegard JH, Mayer KL, Valafar H, Benison GC. Determination of protein backbone structures from residual dipolar couplings. Methods Enzymol. 2005;394:175–209. doi: 10.1016/S0076-6879(05)94007-X. [DOI] [PMC free article] [PubMed] [Google Scholar]
- 40.Sanders CR, Hare B, Howard KP, Prestegard JH. Magnetically-oriented phospholipid micelles as a tool for the study of membrane-associated molecules. Prog Nucl Magn Reson Spectrosc. 1994;26:421–444. [Google Scholar]
- 41.De Angelis AA, Jones DH, Grant CV, Park SH, Mesleh MF, Opella SJ. NMR experiments on aligned samples of membrane proteins. Methods Enzymol. 2005;394:350–382. doi: 10.1016/S0076-6879(05)94014-7. [DOI] [PubMed] [Google Scholar]
- 42.Cornilescu G, Bax A. Measurement of Proton, Nitrogen, and Carbonyl Chemical Shielding Anisotropies in a Protein Dissolved in a Dilute Liquid Crystalline Phase. J Am Chem Soc. 2000;122:10143–10154. [Google Scholar]
- 43.McLachlan AD. Gene duplication in the evolution of the yeast hexokinase active site. Eur J Biochem. 1979;100:181–187. doi: 10.1111/j.1432-1033.1979.tb02047.x. [DOI] [PubMed] [Google Scholar]
- 44.Murzin AG, Lesk AM, Chothia C. Principles determining the structure of β-sheet barrels in proteins. I. A theoretical analysis. J Mol Biol. 1994;236:1369–1381. doi: 10.1016/0022-2836(94)90064-7. [DOI] [PubMed] [Google Scholar]
- 45.Schulz GE. The structure of bacterial outer membrane proteins. Biochim Biophys Acta. 2002;1565:308–317. doi: 10.1016/s0005-2736(02)00577-1. [DOI] [PubMed] [Google Scholar]
- 46.Denny JK, Wang J, Cross TA, Quine JR. PISEMA powder patterns and PISA wheels. J Magn Reson. 2001;152:217–226. doi: 10.1006/jmre.2001.2405. [DOI] [PubMed] [Google Scholar]
- 47.Marassi FM. A simple approach to membrane protein secondary structure and topology based on NMR spectroscopy. Biophys J. 2001;80:994–1003. doi: 10.1016/S0006-3495(01)76078-X. [DOI] [PMC free article] [PubMed] [Google Scholar]
- 48.Wang J, Denny J, Tian C, Kim S, Mo Y, Kovacs F, Song Z, Nishimura K, Gan Z, Fu R, Quine JR, Cross TA. Imaging membrane protein helical wheels. J Magn Reson. 2000;144:162–167. doi: 10.1006/jmre.2000.2037. [DOI] [PubMed] [Google Scholar]
- 49.Marassi FM, Opella SJ. A solid-state NMR index of helical membrane protein structure and topology. J Magn Reson. 2000;144:150–155. doi: 10.1006/jmre.2000.2035. [DOI] [PMC free article] [PubMed] [Google Scholar]
- 50.Lomize MA, Lomize AL, Pogozheva ID, Mosberg HI. OPM: Orientations of proteins in membranes database. Bioinformatics. 2006;22:623–625. doi: 10.1093/bioinformatics/btk023. [DOI] [PubMed] [Google Scholar]
- 51.Lomize AL, Pogozheva ID, Lomize MA, Mosberg HI. Positioning of proteins in membranes: A computational approach. Protein Sci. 2006;15:1318–1333. doi: 10.1110/ps.062126106. [DOI] [PMC free article] [PubMed] [Google Scholar]
- 52.Tusnady GE, Dosztanyi Z, Simon I. Transmembrane proteins in the Protein Data Bank: Identification and classification. Bioinformatics. 2004;20:2964–2972. doi: 10.1093/bioinformatics/bth340. [DOI] [PubMed] [Google Scholar]
- 53.Tusnady GE, Dosztanyi Z, Simon I. TMDET: Web server for detecting transmembrane regions of proteins by using their 3D coordinates. Bioinformatics. 2005;21:1276–1277. doi: 10.1093/bioinformatics/bti121. [DOI] [PubMed] [Google Scholar]
- 54.Marsh D. CRC Handbook of Lipid Bilayers. CRC Press; Boca Raton, FL: 1990. [Google Scholar]
- 55.Nikaido H. Molecular basis of bacterial outer membrane permeability revisited. Microbiol Mol Biol Rev. 2003;67:593–656. doi: 10.1128/MMBR.67.4.593-656.2003. [DOI] [PMC free article] [PubMed] [Google Scholar]
- 56.Wimley WC. The versatile β-barrel membrane protein. Curr Opin Struct Biol. 2003;13:404–411. doi: 10.1016/s0959-440x(03)00099-x. [DOI] [PubMed] [Google Scholar]
- 57.Tamm LK, Hong H, Liang B. Folding and assembly of β-barrel membrane proteins. Biochim Biophys Acta. 2004;1666:250–263. doi: 10.1016/j.bbamem.2004.06.011. [DOI] [PubMed] [Google Scholar]
- 58.Arora A, Abildgaard F, Bushweller JH, Tamm LK. Structure of outer membrane protein A transmembrane domain by NMR spectroscopy. Nat Struct Biol. 2001;8:334–338. doi: 10.1038/86214. [DOI] [PubMed] [Google Scholar]
- 59.Hwang PM, Choy WY, Lo EI, Chen L, Forman-Kay JD, Raetz CR, Prive GG, Bishop RE, Kay LE. Solution structure and dynamics of the outer membrane enzyme PagP by NMR. Proc Natl Acad Sci USA. 2002;99:13560–13565. doi: 10.1073/pnas.212344499. [DOI] [PMC free article] [PubMed] [Google Scholar]
- 60.Liang B, Tamm LK. Structure of outer membrane protein G by solution NMR spectroscopy. Proc Natl Acad Sci USA. 2007;104:16140–16145. doi: 10.1073/pnas.0705466104. [DOI] [PMC free article] [PubMed] [Google Scholar]
Associated Data
This section collects any data citations, data availability statements, or supplementary materials included in this article.