Abstract
New spinal implants and surgical procedures are often tested pre-clinically on human cadaver spines. However, the availability of fresh frozen human cadaver material is very limited and alternative animal spines are more easily available in all desired age groups, and have more uniform geometrical and biomechanical properties. The porcine spine is said to be the most representative model for the human spine but a complete anatomical comparison is lacking. The goal of this descriptive study was to compare the anatomical dimensions of the cervical, thoracic, and lumbar vertebrae of the human and porcine spine in order to determine whether the porcine spine can be a representative model for the human spine. CT scans were made of 6 human and 6 porcine spines, and 16 anatomical dimensions were measured per individual vertebrae. Comparisons were made for the absolute values of the dimensions, for the patterns of the dimensions within four spinal regions, and normalised values of the dimensions within each individual vertebra. Similarities were found in vertebral body height, shape of the end-plates, shape of the spinal canal, and pedicle size. Furthermore, regional trends were comparable for all dimensions, except for spinal canal depth and spinous processus angle. The size of the end-plates increased more caudally in the human spine. Relating the dimensions to the size of the vertebral body, similarities were found in the size of the spinal canal, the transverse processus length, and size of the pedicles. Taking scaling differences into account, it is believed that the porcine spine can be a representative anatomical model for the human spine in specific research questions.
Keywords: Anatomy, Human, Porcine, Cervical spine, Thoracolumbar spine
Introduction
In vitro experiments are performed to get more insight into the biomechanical behaviour of the human spine, and therefore more insight into the normal and pathological functions. Furthermore, new spinal implants and surgical procedures are often tested pre-clinically on cadaver spines and/or computational models. In order to mimic the physiological situation as much as possible, fresh frozen human cadaver spines are preferable. However, the availability of human cadaver material is very limited, particularly from the younger population. Furthermore, a large interindividual variety exists in geometry and biomechanical properties due to differences in shape, size, bone mineral density, existence of degenerative changes, and varying age [1–3]. Because of these disadvantages, different animal models have been used as an alternative. Animal spines are more easily available, and have more uniform geometrical and biomechanical properties [3].
To determine whether the animal spine is suitable as a representative model for the human spine, it is essential to understand the comparative anatomical and biomechanical characteristics. Extensive biomechanical research has been done with animal spines, for example with spinal segments from sheep, goat, calf, and pig [4–11]. However, the anatomical characteristics should be studied as well. Furthermore, for computational models of the spine, precise geometrical data are needed [12, 13]. Anatomical comparisons have already been made for the sheep [14], calf [15], and deer spine [16], and for parts of the porcine spine [1, 2, 17]. The porcine spine is frequently used as a model for the human spine, and it is said to be the most representative animal model when testing spinal implants, spinal fusion, and instrumentation techniques [1, 2, 18]. McLain et al. [2] described the comparative anatomy of the fourth lumbar vertebra of different mammalian species, including the pig, and Dath et al. [17] described the comparative anatomy of the lumbar porcine spine. Bozkus et al. [1] described the comparative thoracic anatomy with reference to thoracoscopic surgical techniques. However, an anatomical comparison of the complete human and porcine spine is lacking.
In general, studies compare the anatomy of the animal spine with existing data from human anatomy [14–16]. It is, however, an advantage to measure both species in one study, using the same measuring technique and protocol, which would make the comparison more enhanced.
The goal of this descriptive study was to compare the anatomical dimensions of the cervical, thoracic, and lumbar vertebrae of the human and porcine spine in order to determine whether the porcine spine can be a representative model for the human spine.
Materials and methods
Fresh frozen spines of six human and six porcine cadavers were used in this study. Human specimens were harvested from six male cadavers (mean age at time of death 72 years, range 55–84, mean total body height 182 cm, range 175–192 cm) obtained from the Department of Anatomy of the University Medical Center Groningen, The Netherlands. Porcine spines were obtained from a local abattoir, and the 4-month-old domestic Landrace pigs had an average weight of 40 kg (range 37–44 kg).
All spines were dissected from C3-S1 and only musculature was removed, leaving ligaments and intervertebral discs intact. At both lateral sides of the spine approximately 3 cm of ribs was preserved, including the costotransverse and costovertebral articulations. The porcine spines had 7 cervical, 15 thoracic, and 6 lumbar vertebrae, in comparison to the human spines which had, respectively, 7, 12, and 5.
CT scans were made of all dissected spines (Siemens, Somaton Sensation 64, Siemens Medical Solutions USA Inc.). An identical scanning protocol was used for both the human and porcine spines with a slice thickness of 1.00 mm and an in-plane resolution of 0.39 × 0.39 mm.
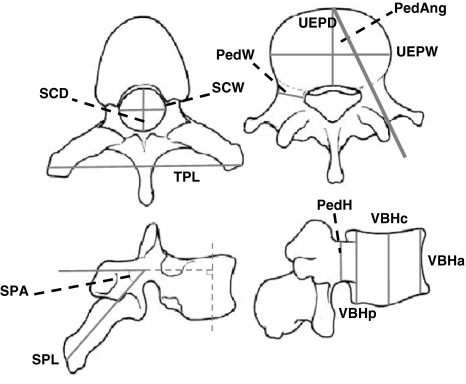
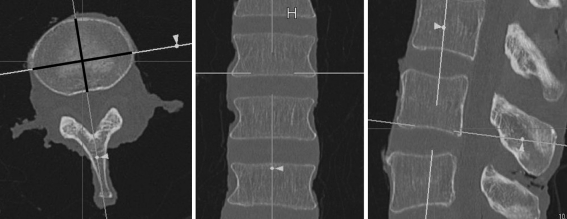
Three independent observers (IB, JP, PL) measured 16 anatomical dimensions per vertebra from the 2D views of the CT scans (Figs. 1, 2; Table 1). A system with multi-planar view was used (AquariusNET, TeraRecon Inc, San Mateo, CA), and the plane in which an individual measurement was performed was in line with the anatomical landmarks of the vertebra observed in the other views (Fig. 2). For the pedicle height, width, and angle an average was calculated for the left and right pedicles. The central vertebral body height and the spinous processus length were measured in the sagittal midline of the vertebra. Intervertebral disc height was measured in the central mid-point of the disc.
Fig. 1.
Anatomical dimensions measured per vertebra. Abbreviations are explained in Table 1
Fig. 2.
Example of a multiplanar view of a human L3 vertebra. From left to right: a transverse, frontal, and sagittal view. In this example, the lower end-plate width and depth were measured in the transverse view. The axes were placed in the correct position in the frontal and sagittal views so that the measurement was performed in the correct anatomical plane
Table 1.
Anatomical dimensions measured per vertebra and abbreviations used
| Anatomical dimension | Abbreviation | Intra-CC | 95% CI | Inter-CC | 95% CI |
|---|---|---|---|---|---|
| Vertebral body height anterior | VBHa | 0.98 | 0.56–1.00 | 0.98 | 0.93–0.99 |
| Vertebral body height central | VBHc | 0.99 | 0.88–1.00 | 0.99 | 0.92–1.00 |
| Vertebral body height posterior | VBHp | 0.99 | 0.78–1.00 | 0.98 | 0.84–0.99 |
| Upper end-plate width | UEPW | 0.99 | 0.98–1.00 | 0.99 | 0.97–0.99 |
| Upper end-plate depth | UEPD | 0.97 | 0.89–0.99 | 0.95 | 0.85–0.98 |
| Lower end-plate width | LEPW | 0.99 | 0.98–1.00 | 0.96 | 0.89–0.99 |
| Lower end-plate depth | LEPD | 0.99 | 0.93–1.00 | 0.98 | 0.94–0.99 |
| Intervertebral disc height | IDH | 0.94 | 0.86–0.97 | 0.93 | 0.86–0.97 |
| Spinal canal width | SCW | 0.90 | 0.60–0.98 | 0.91 | 0.81–0.96 |
| Spinal canal depth | SCD | 0.83 | 0.63–0.95 | 0.86 | 0.75–0.94 |
| Transverse processus length | TPL | 1.00 | 0.99–1.00 | 0.98 | 0.97–0.99 |
| Spinous processus length | SPL | 0.92 | 0.81–0.97 | 0.95 | 0.90–0.98 |
| Spinous processus angle | SPA | 0.97 | 0.94–0.99 | 0.83 | 0.59–0.94 |
| Pedicle height (average right and left) | PedH | 0.91 | 0.70–0.98 | 0.89 | 0.54–0.96 |
| Pedicle width (average right and left) | PedW | 0.97 | 0.93–0.99 | 0.94 | 0.88–0.97 |
| Pedicle angle (average right and left) | PedA | 0.92 | 0.78–0.97 | 0.89 | 0.67–0.96 |
Intraclass correlations (intra-CC), interclass correlations (inter-CC), and 95% confidence intervals (CI) of the measuring method per anatomical dimension
The total spine length was calculated as the sum of all central vertebral body heights plus the intervertebral disc heights from C3 to L5 or L6, respectively. Cervical lordosis was measured as the angle between the upper end-plate of C3 and the lower end-plate of C7, thoracic kyphosis between the upper end-plate of T1 and the lower end-plate of T12 or T15 in the human or porcine specimens, respectively, and lumbar lordosis was measured as the angle between the upper end-plate of L1 and the lower end-plate of L5 or L6, respectively.
The mean and standard deviation of each dimension were computed using Microsoft Excel (Excel 2003). The intraclass correlation and interclass correlation of the measuring method were calculated using SPSS (SPSS Inc, Chicago, USA).
Absolute values for each dimension of individual human and porcine vertebra were compared using a non-parametric Mann–Whitney U test (SPSS Inc). Summarized comparisons were made for each spinal region in order to produce a clear overview of which dimension and which region were comparable in the human and porcine spine. If the majority of human and porcine vertebrae in a region were significantly equal (p > 0.05), that particular region was defined as “comparable” for that dimension.
Furthermore, patterns of the anatomical dimensions within a spinal region were compared for human and porcine vertebrae. The patterns of a dimension within a spinal region were defined “comparable” if the ratios human/porcine of each individual vertebra showed less than 20% variance between the vertebrae of that region.
Several dimensions were normalised to their appropriate standard in order to determine the ratios within individual vertebra. Therefore a more enhanced comparison could be made for the shape of the human and porcine vertebrae.
Results
General
The CT scans of the spine specimens showed mild degeneration in the human specimens, but otherwise normal human and porcine spines without any pathology.
The mean total spine length differed 0.1 mm between the human and porcine spines (respectively, 569.4 mm, SD 17.67 vs 569.5 mm, SD 16.19, Table 2). However, total spine length of the porcine spine minus the 4 extra vertebrae was 471.7 mm. The human spine showed less cervical lordosis (20.1° vs 43.8°), and more pronounced thoracic kyphosis (34.5° vs 15.6°) and lumbar lordosis (29.2° vs 7.9°, Table 2).
Table 2.
General characteristics of the human and porcine spine
| Human | Porcine | |
|---|---|---|
| Total spine length | 569.4 (17.67) | 569.5 (16.19) |
| Cervical lordosis | 20.1 (10.0) | 43.8 (9.5) |
| Thoracic kyphosis | 34.5 (12.8) | 15.6 (5.3) |
| Lumbar lordosis | 29.2 (7.6) | 7.9 (5.7) |
Data are average values of six spines. Total spine length was defined as the sum of all central vertebral body heights and the intervertebral disc heights from C3 to L5 or L6, respectively. Cervical lordosis was measured as the angle between the upper end-plate of C3 and the lower end-plate of C7. Thoracic kyphosis was measured as the angle between the upper end-plate of T1 and the lower end-plate of T12 or T15, respectively. Lumbar lordosis was measured as the angle between the upper end-plate of L1 and the lower end-plate of L5 or L6, respectively. SD is shown in parenthesis. Length is in mm, and curves are in degrees
Kappa values for the intraclass correlations (Table 1) varied from 0.83 to 1.00 (p < 0.001). Kappa values for the interclass correlations (Table 1) varied from 0.83 to 0.99 (p < 0.001).
In the following descriptions of the anatomical dimensions, ‘width’ was defined as the side-to-side width of the dimension, and ‘depth’ was defined as the dorsal-to-ventral depth of the dimension (Fig. 1).
Vertebral bodies
In the human spine, all vertebral body heights generally increased from the cervical to the L3 vertebrae (Table 3). In the porcine spine comparable heights were found, except for the posterior vertebral body height in the low thoracic and lumbar regions (Table 4). Patterns for vertebral body height within the spinal regions were comparable as well, except for the central vertebral body height in the lower thoracic region, and the posterior vertebral body height in the lumbar region (Table 5).
Table 3.
Mean and standard deviation of anatomical dimensions of the vertebral body height and intervertebral disc height of human and porcine vertebrae
| Vertebra | VBHa | VBHc | VBHp | IDH | ||||
|---|---|---|---|---|---|---|---|---|
| Human | Porcine | Human | Porcine | Human | Porcine | Human | Porcine | |
| C3 | 14.2 (0.7) | 14.9 (1.8) | 12.6 (0.7) | 13.1 (2.0) | 15.1 (1.1) | 14.6 (1.9) | 6.1 (0.5) | 3.6 (0.5) |
| C4 | 14.5 (1.3) | 15.0 (2.0) | 12.4 (1.4) | 13.2 (1.9) | 14.6 (1.1) | 14.3 (2.0) | 5.8 (1.5) | 3.7 (0.5) |
| C5 | 13.4 (1.1) | 15.4 (2.1) | 12.1 (2.1) | 13.3 (2.1) | 14.2 (1.0) | 14.2 (2.1) | 4.5 (1.3) | 3.5 (0.5) |
| C6 | 14.0 (0.5) | 16.2 (1.9) | 12.2 (1.9) | 13.8 (1.9) | 13.9 (0.8) | 14.1 (1.9) | 4.4 (1.0) | 3.3 (0.4) |
| C7 | 15.7 (0.5) | 16.9 (2.7) | 14.3 (2.0) | 15.2 (2.0) | 15.9 (0.7) | 15.2 (2.1) | 4.7 (0.7) | 2.3 (0.6) |
| T1 | 17.3 (0.8) | 18.4 (2.2) | 16.1 (0.5) | 17.2 (2.4) | 18.8 (1.0) | 16.8 (2.2) | 5.0 (0.8) | 2.0 (0.3) |
| T2 | 17.9 (1.4) | 18.8 (2.3) | 16.7 (0.9) | 18.1 (2.4) | 19.1 (0.8) | 18.2 (2.1) | 4.5 (0.6) | 2.7 (0.5) |
| T3 | 19.3 (0.8) | 19.0 (2.2) | 17.5 (0.4) | 18.3 (2.2) | 19.6 (1.0) | 18.6 (2.3) | 4.7 (0.8) | 2.5 (0.5) |
| T4 | 19.9 (0.8) | 18.9 (1.9) | 17.9 (0.8) | 18.5 (2.6) | 20.6 (1.2) | 18.8 (2.3) | 4.7 (0.3) | 2.5 (0.6) |
| T5 | 19.1 (3.2) | 19.2 (2.3) | 17.6 (2.5) | 18.3 (2.2) | 21.0 (1.6) | 18.9 (2.5) | 4.8 (1.1) | 2.3 (0.2) |
| T6 | 19.1 (3.0) | 19.3 (2.2) | 18.1 (2.5) | 18.9 (2.4) | 21.7 (2.0) | 19.1 (2.5) | 5.3 (1.1) | 2.0 (0.3) |
| T7 | 19.8 (1.1) | 19.4 (2.4) | 19.3 (1.6) | 18.9 (2.2) | 22.4 (1.7) | 19.3 (2.1) | 5.2 (0.7) | 2.1 (0.4) |
| T8 | 20.1 (2.8) | 19.8 (2.4) | 19.8 (1.2) | 19.5 (2.2) | 22.7 (1.5) | 19.9 (2.1) | 4.9 (1.1) | 2.1 (0.2) |
| T9 | 21.4 (1.6) | 20.2 (2.5) | 21.3 (1.2) | 19.7 (2.4) | 23.7 (2.0) | 20.3 (2.5) | 4.8 (1.0) | 1.9 (0.4) |
| T10 | 23.3 (1.6) | 20.7 (2.5) | 22.2 (1.6) | 20.3 (2.6) | 25.3 (1.6) | 20.9 (2.7) | 5.9 (1.5) | 2.3 (0.3) |
| T11 | 24.2 (1.9) | 21.1 (2.6) | 24.2 (1.3) | 20.6 (2.5) | 27.1 (1.9) | 21.0 (2.9) | 6.1 (1.8) | 2.0 (0.4) |
| T12 | 25.6 (1.6) | 21.1 (2.7) | 25.5 (1.3) | 20.8 (2.7) | 28.5 (0.9) | 21.6 (2.8) | 9.3 (2.1) | 2.4 (0.6) |
| T13 | 21.5 (2.9) | 21.0 (2.7) | 22.1 (2.4) | 2.2 (0.5) | ||||
| T14 | 22.0 (2.7) | 21.3 (2.8) | 22.4 (2.4) | 2.7 (0.5) | ||||
| T15 | 22.3 (3.2) | 22.1 (2.9) | 22.7 (2.7) | 2.7 (0.4) | ||||
| L1 | 25.5 (2.5) | 23.6 (3.3) | 24.5 (4.8) | 22.6 (2.8) | 28.5 (2.5) | 23.7 (2.3) | 10.3 (3.2) | 2.7 (0.5) |
| L2 | 27.3 (2.8) | 23.8 (3.3) | 24.7 (3.6) | 23.4 (2.7) | 29.8 (1.2) | 24.0 (2.9) | 11.5 (2.3) | 2.9 (0.4) |
| L3 | 28.7 (1.9) | 24.7 (3.1) | 25.5 (0.8) | 23.4 (2.9) | 29.8 (1.0) | 24.4 (2.4) | 11.8 (2.1) | 2.6 (0.8) |
| L4 | 27.8 (2.4) | 24.8 (3.5) | 24.1 (3.4) | 24.0 (3.2) | 28.0 (2.1) | 24.9 (3.0) | 12.7 (2.6) | 2.7 (0.9) |
| L5 | 29.5 (1.4) | 24.7 (3.7) | 25.3 (1.8) | 23.9 (3.7) | 24.9 (3.8) | 25.0 (3.0) | 8.8 (3.2) | 3.0 (0.8) |
| L6 | 23.9 (3.2) | 23.0 (3.7) | 23.4 (3.3) | 2.9 (0.9) | ||||
Values in parenthesis represent the standard deviation. All dimensions are in mm
VBHa vertebral body height anterior, VBHc vertebral boy height central, VBHp vertebral body height posterior, IDH intervertebral disc height
Table 4.
Comparison of the absolute values of each dimension per spinal region
| Cervical | High thoracic | Low thoracic | Lumbar | |
|---|---|---|---|---|
| VBHa | C | C | C | C |
| VBhc | C | C | C | C |
| VBHp | C | C | NC | NC |
| UEPW | NC | NC | NC | NC |
| UEPD | C | NC | NC | NC |
| LEPW | C | NC | NC | NC |
| LEPD | NC | NC | NC | NC |
| IDH | NC | NC | NC | NC |
| SCW | NC | NC | NC | NC |
| SCD | NC | NC | NC | NC |
| TPL | NC | NC | NC | NC |
| SPL | NC | NC | C | NC |
| SPA | NC | NC | NC | NC |
| PedW | C | NC | C | C |
| PedH | C | NC | NC | C |
| PedA | NC | C | C | NC |
| SCW/UEPW | NC | C | NC | C |
| SCD/UEPD | NC | C | NC | NC |
| IDH/UEPW | C | NC | C | NC |
| SPL/UEPD | C | NC | NC | C |
| TPL/UEPW | C | NC | C | NC |
| PedW/UEPW | NC | NC | NC | NC |
| PedH/VBH | NC | NC | NC | C |
Differences in absolute values between human and porcine vertebra were calculated for each dimension in each individual vertebra using a non parametric Mann–Whitney U test. A region was defined ‘comparable’ if half or more vertebrae were significantly equal (p > 0.05). Abbreviations of the anatomical dimensions are explained in Table 1
C comparable, NC not comparable
Table 5.
Comparison of pattern similarity of each dimension per spinal region
| Cervical | High thoracic | Low thoracic | Lumbar | |
|---|---|---|---|---|
| VBHa | C | C | C | C |
| VBhc | C | C | NC | C |
| VBHp | C | C | C | NC |
| UEPW | C | C | NC | C |
| UEPD | NC | NC | C | C |
| LEPW | NC | C | NC | C |
| LEPD | C | NC | C | C |
| IDH | NC | NC | NC | NC |
| SCW | C | C | NC | C |
| SCD | NC | NC | NC | CN |
| TPL | NC | C | C | NC |
| SPL | NC | NC | C | CN |
| SPA | NC | NC | NC | NC |
| PedW | NC | C | C | NC |
| PedH | C | NC | C | NC |
| PedA | NC | C | NC | NC |
| SCW/UEPW | NC | C | C | C |
| SCD/UEPD | NC | NC | C | NC |
| IDH/UEPW | NC | NC | NC | NC |
| SPL/UEPD | NC | NC | C | CN |
| TPL/UEPW | C | C | NC | NC |
| PedW/UEPW | NC | C | C | NC |
| PedH/VBH | C | C | NC | C |
The ratio between human and porcine values of a dimension was calculated for each vertebra. If the variance of these ratios was less than 20% between the vertebrae of that specific region, the pattern for that particular dimension was defined as ‘comparable’. Abbreviations of the anatomical dimensions are explained in Table 1
C comparable, NC not comparable
In all human and porcine vertebrae the central vertebral body height was smaller than the anterior and posterior vertebral body height, but the difference was less in the porcine vertebrae. The vertebral bodies of the human vertebrae were more “saddle-shaped”, i.e. the end-plates were more concave, whereas the shape of the porcine vertebrae was more “cubical”, and the end-plate less concave.
The upper end-plate width and depth increased from C3 to L5 in the human spine, width ranging from 27.7 to 54.0 mm, and depth ranging from 16.5 to 36.7 mm. The upper end-plate width in the porcine spine was less increasing, ranging from 20.2 mm (C3) to 28.0 mm (L6). Upper end-plate depth was fairly constant in the porcine spine, ranging from 14.4 mm (C3) to 14.1 mm (L6). Similar patterns were found for the lower end-plate width and depth (Fig. 3a, b; Tables 4, 5). Differences in absolute size of the end-plates between the human and porcine vertebrae were confirmed by statistical comparison, in which only one region was comparable for upper end-plate depth and lower end-plate width. However, more comparable regions were found, looking at the pattern within the regions for end-plate width and depth (Table 5).
Fig. 3.
a Upper end-plate dimensions of the human and porcine vertebra. Bars indicate the positive SD. h Human, p porcine, UEPW upper end-plate width, UEPD upper end-plate depth. b Lower end-plate dimensions of the human and porcine vertebra. Bars indicate the positive SD. h Human, p porcine, LEPW lower end-plate width, LEPD lower end-plate depth
The shape of the end-plates was comparable in human and porcine vertebrae, varying from oval in the cervical region, to more circular thoracic, and again oval in the lumbar region (Table 5).
Intervertebral disc
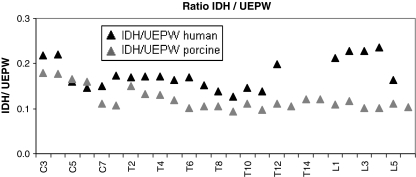
In the human spine the intervertebral disc height was largest in the low thoracic and lumbar regions, whereas in the porcine spine the intervertebral disc height was largest in the cervical region and fairly constant caudally. In general, disc heights in the porcine spine were smaller than in the human spine, particularly in the lower thoracic and lumbar regions (Table 3). None of the regions were comparable for absolute values, as well as pattern similarity (Tables 4, 5). However, when relating the disc height to the size of the vertebral body (expressed by upper end-plate width), the ratios were comparable for the cervical and lower thoracic regions (Fig. 4; Table 4).
Fig. 4.
Ratios of intervertebral disc height/upper end-plate width for human and porcine vertebrae. IDH intervertebral disc height, UEPW upper end-plate width
Spinal canal
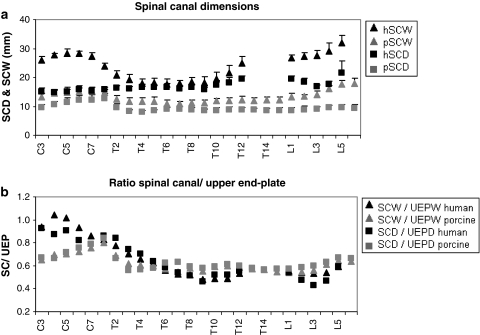
The spinal canal width was largest in the cervical and lumbar regions in both the human and porcine vertebrae. In line with the larger width of the human vertebral body (upper and lower end-plate width), the spinal canal width was larger in the human spine as well (Fig. 5a; Table 4). However, the patterns within the regions were comparable, except for the lower thoracic region (Table 5).
Fig. 5.
a Spinal canal dimensions of the human and porcine vertebra. Bars indicate the positive SD. h Human, p porcine, SCW spinal canal width, SCD spinal canal depth. b Ratios of spinal canal width/upper end-plate width, and spinal canal depth/upper end-plate depth for human and porcine vertebrae. SCW spinal canal width, SCD spinal canal depth, UEPW upper end-plate width, UEPD upper end-plate depth
The spinal canal depth in the porcine spine was constant in the cervical region, decreased suddenly, and was constant again caudally. The spinal canal depth in the human spine was somewhat more fluctuating, although with similar relative size differences (Fig. 5a).
When relating the spinal canal width and spinal canal depth to the size of the vertebral body (respectively, upper end-plate width and depth), both were comparable for the higher thoracic region, as well as for the width in the lumbar region (Fig. 5b; Table 4).
The shape of the spinal canal in the different regions of the spine was similar in the human and porcine vertebrae: triangular in the cervical spine, circular in the thoracic spine, and again triangular in the lumbar spine.
Spinous and transverse processus
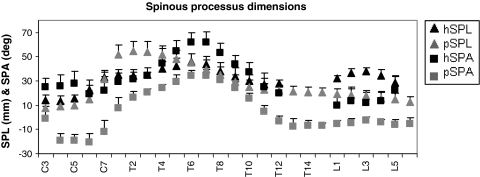
The spinous processus length in the human spine increased until T6 and decreased until fairly constant values were seen in the lumbar region. In the porcine spine the increase in spinous processus length was seen until T3 after which a steady decrease was seen until L6 (Fig. 6). The absolute values and patterns within the region for spinous processus length were comparable in the lower thoracic region (Tables 4, 5).
Fig. 6.
Spinous processus dimensions of the human and porcine vertebra. Bars indicate the positive SD. h Human, p porcine, SPL spinous processus length, SPA spinous processus angle
The angle of the spinous processus in the human spine also increased until T6, followed by a decrease and a constant value in the lumbar spine, with a maximum angle of 62.2° at the T6 level. In the porcine spine, the orientation of the spinous processus was cranial in the cervical region. At T6 the angle was maximally 34.5° caudally, and the orientations in the lower thoracic and lumbar regions of the spine were nearly perpendicular to the vertebral body (Fig. 6). Because of this “offset” difference in spinous processus, the angle between human and porcine vertebrae, absolute values as well as patterns within the regions were not comparable (Tables 4, 5).
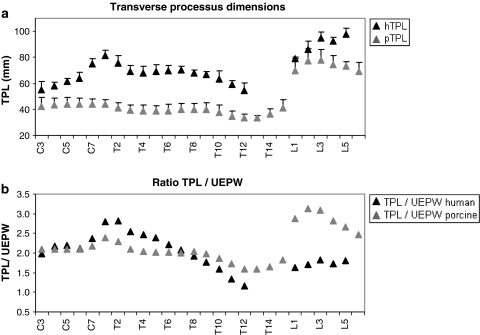
The transverse processes in the cervical and thoracic spine were longer in the human vertebrae (Fig. 7a), although the patterns within the regions were comparable in the thoracic regions. In both species a sudden increase in width was seen in the lumbar region (Fig. 7a). When relating the transverse processus length to the upper end-plate width, the ratios were comparable for the cervical and lower thoracic regions (Fig. 7b; Table 4).
Fig. 7.
a Transverse processus dimensions of the human and porcine vertebra. Bars indicate the positive SD. h Human, p porcine, TPL transverse processus length. b Ratios of transverse processus length/upper end-plate width for human and porcine vertebrae. TPL transverse processus length, UEPW upper end-plate width
Pedicles
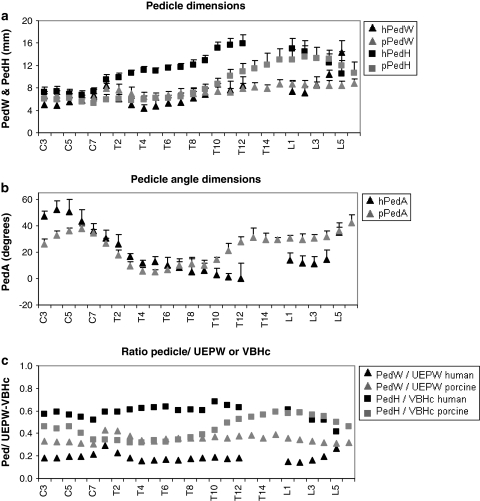
The pedicle widths of human and porcine vertebrae were comparable in absolute size, except in the higher thoracic region (Fig 8a; Table 4). Patterns within the regions were comparable in the thoracic regions (Table 5).
Fig. 8.
a Pedicle dimensions of the human and porcine vertebra. Bars indicate the positive SD. h Human, p porcine, PedW pedicle width, PedH pedicle height. b Pedicle angle dimensions of the human and porcine vertebra. Bars indicate the positive SD. h Human, p porcine, PedA pedicle angle. c Ratios of pedicle width/upper end-plate width, and pedicle height/central vertebral body height for human and porcine vertebrae. PedW pedicle width, PedH pedicle height, UEPW upper end-plate width, VBHc central vertebral body height
Pedicle height in the human vertebrae was constant in the cervical region, where an increase was seen until T12, and a decrease in the lumbar region. A similar pattern was found in the porcine vertebrae, although the increase in pedicle height started in the lower thoracic region (Fig. 8a; Table 5). Absolute values of pedicle height and patterns within the region were significantly comparable in the cervical and lower thoracic regions (Tables 4, 5).
Pedicle angles were comparable in the thoracic regions, whereas the pattern within the region was only comparable in the high thoracic region.
Pedicle width in relationship to upper end-plate width was not comparable in any region due to the differences in upper end-plate width. However, the pattern within the regions was comparable in the thoracic regions. The relationship between pedicle height and vertebral body height was comparable in the lumbar region, and the pattern within the regions was comparable in the cervical, high thoracic, and lumbar region (Fig 8c; Tables 4, 5).
Discussion
Due to limited availability of human cadaver spines, researchers are constantly seeking for representative animal models that reflect the biomechanical and anatomical characteristics of the human spine. However, humans have no true representative in the animal kingdom and compromises must be made. As the pig is claimed to be the most representative animal model for spinal research [1–3, 5, 18], we chose it for our extensive descriptive comparison of the anatomical characteristics. The comparative biomechanical characteristics of these specimens were presented elsewhere [11]. The largest advantage over previous studies lies in the comparison of both species in one study with an identical measuring and scanning protocol. The results are truly comparable, which was evident by the very good classification of the intraclass and interclass correlations (Table 1).
The vertebral body heights were highly similar in the human and porcine vertebrae. However, the width and depth of the end-plates increased more caudally in the human spine, likely because of the upright position. The human spine demands relatively larger caudal vertebral bodies to balance the higher longitudinal loads. This was also probably the explanation for the larger intervertebral discs heights observed in the human spine in this study, which were up to four times as large as the porcine disc heights in the lumbar region.
Human thoracic vertebrae had more pronounced transverse processes, likely related to the more pronounced postural muscles seen in humans, compared to pigs.
When comparing pedicle width and height, conclusion can be made that porcine vertebrae can be a representative model when testing instrumentation techniques involving the pedicles and pedicle screw fixation; particularly, the pedicle width showed remarkable resemblances. This was also noticed by McLain et al. [2] who used L4 vertebrae of immature Landrace pigs of 60 kg. Dath et al. [17] found larger values for pedicle width and height in the porcine vertebrae, probably because of the older porcine cadavers they used (18–24 months).
The kyphotic and lordotic curvatures were different in the two species. It should be taken into account that these angular dimensions are possibly changed due to loss of muscle tone after death and the release of soft tissues on excision. However, the handling of the cadaver specimens was similar in the two species and therefore the results are still comparable.
When comparing present results of human dimensions with known literature from Panjabi et al. [19–21], striking resemblances were seen in pedicle width and height, spinal canal width and depth, and transverse processus length in all spinal regions. Spinous processus length was measured to the middle of the vertebral body in studies of Panjabi et al., contrary to the present study. However, taking this offset into account, the pattern for the different regions was very similar [19–21].
For comparison of porcine dimensions with literature, data of the lumbar spine were available from Dath et al. [17]. However, as mentioned before, Dath et al. used older porcine specimens; so therefore all their dimensions were 1.3–1.5 times larger than found in present study. Bozkus et al. [1] studied the thoracic spine of pigs of 30 kg and all dimensions which were measured in the same manner were highly comparable with on average less than 10% difference in vertebral body height, intervertebral disc height, upper and lower end-plate width, spinal canal depth and width, and pedicle width.
Limitations of this study were the small sample size and the difference in age between the two species. As mentioned earlier, human cadaver spines are difficult to obtain and therefore only six spines could be used in this study. The human specimens varied from 55 to 84 years at time of death, while the porcine spines were obtained from 4-month-old pigs. The pigs were not fully grown and this should be taken into account when comparing the older human and younger porcine vertebrae. Generally, it is not possible to obtain younger human cadaver specimens, and in many countries it is very difficult as well to obtain older porcine specimens due to regulations in the food industry. Pigs are being slaughtered around the age of 4 months, and therefore many in vitro tests are being performed with specimens around that age. The goal of this study was to determine whether the porcine spine can be a representative model for the human spine in studies using cadaver spines. Therefore an overview was generated for both the absolute values of all dimensions, as well as the patterns within the different spinal regions, and the ratios within the individual vertebrae. In this way, researchers can choose which information is useful for decision making in their specific study. A different way for comparing the species could be normalisation of all dimensions to, for example, total spine length. However, in this study, the total spine length was exactly similar in the two species, but the number of vertebrae was different. Therefore we chose to emphasize on absolute values, patterns within the regions, and ratios within the individual vertebrae to precisely describe the differences and similarities between human and porcine vertebrae.
It is difficult to specify the exact situations in which the porcine spine could be a representative model for the human spine, as different studies have different specific research questions, and researchers emphasize on different details. In general, the porcine spine could be used in studies testing new implants using pedicle screws and spinal fusion. Furthermore, new operative techniques could be tested in porcine spines. The largest difference was seen in the intervertebral disc, and therefore the porcine spine does not appear to be the most representative model when testing new implants or procedures involving the intervertebral disc.
This study provided a comprehensive quantitative database of the comparative anatomy of vertebrae of the human and porcine spine. This descriptive information can be used to help determine whether the porcine spine can be a representative model for testing of a certain application. When testing new implants and surgical techniques scaling differences should be taken into account, but it is believed that the porcine spine can be a representative anatomical model for the human spine in many specified situations.
Acknowledgments
This research is supported by the Dutch Technology Foundation STW, Applied Science Division of NWO and the Technology Program of the Ministry of Economic Affairs. The authors would like to thank Pieter Lammers, M.D, for his help in measuring the vertebrae. Furthermore, the authors would like to thank the Department of Anatomy and Embryology of the University Medical Center Groningen for their help in preparing the spine specimen. The authors would also like to thank the Department of Radiology of the University Medical Center Groningen and the Department of Radiology of the VU University Amsterdam for their help in making the CT scans of the spine specimens.
Open Access
This article is distributed under the terms of the Creative Commons Attribution Noncommercial License which permits any noncommercial use, distribution, and reproduction in any medium, provided the original author(s) and source are credited.
References
- 1.Bozkus H, Crawford NR, Chamberlain RH, Valenzuela TD, Espinoza A, Yüksel Z, Dickman CA. Comparative anatomy of the porcine and human thoracic spines with reference to thoracoscopic surgical techniques. Surg Endosc. 2005;19:1652–1665. doi: 10.1007/s00464-005-0159-9. [DOI] [PubMed] [Google Scholar]
- 2.McLain RF, Yerby SA, Moseley TA. Comparative morphometry of L4 vertebrae: comparison of large animal models for the human lumbar spine. Spine. 2002;27:E200–E206. doi: 10.1097/00007632-200204150-00005. [DOI] [PubMed] [Google Scholar]
- 3.Smit TH. The use of a quadruped as an in vivo model for the study of the spine—biomechanical considerations. Eur Spine J. 2002;11:137–144. doi: 10.1007/s005860100346. [DOI] [PMC free article] [PubMed] [Google Scholar]
- 4.Goertzen DJ, Lane C, Oxland TR. Neutral zone and range of motion in the spine are greater with stepwise loading than with a continuous loading protocol. An in vitro porcine investigation. J Biomech. 2004;37:257–261. doi: 10.1016/S0021-9290(03)00307-5. [DOI] [PubMed] [Google Scholar]
- 5.Kettler A, Liakos L, Haegele B, Wilke HJ. Are the spines of calf, pig and sheep suitable models for pre-clinical implant tests? Eur Spine J. 2007;16:2186–2192. doi: 10.1007/s00586-007-0485-9. [DOI] [PMC free article] [PubMed] [Google Scholar]
- 6.Schmidt R, Richter M, Claes L, Puhl W, Wilke HJ. Limitations of the cervical porcine spine in evaluating spinal implants in comparison with human cervical spinal segments: a biomechanical in vitro comparison of porcine and human cervical spine specimens with different instrumentation techniques. Spine. 2005;30:1275–1282. doi: 10.1097/01.brs.0000164096.71261.c2. [DOI] [PubMed] [Google Scholar]
- 7.Wilke HJ, Krischak S, Claes L. Biomechanical comparison of calf and human spines. J Orthop Res. 1996;14:500–503. doi: 10.1002/jor.1100140321. [DOI] [PubMed] [Google Scholar]
- 8.Wilke HJ, Krischak ST, Wenger KH, Claes LE. Load–displacement properties of the thoracolumbar calf spine: experimental results and comparison to known human data. Eur Spine J. 1997;6:129–137. doi: 10.1007/BF01358746. [DOI] [PMC free article] [PubMed] [Google Scholar]
- 9.Wilke HJ, Kettler A, Claes LE. Are sheep spines a valid biomechanical model for human spines? Spine. 1997;22:2365–2374. doi: 10.1097/00007632-199710150-00009. [DOI] [PubMed] [Google Scholar]
- 10.Yingling VR, Callaghan JP, McGill SM. The porcine cervical spine as a model of the human lumbar spine: an anatomical, geometric, and functional comparison. J Spinal Disord. 1999;12:415–423. [PubMed] [Google Scholar]
- 11.Busscher I, van der Veen AJ, van Dieën JH, Kingma I, Verkerke GJ, Veldhuizen AG (2009) In vitro biomechanical characteristics of the spine: a comparison between human and porcine spinal segments. Spine 34 (26), 15 December 2009 [DOI] [PubMed]
- 12.Kiefer A, Shirazi-Adl A, Parnianpour M. Stability of the human spine in neutral postures. Eur Spine J. 1997;6:45–53. doi: 10.1007/BF01676574. [DOI] [PMC free article] [PubMed] [Google Scholar]
- 13.Yoganandan N, Kumaresan S, Voo L, Pintar FA. Finite element applications in human cervical spine modeling. Spine. 1996;21:1824–1834. doi: 10.1097/00007632-199608010-00022. [DOI] [PubMed] [Google Scholar]
- 14.Wilke HJ, Kettler A, Wenger KH, Claes LE. Anatomy of the sheep spine and its comparison to the human spine. Anat Rec. 1997;247:542–555. doi: 10.1002/(SICI)1097-0185(199704)247:4<542::AID-AR13>3.0.CO;2-P. [DOI] [PubMed] [Google Scholar]
- 15.Cotterill PC, Kostuik JP, D’Angelo G, Fernie GR, Maki BE. An anatomical comparison of the human and bovine thoracolumbar spine. J Orthop Res. 1986;4:298–303. doi: 10.1002/jor.1100040306. [DOI] [PubMed] [Google Scholar]
- 16.Kumar N, Kukreti S, Ishaque M, Mulholland R. Anatomy of deer spine and its comparison to the human spine. Anat Rec. 2000;260:189–203. doi: 10.1002/1097-0185(20001001)260:2<189::AID-AR80>3.0.CO;2-N. [DOI] [PubMed] [Google Scholar]
- 17.Dath R, Ebinesan AD, Porter KM, Miles AW. Anatomical measurements of porcine lumbar vertebrae. Clin Biomech (Bristol Avon) 2007;22:607–613. doi: 10.1016/j.clinbiomech.2007.01.014. [DOI] [PubMed] [Google Scholar]
- 18.Goel VK, Panjabi MM, Patwardhan AG, Dooris AP, Serhan H. Test protocols for evaluation of spinal implants. J Bone Joint Surg Am. 2006;88(2):103–109. doi: 10.2106/JBJS.E.01363. [DOI] [PubMed] [Google Scholar]
- 19.Panjabi MM, Takata K, Goel V, Federico D, Oxland T, Duranceau J, Krag M. Thoracic human vertebrae. Quantitative three-dimensional anatomy. Spine. 1991;16:888–901. doi: 10.1097/00007632-199108000-00006. [DOI] [PubMed] [Google Scholar]
- 20.Panjabi MM, Duranceau J, Goel V, Oxland T, Takata K. Cervical human vertebrae. Quantitative three-dimensional anatomy of the middle and lower regions. Spine. 1991;16:861–869. doi: 10.1097/00007632-199108000-00001. [DOI] [PubMed] [Google Scholar]
- 21.Panjabi MM, Goel V, Oxland T, Takata K, Duranceau J, Krag M, Price M. Human lumbar vertebrae. Quantitative three-dimensional anatomy. Spine. 1992;17:299–306. doi: 10.1097/00007632-199203000-00010. [DOI] [PubMed] [Google Scholar]


