

Abstract
Background
Serotonin 1A receptors (5-HT1A) are implicated in major depressive disorder (MDD). We previously reported higher 5-HT1A binding potential (BPF=Bavail/KD) in antidepressant naïve MDD subjects compared to controls while other studies report lower BPND(BPND=fNDBavail/KD). Discrepancies can be related to differences in study population or methodology. We sought to replicate our findings in a novel cohort and determine whether choice of reference region and outcome measure could explain discrepancies.
Methods
Nine new controls and 22 new not recently medicated (4 years, NRM) MDD subjects underwent positron emission tomography with [11C]WAY100635. BPF and BPND were determined using a metabolite and free fraction corrected arterial input function. BPND was also determined using cerebellar gray matter (CGM) and cerebellar white matter (CWM) reference regions as input functions.
Results
BPF is higher in the new NRM cohort (p=0.037) compared to new controls, which is comparable to the effect in the previous cohort (p=0.04). We combined the cohorts to examine the effects of the reference region and outcome measure. In the combined cohort, BPF is higher in the NRM compared to controls (p=0.0001). Neither BPND using CWM (p=0.86) nor VT (p=0.374) differs between groups. When CGM is used, the NRM group has lower 5HT1A BPND compared with controls (p=0.03). CGM VT is higher in NRM compared to controls (p=0.007).
Conclusions
Choice of reference region and outcome measure can produce different 5-HT1A findings in MDD. Higher 5-HT1A BPF in MDD was found with the method with fewest assumptions about nonspecific binding and a reference region without receptors.
Keywords: Unipolar, genotype, polymorphism, medication, antidepressants, modeling
Introduction
[11C]WAY-100635 is a serotonin 1A receptor (5-HT1A) antagonist PET ligand.(1-9) We first reported higher 5-HT1A binding potential (BPF=Bavail/KD) in antidepressant-naïve (AN) subjects with major depressive disorder (MDD) compared to antidepressant-exposed (AE) MDD subjects and controls.(10) Also, raphe nuclei (RN) BPF increases with G allele load of the functional 5-HT1A G(-1019)C promoter polymorphism(10), elevated BPF predicts non-response to antidepressants(11), and remitted depressed have higher BPF compared to controls.(12) Other PET studies have reported lower 5-HT1A BPND=fNDBavail/KD in MDD.(9, 13)
Two explanations are differences in study population or in methodology. We sought to replicate our findings and reconcile the seemingly disparate findings. For the former, we studied a new cohort of 9 controls and 22 MDD. For the latter we compared two different reference regions (RR) and two different outcome measures (BPF and BPND) in the combined new and previous cohorts of 51 controls and 30 not recently medicated (NRM). Previously, we found a small number of 5-HT1A receptors in the cerebellar vermis and gray matter (CGM) compared to cerebellar white matter (CWM).(14) We concluded that CWM is the best RR for [11C]WAY-100635 studies because it appears devoid of receptors, is best fit with a one-tissue compartment model, has the lowest binding, better test-retest reliability, identifiability, and time stability. Perhaps unique to [11C]WAY-100635, CWM has the same non-specific binding as CGM ex vivo(15), and therefore can be used to estimate free and non-specific binding in gray matter regions. To determine in vivo extensibility, we have reanalyzed previous 5-HT1A blocking studies.(16) We hypothesized that [11C]WAY-100635 binding in CWM would not change following pindolol, but decrease in CGM. Additionally, we calculated BPND using compartmental modeling and the simplified reference tissue method (SRTM)(17) using both CGM and CWM.
Methods and Materials
Subjects
Thirty subjects who met DSM-IV(18) criteria for a current major depressive episode (MDE) and 51 control subjects were included. Inclusion criteria were assessed through history, chart review, Structured Clinical Interview for DSM IV (SCID I)(19), review of systems, physical examination, routine blood tests, pregnancy test, urine toxicology and EKG. The Beck Depression Inventory(20), Hamilton Depression Rating Scale(21), and Global Assessment Scale(22) assessed subjective and objective depression severity and functional impairment, respectively (Table 1). Criteria for depressed subjects included: 1) age 18 to 65 years; 2) DSM-IV criteria for current MDE and MDD; 3) capacity to provide informed consent and absence of: 4) psychotropic medications for at least 2 weeks (6 weeks for fluoxetine, 4 weeks for neuroleptics); 5) lifetime history of alcohol or substance abuse or dependence; 6) life-time exposure to 3,4-methylenedioxymethamphetamine; 7) significant medical conditions; 8) pregnancy; and 9) psychosis, bipolar disorder, or schizophrenia. Criteria for controls were similar except for the required absence of medical, neurological and psychiatric history or a history of a mood or psychotic disorder in a first-degree relative. The Institutional Review Board of the New York State Psychiatric Institute approved the protocol. Subjects gave written informed consent after an explanation of the study.
Table 1. Clinical and Demographic Data.
| Controls (n=51) |
Not Recently Medicated (n=30) |
p-value (Con vs. NRM) | |
|---|---|---|---|
| Age | 37.35 ± 14.44 | 40.59 ± 13.05 | 0.316 |
| Hamilton Depression Rating Scale | 0.73 ± 0.98 | 26.20 ± 6.98 | <0.001 |
| Years of Education | 16.56 ± 2.89 | 14.36 ± 3.67 | 0.004 |
| Beck Depression Inventory | 1.59 ± 2.53 | 26.43 ± 9.68 | <0.001 |
| Lifetime Aggression | 13.89 ± 3.72 | 17.38 ± 4.90 | 0.001 |
| Global Assessment Scale | 90.25 ± 4.76 | 54.53 ± 11.11 | <0.001 |
| Hopelessness | 1.61 ± 2.33 | 9.60 ± 6.33 | <0.001 |
| Age of Onset | 25.04 ± 13.73 | ||
| No. of MDE's | 13.04 ± 27.41 | ||
| Length of Current MDE | 56.32 ± 125.66 | ||
| % Female | 56.86% | 73.33% | 0.16 |
| Family History of MDD | 56.67% | ||
| Melancholic Depression | 33.33% | ||
| History of Post-traumatic Stress Disorder | 26.7% | ||
| History of Suicide Attempt | 23.3% | ||
| History of Panic Disorder | 20.0% | ||
| History of Dysthymia | 13.3% | ||
| History of Social Phobia | 13.3% |
[11C]WAY-100635 pindolol data come from a separate sample of nine controls, of which six had usable data.(16) Briefly, subjects underwent a baseline [11C]WAY-100635 scan, followed by titrated doses of pindolol CR (7.5 mg/day for 7 days, 22.5 mg/day on day 8, and then 30 mg/day on day 9); a [11C]WAY-100635 scan occurred four hours after the 30 mg dose on day 9.
Prior Medication History
We have shown that AE, medication free MDD have lower BPF values than medication free AN MDD. We defined AE as those being on an adequate dose of antidepressant for at least 4 weeks. Subjects who could not recall the name, dose, or duration of medication were classified as indeterminate (n=13) and not used in imaging data analysis; they were used for genetic analyses. Because we used more stringent criteria for classification, 5 subjects from the previous cohort were reclassified as indeterminate. Since the subjects off of medications for greater than 4 years (n=7) did not differ from the AN subjects in their composite binding data (df=28, t=1.39, p=0.175), we combine these groups and call them not-recently-medicated (NRM). There was no significant difference in demographic or clinical variables between the new and old cohorts (data not shown).
Radiochemistry and Input Function Measurement
Preparation of [11C]WAY-100635 and measurement of the arterial input function, metabolites, and plasma free fraction (fP) were conducted as described previously.(7, 14, 23) Metabolite data are collected during the first 60 minutes; we are unable to quantify metabolites beyond this time point. Injected dose (ID), injected mass (IM), clearance and fP are presented in Table S1 (see Supplement 1). The NRM had a significantly lower IM (df=79; t=3.82; p<0.001) and ID (df=79; t=2.43; p=0.02) than controls. Later studies were done after our human dosimetry study (24) determined the ID (and consequently IM) needed to be lowered. No correlation was found within groups between IM or ID and BPF in any region (data not shown). Analyses were done covarying for IM and ID.
Image Acquisition and Analysis
PET imaging was performed on an ECAT EXACT HR+ (Siemens/CTI, Knoxville, TN). Emission data were collected for 110 minutes as 20 successive frames of increasing duration. Image analysis was performed using MATLAB 2006b (The Mathworks, Natick, MA) with extensions to the following: Functional Magnetic Resonance Imaging of the Brain's Linear Image Registration Tool (FLIRT) v5.2.(25), Brain Extraction Tool v1.2(26), Statistical Parametric Mapping (SPM5) normalization(27), and segmentation routines.(28) To correct for subject motion during the PET scan, de-noising filter techniques were applied to all PET images starting at frame five. All frames were aligned using rigid body FLIRT to the eighth frame. A mean of motion corrected frames eight through eighteen was registered to the MRI using FLIRT.
Acquisition of T1-weighted magnetic resonance image (MRI) for co-registration of PET images and identification of regions of interest (ROIs) was performed as previously described using a 1.5 T Signa Advantage or a 3 T Signa HDx system (General Electric, Milwaukee, WI).(7) ROIs were hand drawn on the MRI by experienced technicians trained to reliably approximate these regions using brain atlases(29, 30) and published reports.(31, 32) ROIs included the amygdala (AMY), hippocampus (HIP), parahippocampal gyrus (PHG), temporal cortex (TEM), anterior cingulate (ACN), cingulate cortex (CIN), dorsolateral prefrontal cortex (DLPFC), medial PFC (MPFC), ventral PFC (VPFC), insular cortex (INS), occipital cortex (OCC) and parietal cortex (PAR). A fixed volume elliptical ROI (2cm3) was placed on the raphe nuclei (RN) in the dorsal midbrain on a mean PET image, as described in(10) Cylindrical ROIs were drawn in the CWM(14) and CGM, as far as possible from the occipital cortex. The ROI contours were refined using the segmented MRI to reflect the gyral pattern and differences between the PET and MRI fields of view.
Derivation of Regional Outcome Measures
The outcome measure of choice in PET studies is Bavail, the total number of available receptors. Without multiple injections and occupancy of the receptors, current technology permits measurement of BPF=Bavail/KD. Fortunately, there is no evidence for alterations in 5-HT1A KD in depression.(33) BPND=fNDBavail/KD requires a further assumption: that depressed subjects and controls do not differ in fND.
Regional distribution volumes of [11C]WAY-100635 are derived from kinetic analysis using the arterial input function and a two-tissue compartment (2T) model.(7) VND and VS are defined as the distribution volumes of the nondisplaceable and specific compartments, respectively.(34-36) VT is defined as the total regional equilibrium distribution volume, =VND+VS. Time activity curves were fit with a 2T model, with the K1/k2 ratio fixed to that of the CWM (RR). For CWM, a 1T model was used.(14) BPF was calculated as (VT(ROI)−VT(CER))/fP. The contribution of plasma total activity to the regional activity was calculated assuming a 5% blood volume in the ROI and subtracted from the regional activity prior to analysis. Kinetic parameters were derived by nonlinear regression using MATLAB. For comparison purposes, BPND was calculated using VT from the 2T model (VT(ROI)−VT(CER)/VT(CER)) and directly from SRTM(17), with both CGM and CWM as RR. For our additional examination of RR using human pindolol data, we estimated VT/fP. This measure of binding does not require a RR, and corrects for differences in free tracer in plasma.(37) We compared VT/fP before and after blockade with pindolol in CGM and CWM. CGM VT was fit with a 2T model, as previously described.(14)
Voxel Based Analysis
VT maps were created by applying Basis Pursuit on a voxel-by-voxel level using DEPICT.(38) BPF maps were transformed onto the MRI by applying the PET to MRI transformation parameters obtained during co-registration. Each subjects' MRI image was processed with Freesurfer v4.05 (http://surfer.nmr.mgh.harvard.edu/). Freesurfer was used in conjunction with SPM5 derived gray, white and cerebrospinal fluid maps to remove the skull from MRI images after they were bias corrected and intensity normalized. Skull stripped MRI images were non-linearly registered to SPM5 single subject Montreal Neurological Institute (MNI) space using the Automated Registration Toolbox (ART).(39) The resulting non-linear transforms were applied to MRI co-registered BPF maps to bring them into MNI space. Before analysis, all images were smoothed using an 8-mm full width half maximum gaussian kernel. Using SPM5, a student t-test assuming independence and unequal variance with no covariates was conducted when comparing groups. A mask was applied to remove the non-brain areas and the entire cerebellum from the analysis. Grand-mean scaling or global normalization was not applied, as BPF is an absolute measurement. Height threshold was set a priori to p<0.005 with False Discovery Rate correction, the extent threshold was set to p<0.05 corresponding to a cluster size k>5000 voxels.
Genotyping the C(-1019)G Polymorphism
Genotyping of the C(-1019)G polymorphism of the 5-HT1A receptor gene was performed using allele-specific polymerase chain reaction (PCR) amplification.(10)
Statistical analysis
To borrow strength across all ROIs and to properly account for correlation among ROIs in the same subject, we fit linear mixed-effects models to the ROI-level BPF or BPND estimates with region and diagnostic group as fixed effects and subject as the random effect. Such a model provides a powerful test of our primary hypothesis without the necessity of dealing with multiple comparison issues. Letting Yij denote the response from the ith region and jth subject, the model is Yij = μ + γi + Bj + εij, where μ represents an overall mean, γi the effect of the ith region, Bj the random subject effect, assumed to be normally distributed, independently of the other subject effects, with mean zero and unknown variance σB2, and εij is the error, also assumed to be independent of the other errors and of the subject effects and normally distributed with mean zero and variance σ2. In our analyses we used log-transformed binding potentials as responses. For our data we have available estimated standard errors computed using a bootstrap algorithm that takes into account errors in metabolite, plasma, and brain data(48) and thus we weighted the observations accordingly.
Additional statistical analyses include Student's and paired t-tests, and Fisher's exact test performed in Excel (Microsoft, 2003) or SPSS 17.0 (SPSS Statistics, 2008).
Results
Replication
The previous cohort NRM have higher [11C]WAY-100635 BPF compared to previous controls (df=1, 48; F=4.621; p=0.037). The new cohort NRM have higher [11C]WAY-100635 BPF compared to the new controls (df=1,29; F=4.606; p=0.04, Figure 1). Combining the previous and new cohort NRM and controls, the NRM have higher BPF than controls (df=1,79; F=17.77; p=0.0001; Figure 2). As mentioned above, groups differed in ID and IM. When IM is added to the model the p value is unchanged. When ID is added, p=0.0006. Within the combined group of 51 controls, we also find higher BPF in females compared to males (df=1,49; F=5.16; p=0.0276) and an inverse correlation between total lifetime aggression and BPF in the raphe (R2=0.12; p=0.001) and VPFC (R2=0.05; p=0.025), consistent with previous findings(49). When sex and aggression are included in the analysis the group effect remains (df=1,75; F=16.59; p=0.0001).
Figure 1.

Binding potential (BPF) differs in not recently medicated (NRM) subjects compared to controls in the old cohort (p=0.037) and new cohort (p=0.04). The height of the bars indicates the weighted mean BPF for each ROI (RN=raphe nuclei, AMY=amygdala, HIP=hippocampus, PHG=parahippocampal gyrus, TEM=temporal cortex, ACN=anterior cingulate, CIN=cingulate body, DLPFC=dorsolateral prefrontal cortex, MPFC=medial prefrontal cortex, VPFC=ventrolateral prefrontal cortex, INS=insula, OCC=occipital cortex, PAR=parietal cortex); the error bars represent the corresponding equivalent of the standard deviations of the weighted means for each ROI.
Figure 2.

Voxel based analysis. All PET data was registered using each individual's MRI to the MNI single subject MRI template (first row). Individual BPF maps were averaged voxel-by-voxel in the control (CTR; second row) and NRM (third row) groups. The CTR average image is subtracted from the NRM average image (fourth row) to show regions that have greater average 5-HT1A receptor binding in NRM subjects. Statistically significant regions (p < 0.005) with greater BPF in the NRM group were calculated with an SPM5 parametric analysis, False Discovery Rate corrected for multiple comparisons, extent threshold set to p < 0.05 corresponding to a cluster size k>5000 voxels (fifth row). The top colorbar represents the BPF value in the images of rows two to four. The bottom colorbar represents the t score in row five image, where a t score of t>2.75 corresponds to p=0.005. MNI coordinates of displayed cross sections are given above SPM images.
Reconciliation
All subsequent analyses consider the combined previous and new cohorts of NRM and controls. We find no differences between the NRM and controls when BPND is estimated from a 2T model with CWM as a RR (df=1,79; F=0.03; p=0.86). There is no difference when using BPND from SRTM with CWM as RR (df=1,77; F=0.00; p=0.99). However, a group effect is found when BPND is estimated using SRTM with CGM, not CWM, as the RR (df=1,78; F=4.63; p=0.034; Figure 3). This could be explained by a difference in CGM VT between NRM and controls, as there are a small but quantifiable number of 5-HT1A in the CGM.(14) In fact, CWM VT is different from CGM VT (df=1,18; t=16.2; p < 0.0001). CGM VT generates a group effect (df=1,79; F=7.59; p=0.0072; Figure S1 in Supplement 1). CWM VT has no group effect (df=1,79; F=0.76; p=0.39). Although there is no difference between groups in VT across all 13 ROIs (df=1,79; F=0.199; p=0.374), we do find higher VT/fP in NRM than in controls (df=1,79; F=17.9; p=0.00001; Figure 4).
Figure 3.

BPND calculated using the simplified reference tissue model (SRTM) using cerebellar gray matter as the RR. The groups differ significantly (df=1,78; F=4.63; p=0.034).
Figure 4.
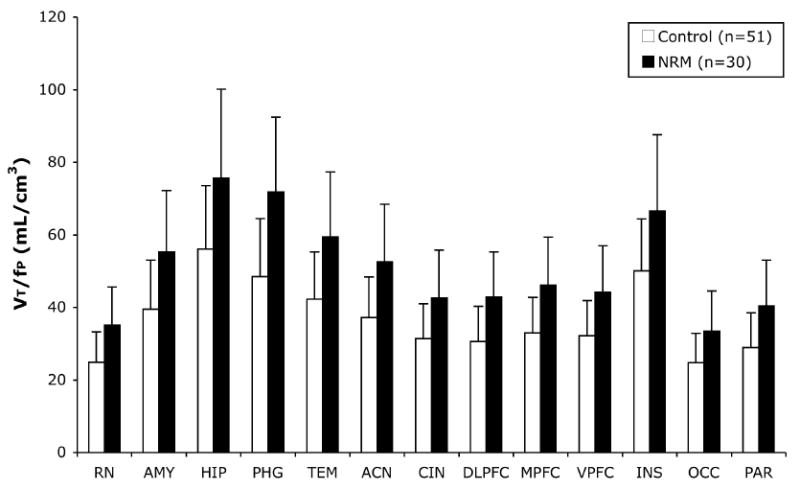
The volume of distribution corrected for the free fraction of [11C]WAY 100635 in plasma (VT/fP) across 13 ROIs differs in control and NRM subjects (df=1,79; F=17.9; p=0.00001). The height of the bars represents the weighted mean VT/fP for each ROI; the error bars are the corresponding equivalent of the standard deviation of the weighted means.
Genotype
The MDD group differs significantly from controls in both the C(-1019)G polymorphism genotype (Fisher's Exact test; p=0.0032) and allele frequency (Fisher's Exact test; p=0.0082; Table S2 in Supplement 1). A description of genotype by cohort can be found in Table S2 of Supplement 1. Assuming the difference in binding is the same between the CC and the CG groups as it is between the CG and GG groups and not considering effects of diagnosis, raphe nuclei BPF increases as expected with G allele load (GG>CG>CC; df=1,78; F=7.13; p=0.009; Figure S2 in Supplement 1). However, the effect does not remain when BPND from a 2T model is used in place of BPF (df=1,78; F=0.152; p=0.697).
Free fraction
There is no difference in fP between NRM and controls in the previous cohort (df=29; t=1.82; p=0.074). However, fP does differ in the new cohort (df=29; t=2.20; p=0.036) and combined cohort (df=79; t=3.86, p < 0.001; Table S1 in Supplement 1).
Pindolol
In a separate group of subjects, there is no difference in CWM VT/fP between baseline and pindolol blockade (df=5, t=1.99, p=0.10), yet a 29.1% reduction in CGM VT/fP following pindolol blockade (df=5, t=2.94, p=0.032). Estimating BPND for CGM using a 2T model with CWM as the RR, we find a 34.9% reduction in CGM BPND following pindolol blockade (df=5, t=2.63, p=0.047). K1 for CWM (df=5, t=0.064, p=0.95) and CGM (df=5, t=0.032, p=0.98) is unchanged between baseline and pindolol blockade (Table 2).
Table 2. Means and Standard Deviations of VT/fP and K1 for Cerebellar White and Gray Matter.
| Outcome Measure | Baseline | Pindolol Blockade | |
|---|---|---|---|
| Cerebellar White Matter | VT/fP (mL/cm3) | 7.33 ± 1.19 | 6.02 ± 0.63 |
| K1 (mL/cm3/min) | 0.056 ± 0.019 | 0.055 ± 0.012 | |
| Cerebellar Gray Matter | VT/fP (mL/cm3) | 13.18 ± 2.47 | 8.95 ± 1.17 |
| K1 (mL/cm3/min) | 0.081 ± 0.023 | 0.080 ± 0.018 |
Discussion
Replication
We sought to replicate our findings and to reconcile our data with previous publications. In the previous cohort, new cohort and in the combined cohort of 51 controls and 30 NRM MDD subjects, NRM have higher 5HT1A BPF compared to controls (Figure 1). This was the case even though the second cohort included only 9 healthy controls. Strikingly, the magnitude of difference between control and NRM MDD subjects is nearly identical to that observed in the previous cohort (32.2% vs 32.6%).
Several lines of corroborating evidence support higher 5-HT1A in depression. There is higher 5-HT1A binding in the dorsal raphe of a mouse strain in-bred for learned helplessness.(50) Fluoxetine treatment simultaneously reduced 5-HT1A and depressive behavior. 5-HT1A is increased along with increased depressive phenotype in mice treated with retinoic acid.(51) 5-HT1A is increased in isolation-housed mice, and there are greater changes in 5-HT1A after citalopram treatment in isolation-housed mice than in group-housed mice.(52) 5-HT1A mRNA is increased in response to isolation-housing(53) and other stressors like repeated exposure to forced swimming.(54) Prenatal stress in rats induced 5-HT1A mRNA increases that were associated with behavioral changes, which were reversed by antidepressant treatment.(55)
Genetic studies have established a relationship between higher 5-HT1A and depressive phenotype. The GG polymorphism of the C(-1019)G promoter, which is associated with depression and suicide, (56, 57) is also associated with higher 5-HT1A binding(10, 11) and with a greater likelihood of developing interferon-induced depression.(58)
Treatment studies support the hypothesis of higher 5-HT1A in depression. The proposed mechanism of action of SSRIs hinges on the presence of higher autoinhibitory 5-HT1A receptors in depression.(59) Chronic, but not acute, exposure to SSRIs desensitizes somatodendritic 5-HT1A autoreceptors in the RN, but not hippocampal postsynaptic 5-HT1A receptors, providing a mechanism of action for antidepressant medication that explains the lag in clinical treatment response.(60) Pindolol augmentation during SSRI treatment is thought to speed the efficacy of SSRIs by blocking 5-HT1A receptors.(61, 62) However, pindolol occupancy of 5-HT1A receptors is relatively low; thus, higher doses (e.g., 15 mg/day) may be more effective.(63) Gur et al. found that chronic repetitive transcranial magnetic stimulation, associated with clinical remission, induced subsensitivity of presynaptic 5-HT1A receptors in RN.(64)
There is considerable discrepancy among post-mortem studies of 5-HT1A in depression, some finding no change, (65-68) increased, (33, 69-73) and decreased binding.(74)
Overall, there is substantial evidence supporting an increase of 5-HT1A receptors in MDD.
Model
We have shown 5-HT1A BPF (Bavail/KD) is higher in NRM subjects compared to controls. Further, we have shown that BPF in the RN increases with increasing G alleles of the functional G(-1019)C promoter polymorphism.(10, 40) A greater “load” of G alleles has been associated in some studies with less response to SSRIs.(75) In a naturalistic study, we have shown that non-responders to antidepressants have both a higher frequency of the G allele and higher BPF.(11) These data suggest a model of depression driven by this polymorphism. In these subjects, the presence of more G alleles increases the number of auto-inhibitory 5-HT1A receptors in the RN, resulting in decreased release of 5-HT from serotonergic neurons in cortical regions. Lower serotonin release could potentially be associated with a homeostatic upregulation of the postsynaptic 5-HT1A. Certainly, it is likely that not all depressive syndromes emerge via this pathway.
Reconciliation
The second goal of this study was to reconcile our findings with others. We examined alternate modeling methods and RRs. We report increased 5-HT1A in NRM compared to controls using BPF from a 2T model; yet BPND from a 2T model yields no difference between groups. This finding is not due to method, as there is also no difference between groups if we use BPND from SRTM. However, if CGM is used as the RR, despite the very low concentration of 5-HT1A, there is a small but statistically significant difference in BPND between groups, in the opposite direction; depressed subjects have lower BPND compared to controls. BPND (BPP/VT(REF)) is sensitive to small changes in VT(REF) particularly when VT(REF) is ≪1, as is the case for [11C]WAY-100635. NRM have increased 5-HT1A VT(REF) in CGM compared to controls. No differences in VT(REF) are found in CWM. This is not dependent on the placement of the RR ROIs, for either for CWM or CGM. If we compare VT determined by our ROI in the CWM to VT determined from the entire CWM, there is no difference (R2=0.975, slope=0.97, intercept=0.16, p < 0.001, n=39). Similarly, if we measure VT in the CGM ROI and compare it to the total gray matter VT in the cerebellum, there is no difference (R2=0.979, slope=1.03, intercept=-0.33, p < 0.001, n=11). Therefore ROI positioning should have no effect on our outcome measures or conclusions.
Additional support of CWM as opposed to CGM as a RR for [11C]WAY-100635 comes from our pindolol data. Whereas there is no change in CWM VT/fP following blockade, there is a reduction in CGM VT/fP and BPND. This demonstrates significant, specific, competitive binding to the 5-HT1A receptor in CGM, which leads to systematic bias when using CGM as a RR. Because BPND is based on k3 and k4, changes following pindolol are entirely due to changes in specific binding. Conversely, the lack of change in CWM following pindolol blockade bolsters its use as a valid measure of nonspecific binding. While it is possible that pindolol administration may have led to reductions in blood flow, thus impacting cerebellar VT/fP measures, we observed no change in K1 between baseline and pindolol block scans, suggestive that this did not contribute significantly to our findings.
[11C]WAY-100635 has an excellent signal-to-noise ratio. The very low non-specific binding (as evidenced by CWM and CGM VT(REF) values of 0.2 to 0.6) makes the quantification of binding in the RR difficult. When the concentration of radioactivity in a region of the brain is this low, quantification can be affected by several factors including the presence of a radioactive metabolite, improper scatter correction, improper blood volume correction, etc. While SRTM is very appropriate for some tracers, this very low non-specific binding makes quantification of [11C]WAY-100635 binding very difficult. For example, if we simulate data using the 2T model and then fit with SRTM, SRTM always underestimates BPND in the range of physiological cerebellar VT(REF) (Figure S3 in Supplement 1). Large differences in estimated BPND (from ∼7.5 to 5.5, approximately a 30% change) can arise from very small changes (0.3 to 0.5) in cerebellar VT(REF). The implications of this are that 5-HT1A studies conducted in vivo with [11C]WAY-100635 are best done with an arterial input function and the outcome measure of either BPF or VT/fP.
These findings indicate that the choice of the outcome measure and RR profoundly influence the results when using [11C]WAY-100635. One other publication showed lower BPP in depressed subjects, but did not confirm decreased BPND using either CGM or CWM.(41) These authors did not measure fP; hence, BPF is not available. When we replicate their modeling methods (60 minutes of scanning, a 2T model, restricted to first episode subjects, etc) we cannot replicate the BPP findings (data not shown). Potential discrepancies are genetics (unavailable), image processing methods or power. We are working with the corresponding author to understand this dataset better.
Interestingly, one group has an in vitro study showing higher 5-HT1A in a monkey model of depression(76), while the PET study, using BPND as outcome measure and cerebellar cortex as RR, showed lower 5-HT1A in the same animals.(77) Choice of outcome measure and RR may perturb results from the PET studies, thus accounting for the seemingly discrepant findings within the same lab.
Finally, to help choose an outcome measure, we compared PET outcome measures to data obtained from other modalities. Post mortem studies have demonstrated higher 5-HT1A in females compared to males.(33) Genetic studies predict higher 5-HT1A in the RN with increasing G allele load(56) and predict lack of response to SSRIs.(75) Challenge studies have shown an inverse relationship between aggression and 5-HT1A.(78) In each of these cases, BPF and not BPND demonstrates the expected result giving indirect support for this outcome measure (Table 3).
Table 3. Comparison of Outcome Measure: Contrasts Based on Known Group Differences from Non-imaging Modalities.
| Sex effect | Genotype | Treatment Responders vs. Non Responders | Lifetime Aggression Score | ||
|---|---|---|---|---|---|
| Outcome Measure | BPF | Females > Males; p = 0.028 | GG>CG>CC; p = 0.009 | NonResponders > Responders; p = 0.03 | Inverse correlation; R2 = 0.12, p = 0.001 |
| BPND | No difference; p = 0.497 | No difference; p = 0.697 | No Difference; p = 0.453 | No significant relationship | |
Free Fraction
While fP is different between groups, this effect does not drive the primary finding. In the previous cohort, fP was not different and we still had higher 5-HT1A in NRM. Also, if we use an outcome measure independent of fP (BPP=fPBavail/KD), we detect differences between groups in the expected direction (p=0.0001, data not shown). Furthermore, the differences in mean fP are small and the values overlap to such an extent that they could not be used as surrogate markers for depression.
Statistical Analysis
One of the concerns of brain imaging studies is the issue of multiple comparisons and the high degree of correlation. We addressed these issues by testing for a group difference simultaneously for all regions in the model while allowing for region effects. If the group effect is proportional to mean binding in each region, additional power can be gained by analyzing the log-transformed data, which has the side benefit of stabilizing the variance. The log transform was used in previous PET studies by our group and others to address these issues(10, 11, 40-45). Others have alternate strategies, including linearizing transformation(46) and non-parametric testing(47). As the natural log is a monotone transformation, demonstrating a difference in log(BPF) is equivalent to demonstrating a difference (in the same direction) in BPF. Our principal hypothesis that there is a difference between groups specifies that differences in each ROI are proportional to each ROI's binding level.
Conclusions
We find increased 5-HT1A BPF in all brain regions of NRM compared to controls. This may be due in part to greater 5-HT1A gene expression. More autoreceptor binding may result in less serotonin neuron firing and hypofunction consistent with the indoleamine hypothesis of major depression. Reversal of that effect by antidepressants may exert an effect in some subjects but perhaps not in treatment resistant subjects, highlighting the need for antidepressants with alternative mechanisms of action. Additionally, the choice of outcome measure and RR profoundly affects the interpretation of the results.
Supplementary Material
Acknowledgement and Project Support
We would like to thanks Drs. Marc Laruelle, Anissa Abi-Dargham, Mark Slifstein, and Diana Martinez for access to the pindolol data. We would like to thank the employees of the Conte Center for the Neurobiology of Major Depression, the Kreitchman PET Center, and the Radioligand Laboratory for expert help. We would also like to thank Dr. Richard Carson for illuminating discussions. This work was supported by United States Public Health Service grants, MH40695, MH62185, and National Alliance for Research on Schizophrenia and Depression (NARSAD).
Footnotes
Conflict of Interests and Financial Disclosures: Dr. Parsey has received PET imaging grants from Novartis Pharmaceuticals, Sepracor, Inc., Pfizer, and Eli Lilly Company, unrelated to the current manuscript. Dr. Miller has received financial compensation for psychiatric evaluations of subjects enrolled in medication studies sponsored by Pfizer and Orexigen Therapeutics, unrelated to this paper. Dr. Sullivan has been on speakers' bureaus for Pfizer and GSK, owned stock in Pfizer, and has a patent application for use of tianeptine, all unrelated to the current manuscript. Dr. Oquendo received financial compensation from Pfizer for the safety evaluation of a clinical facility, unrelated to the current manuscript, and was the recipient of a grant from Eli Lilly to support a year of salary for the Lilly Suicide Scholar, Enrique Baca-Garcia, M.D., Ph.D. Dr. Mann is principal investigator on PET Imaging grants from GSK and Novartis, unrelated to the current manuscript. Dr. Ogden, Ms. Tin, Ms. Hesselgrave, Dr. Goldstein, Mr. Mikhno, Dr. Milak and Dr. Zanderigo reported no biomedical financial interests or potential conflicts of interest.
Publisher's Disclaimer: This is a PDF file of an unedited manuscript that has been accepted for publication. As a service to our customers we are providing this early version of the manuscript. The manuscript will undergo copyediting, typesetting, and review of the resulting proof before it is published in its final citable form. Please note that during the production process errors may be discovered which could affect the content, and all legal disclaimers that apply to the journal pertain.
References
- 1.Forster EA, Cliffe IA, Bill DJ, Dover GM, Jones D, Reilly Y, et al. A pharmacological profile of the selective silent 5-HT1A receptor antagonist, WAY-100635. Eur J Pharmacol. 1995;281:81–88. doi: 10.1016/0014-2999(95)00234-c. [DOI] [PubMed] [Google Scholar]
- 2.Gozlan H, Thibault S, Laporte AM, Lima L, Hamon M. The selective 5-HT1A antagonist radioligand [3H]WAY 100635 labels both G-protein-coupled and free 5-HT1A receptors in rat brain membranes. Eur J Pharmacol. 1995;288:173–186. doi: 10.1016/0922-4106(95)90192-2. [DOI] [PubMed] [Google Scholar]
- 3.Gunn RN, Sargent PA, Bench CJ, Rabiner EA, Osman S, Pike VW, et al. Tracer kinetic modeling of the 5-HT1A receptor ligand [carbonyl-11C]WAY- 100635 for PET. Neuroimage. 1998;8:426–440. doi: 10.1006/nimg.1998.0379. [DOI] [PubMed] [Google Scholar]
- 4.Carson RE, Breier A, de Bartolomeis A, Saunders RC, Su TP, Schmall B, et al. Quantification of amphetamine-induced changes in [11C]raclopride binding with continuous infusion. J Cereb Blood Flow Metab. 1997;17:437–447. doi: 10.1097/00004647-199704000-00009. [DOI] [PubMed] [Google Scholar]
- 5.Drevets WC, Frank E, Price JC, Kupfer DJ, Holt D, Greer PJ, et al. PET imaging of serotonin 1A receptor binding in depression. Biol Psychiatry. 1999;46:1375–1387. doi: 10.1016/s0006-3223(99)00189-4. [DOI] [PubMed] [Google Scholar]
- 6.Ito H, Halldin C, Farde L. Localization of 5-HT1A receptors in the living human brain using [carbonyl-11C]WAY-100635: PET with anatomic standardization technique. J Nucl Med. 1999;40:102–109. [PubMed] [Google Scholar]
- 7.Parsey RV, Slifstein M, Hwang DR, Abi-Dargham A, Simpson N, Mawlawi O, et al. Validation and reproducibility of measurement of 5-HT1A receptor parameters with [carbonyl-11C]WAY-100635 in humans: comparison of arterial and reference tisssue input functions. J Cereb Blood Flow Metab. 2000;20:1111–1133. doi: 10.1097/00004647-200007000-00011. [DOI] [PubMed] [Google Scholar]
- 8.Pike VW, McCarron JA, Lammertsma AA, Osman S, Hume SP, Sargent PA, et al. Exquisite delineation of 5-HT1A receptors in human brain with PET and [carbonyl-11 C]WAY-100635. European Journal of Pharmacology. 1996;301:R5–7. doi: 10.1016/0014-2999(96)00079-9. [DOI] [PubMed] [Google Scholar]
- 9.Sargent PA, Kjaer KH, Bench CJ, Rabiner EA, Messa C, Meyer J, et al. Brain serotonin1A receptor binding measured by positron emission tomography with [11C]WAY-100635: effects of depression and antidepressant treatment. Arch Gen Psychiatry. 2000;57:174–180. doi: 10.1001/archpsyc.57.2.174. [DOI] [PubMed] [Google Scholar]
- 10.Parsey RV, Oquendo MA, Ogden RT, Olvet DM, Simpson N, Huang YY, et al. Altered serotonin 1A binding in major depression: a [carbonyl-C-11]WAY100635 positron emission tomography study. Biol Psychiatry. 2006;59:106–113. doi: 10.1016/j.biopsych.2005.06.016. [DOI] [PubMed] [Google Scholar]
- 11.Parsey RV, Olvet DM, Oquendo MA, Huang YY, Ogden RT, Mann JJ. Higher 5-HT1A receptor binding potential during a major depressive episode predicts poor treatment response: preliminary data from a naturalistic study. Neuropsychopharmacology. 2006;31:1745–1749. doi: 10.1038/sj.npp.1300992. [DOI] [PubMed] [Google Scholar]
- 12.Miller JM, Brennan KG, Ogden TR, Oquendo MA, Sullivan GM, Mann JJ, et al. Elevated Serotonin 1A Binding in Remitted Major Depressive Disorder: Evidence for a Trait Biological Abnormality. Neuropsychopharmacology. 2009 doi: 10.1038/npp.2009.54. [DOI] [PMC free article] [PubMed] [Google Scholar]
- 13.Drevets WC, Thase ME, Moses-Kolko EL, Price J, Frank E, Kupfer DJ, et al. Serotonin-1A receptor imaging in recurrent depression: replication and literature review. Nucl Med Biol. 2007;34:865–877. doi: 10.1016/j.nucmedbio.2007.06.008. [DOI] [PMC free article] [PubMed] [Google Scholar]
- 14.Parsey RV, Arango V, Olvet DM, Oquendo M, Van Heertum R, Mann JJ. Regional Heterogeneity of 5-HT1A Receptors in Human Cerebellum as Assessed by Positron Emission Tomograph. J Cerebr Blood F Met. 2005 doi: 10.1038/sj.jcbfm.9600072. [DOI] [PubMed] [Google Scholar]
- 15.Hall H, Lundkvist C, Halldin C, Farde L, Pike VW, McCarron JA, et al. Autoradiographic localization of 5-HT1A receptors in the post-mortem human brain using [3H]WAY-100635 and [11C]way-100635. Brain Research. 1997;745:96–108. doi: 10.1016/s0006-8993(96)01131-6. [DOI] [PubMed] [Google Scholar]
- 16.Martinez D, Hwang D, Mawlawi O, Slifstein M, Kent J, Simpson N, et al. Differential occupancy of somatodendritic and postsynaptic 5HT(1A) receptors by pindolol: a dose-occupancy study with [11C]WAY 100635 and positron emission tomography in humans. Neuropsychopharmacology. 2001;24:209–229. doi: 10.1016/S0893-133X(00)00187-1. [DOI] [PubMed] [Google Scholar]
- 17.Lammertsma AA, Hume SP. Simplified reference tissue model for PET receptor studies. Neuroimage. 1996;4:153–158. doi: 10.1006/nimg.1996.0066. [DOI] [PubMed] [Google Scholar]
- 18.APA. DSM-IV: Diagnostic and Statistical Manual of Mental Disorders. Washington, DC: 1994. [Google Scholar]
- 19.First M, Spitzer R, Gibbon M, Williams J. Structured Clinical Interview for DSM-IV Axis I Disorders (SCID-I/P, Version 2.0) New York: Biometrics Research Dept., New York State Psychiatric Institute; 1995. [Google Scholar]
- 20.Beck AT, Ward CH, Mendelson M, Mock J, Erbauh J. An inventory for measuring depression. Arch Gen Psychiatry. 1961;4:53–63. doi: 10.1001/archpsyc.1961.01710120031004. [DOI] [PubMed] [Google Scholar]
- 21.Hamilton M. A rating scale for depression. J Neurol Neurosurg Psych. 1960;23:56–62. doi: 10.1136/jnnp.23.1.56. [DOI] [PMC free article] [PubMed] [Google Scholar]
- 22.Endicott J, Spitzer RL, Fleiss JL, Cohen J. The global assessment scale. A procedure for measuring overall severity of psychiatric disturbance. Arch Gen Psychiatry. 1976;33:766–771. doi: 10.1001/archpsyc.1976.01770060086012. [DOI] [PubMed] [Google Scholar]
- 23.Parsey RV, Kegeles LS, Hwang DR, Simpson N, Abi-Dargham A, Mawlawi O, et al. In vivo quantification of brain serotonin transporters in humans using [11C]McN 5652. J Nucl Med. 2000;41:1465–1477. [PubMed] [Google Scholar]
- 24.Parsey RV, Belanger MJ, Sullivan GM, Simpson NR, Stabin MG, Van Heertum R, et al. Biodistribution and Radiation Dosimetry of 11C-WAY100,635 in Humans. J Nucl Med. 2005;46:614–619. [PubMed] [Google Scholar]
- 25.Jenkinson M, Smith S. A global optimisation method for robust affine registration of brain images. Medical image analysis. 2001;5:143–156. doi: 10.1016/s1361-8415(01)00036-6. [DOI] [PubMed] [Google Scholar]
- 26.Smith SM. Fast robust automated brain extraction. Hum Brain Mapp. 2002;17:143–155. doi: 10.1002/hbm.10062. [DOI] [PMC free article] [PubMed] [Google Scholar]
- 27.Ashburner J, Friston KJ. Nonlinear spatial normalization using basis functions. Hum Brain Mapp. 1999;7:254–266. doi: 10.1002/(SICI)1097-0193(1999)7:4<254::AID-HBM4>3.0.CO;2-G. [DOI] [PMC free article] [PubMed] [Google Scholar]
- 28.Ashburner J, Friston KJ. Unified segmentation. NeuroImage. 2005;26:839–851. doi: 10.1016/j.neuroimage.2005.02.018. [DOI] [PubMed] [Google Scholar]
- 29.Duvernoy H. The human brain. Surface, three-dimensional sectional anatomy and MRI. New York: Sringer-Verlag Wien; 1991. [Google Scholar]
- 30.Talairach J, Tournoux P. Co-planar stereotactic atlas of the human brain. Three-dimensional proportional system: an approach of cerebral imaging. New York: Theime Medical Publisher; 1988. [Google Scholar]
- 31.Kates WR, Abrams MT, Kaufmann WE, Breiter SN, Reiss AL. Reliability and validity of MRI measurement of the amygdala and hippocampus in children with fragile X syndrome. Psychiatry Research - Neuroimaging. 1997;75:31–48. doi: 10.1016/s0925-4927(97)00019-x. [DOI] [PubMed] [Google Scholar]
- 32.Killiany RJ, Moss MB, Nicholson T, Jolesz F, Sandor T. An interactive procedure for extracting features of the brain from magnetic resonance images: The lobes. Human Brain Mapping. 1997;5:355–363. doi: 10.1002/(SICI)1097-0193(1997)5:5<355::AID-HBM4>3.0.CO;2-2. [DOI] [PubMed] [Google Scholar]
- 33.Arango V, Underwood MD, Gubbi AV, Mann JJ. Localized alterations in pre- and postsynaptic serotonin binding sites in the ventrolateral prefrontal cortex of suicide victims. Brain Res. 1995;688:121–133. doi: 10.1016/0006-8993(95)00523-s. [DOI] [PubMed] [Google Scholar]
- 34.Laruelle M, van Dyck C, Abi-Dargham A, Zea-Ponce Y, Zoghbi SS, Charney DS, et al. Compartmental modeling of iodine-123-iodobenzofuran binding to dopamine D2 receptors in healthy subjects. Journal of Nuclear Medicine. 1994;35:743–754. [PubMed] [Google Scholar]
- 35.Mintun MA, Raichle ME, Kilbourn MR, Wooten GF, Welch MJ. A quantitative model for the in vivo assessment of drug binding sites with positron emission tomography. Ann Neurol. 1984;15:217–227. doi: 10.1002/ana.410150302. [DOI] [PubMed] [Google Scholar]
- 36.Innis RB, Cunningham VJ, Delforge J, Fujita M, Gjedde A, Gunn RN, et al. Consensus nomenclature for in vivo imaging of reversibly binding radioligands. J Cereb Blood Flow Metab. 2007;27:1533–1539. doi: 10.1038/sj.jcbfm.9600493. [DOI] [PubMed] [Google Scholar]
- 37.Theodore WH, Giovacchini G, Bonwetsch R, Bagic A, Reeves-Tyer P, Herscovitch P, et al. The effect of antiepileptic drugs on 5-HT-receptor binding measured by positron emission tomography. Epilepsia. 2006;47:499–503. doi: 10.1111/j.1528-1167.2006.00458.x. [DOI] [PubMed] [Google Scholar]
- 38.Gunn RN, Gunn SR, Turkheimer FE, Aston JA, Cunningham VJ. Positron emission tomography compartmental models: a basis pursuit strategy for kinetic modeling. J Cereb Blood Flow Metab. 2002;22:1425–1439. doi: 10.1097/01.wcb.0000045042.03034.42. [DOI] [PubMed] [Google Scholar]
- 39.Ardekani BA, Guckemus S, Bachman A, Hoptman MJ, Wojtaszek M, Nierenberg J. Quantitative comparison of algorithms for inter-subject registration of 3D volumetric brain MRI scans. J Neurosci Methods. 2005;142:67–76. doi: 10.1016/j.jneumeth.2004.07.014. [DOI] [PubMed] [Google Scholar]
- 40.Parsey RV, Hastings RS, Oquendo MA, Hu X, Goldman D, Huang YY, et al. Effect of a triallelic functional polymorphism of the serotonin-transporter-linked promoter region on expression of serotonin transporter in the human brain. Am J Psychiatry. 2006;163:48–51. doi: 10.1176/appi.ajp.163.1.48. [DOI] [PubMed] [Google Scholar]
- 41.Hirvonen J, Karlsson H, Kajander J, Lepola A, Markkula J, Rasi-Hakala H, et al. Decreased brain serotonin 5-HT1A receptor availability in medication-naive patients with major depressive disorder: an in-vivo imaging study using PET and [carbonyl-11C]WAY-100635. Int J Neuropsychopharmacol. 2008;11:465–476. doi: 10.1017/S1461145707008140. [DOI] [PubMed] [Google Scholar]
- 42.Oquendo MA, Hastings RS, Huang YY, Simpson N, Ogden RT, Hu XZ, et al. Brain serotonin transporter binding in depressed patients with bipolar disorder using positron emission tomography. Arch Gen Psychiatry. 2007;64:201–208. doi: 10.1001/archpsyc.64.2.201. [DOI] [PMC free article] [PubMed] [Google Scholar]
- 43.Parsey RV, Hastings RS, Oquendo MA, Huang YY, Simpson N, Arcement J, et al. Lower serotonin transporter binding potential in the human brain during major depressive episodes. Am J Psychiatry. 2006;163:52–58. doi: 10.1176/appi.ajp.163.1.52. [DOI] [PubMed] [Google Scholar]
- 44.Miller JM, Oquendo MA, Ogden RT, Mann JJ, Parsey RV. Serotonin transporter binding as a possible predictor of one-year remission in major depressive disorder. J Psychiatr Res. 2008;42:1137–1144. doi: 10.1016/j.jpsychires.2008.01.012. [DOI] [PMC free article] [PubMed] [Google Scholar]
- 45.Sullivan GM, Oquendo MA, Simpson N, Van Heertum RL, Mann JJ, Parsey RV. Brain serotonin1A receptor binding in major depression is related to psychic and somatic anxiety. Biol Psychiatry. 2005;58:947–954. doi: 10.1016/j.biopsych.2005.05.006. [DOI] [PubMed] [Google Scholar]
- 46.Rabiner EA, Wilkins MR, Turkheimer F, Gunn RN, Udo de Haes J, de Vries M, et al. 5-Hydroxytryptamine1A receptor occupancy by novel full antagonist 2-[4-[4-(7-chloro-2,3-dihydro-1,4-benzdioxyn-5-yl)-1-piperazinyl]butyl]-1,2-benzi sothiazol-3-(2H)-one-1,1-dioxide: a[11C][O-methyl-3H]-N-(2-(4-(2-methoxyphenyl)-1-piperazinyl)ethyl)-N-(2-pyridinyl)cyclohexanecarboxamide trihydrochloride (WAY-100635) positron emission tomography study in humans. J Pharmacol Exp Ther. 2002;301:1144–1150. doi: 10.1124/jpet.301.3.1144. [DOI] [PubMed] [Google Scholar]
- 47.Meltzer CC, Price JC, Mathis CA, Butters MA, Ziolko SK, Moses-Kolko E, et al. Serotonin 1A receptor binding and treatment response in late-life depression. Neuropsychopharmacology. 2004;29:2258–2265. doi: 10.1038/sj.npp.1300556. [DOI] [PubMed] [Google Scholar]
- 48.Ogden RT, Tarpey T. Estimation in regression models with externally estimated parameters. Biostatistics (Oxford England) 2006;7:115–129. doi: 10.1093/biostatistics/kxi044. [DOI] [PubMed] [Google Scholar]
- 49.Parsey RV, Oquendo MA, Simpson NR, Ogden RT, Van Heertum R, Arango V, et al. Effects of sex, age, and aggressive traits in man on brain serotonin 5-HT(1A) receptor binding potential measured by PET using [C-11]WAY-100635. Brain Res. 2002;954:173–182. doi: 10.1016/s0006-8993(02)03243-2. [DOI] [PubMed] [Google Scholar]
- 50.Naudon L, El Yacoubi M, Vaugeois JM, Leroux-Nicollet I, Costentin J. A chronic treatment with fluoxetine decreases 5-HT(1A) receptors labeling in mice selected as a genetic model of helplessness. Brain Res. 2002;936:68. doi: 10.1016/s0006-8993(02)02548-9. [DOI] [PubMed] [Google Scholar]
- 51.O'Reilly KC, Trent S, Bailey SJ, Lane MA. 13-cis-Retinoic acid alters intracellular serotonin, increases 5-HT1A receptor, and serotonin reuptake transporter levels in vitro. Exp Biol Med (Maywood) 2007;232:1195–1203. doi: 10.3181/0703-RM-83. [DOI] [PubMed] [Google Scholar]
- 52.Gunther L, Liebscher S, Jahkel M, Oehler J. Effects of chronic citalopram treatment on 5-HT(1A) and 5-HT(2A) receptors in group- and isolation-housed mice. Eur J Pharmacol. 2008 doi: 10.1016/j.ejphar.2008.07.011. [DOI] [PubMed] [Google Scholar]
- 53.Del-Bel EA, Joca SR, Padovan CM, Guimarães FS. Effects of isolation-rearing on serotonin-1A and M1-muscarinic receptor messenger RNA expression in the hipocampal formation of rats. Neurosci Lett. 2002;332:123–126. doi: 10.1016/s0304-3940(02)00933-3. [DOI] [PubMed] [Google Scholar]
- 54.Shishkina GT, Kalinina TS, Dygalo NN. Serotonergic changes produced by repeated exposure to forced swimming: correlation with behavior. Ann N Y Acad Sci. 2008;1148:148–153. doi: 10.1196/annals.1410.074. [DOI] [PubMed] [Google Scholar]
- 55.Morley-Fletcher S, Darnaudéry M, Mocaer E, Froger N, Lanfumey L, Laviola G, et al. Chronic treatment with imipramine reverses immobility behaviour, hippocampal corticosteroid receptors and cortical 5-HT(1A) receptor mRNA in prenatally stressed rats. Neuropharmacology. 2004;47:841–847. doi: 10.1016/j.neuropharm.2004.06.011. [DOI] [PubMed] [Google Scholar]
- 56.Lemonde S, Turecki G, Bakish D, Du L, Hrdina PD, Bown CD, et al. Impaired repression at a 5-hydroxytryptamine 1A receptor gene polymorphism associated with major depression and suicide. J Neurosci. 2003;23:8788–8799. doi: 10.1523/JNEUROSCI.23-25-08788.2003. [DOI] [PMC free article] [PubMed] [Google Scholar]
- 57.Albert PR. A Functional Promoter Polymorphism of the 5-HT1A Receptor Gene: Association with Depression and Completed Suicide. Biol Psychiatry. 2004;55:46S. [Google Scholar]
- 58.Kraus MR, Al-Taie O, Schafer A, Pfersdorff M, Lesch KP, Scheurlen M. Serotonin-1A Receptor Gene HTR1A Variation Predicts Interferon-Induced Depression in Chronic Hepatitis C. Gastroenterology. 2007 doi: 10.1053/j.gastro.2007.02.053. [DOI] [PubMed] [Google Scholar]
- 59.Blier P, de Montigny C. Current advances and trends in the treatment of depression. Trends Pharmacol Sci. 1994;15:220–226. doi: 10.1016/0165-6147(94)90315-8. [DOI] [PubMed] [Google Scholar]
- 60.Blier P, de Montigny C, Chaput Y. A role for the serotonin system in the mechanism of action of antidepressant treatments: preclinical evidence. J Clin Psychiatry. 1990;51(Suppl):14–20. discussion 21. [PubMed] [Google Scholar]
- 61.Geretsegger C, Bitterlich W, Stelzig R, Stuppaeck C, Bondy B, Aichhorn W. Paroxetine with pindolol augmentation: a double-blind, randomized, placebo-controlled study in depressed in-patients. Eur Neuropsychopharmacol. 2008;18:141–146. doi: 10.1016/j.euroneuro.2007.09.002. [DOI] [PubMed] [Google Scholar]
- 62.Bordet R, Thomas P, Dupuis B. Effect of pindolol on onset of action of paroxetine in the treatment of major depression: intermediate analysis of a double-blind, placebo-controlled trial. Reseau de Recherche et d'Experimentation Psychopharmacologique. Am J Psychiatry. 1998;155:1346–1351. doi: 10.1176/ajp.155.10.1346. [DOI] [PubMed] [Google Scholar]
- 63.Artigas F, Adell A, Celada P. Pindolol augmentation of antidepressant response. Curr Drug Targets. 2006;7:139–147. doi: 10.2174/138945006775515446. [DOI] [PubMed] [Google Scholar]
- 64.Gur E, Lerer B, Dremencov E, Newman ME. Chronic repetitive transcranial magnetic stimulation induces subsensitivity of presynaptic serotonergic autoreceptor activity in rat brain. Neuroreport. 2000;11:2925–2929. doi: 10.1097/00001756-200009110-00019. [DOI] [PubMed] [Google Scholar]
- 65.Matsubara S, Arora RC, Meltzer HY. Serotonergic measures in suicide brain: 5-HT1A binding sites in frontal cortex of suicide victims. J Neural Transm Gen Sect. 1991;85:181–194. doi: 10.1007/BF01244944. [DOI] [PubMed] [Google Scholar]
- 66.Arranz B, Eriksson A, Mellerup E, Plenge P, Marcusson J. Brain 5-HT1A, 5-HT1D, and 5-HT2 receptors in suicide victims. Biol Psychiatry. 1994;35:457–463. doi: 10.1016/0006-3223(94)90044-2. [DOI] [PubMed] [Google Scholar]
- 67.Stockmeier CA, Shapiro LA, Haycock JW, Thompson PA, Lowy MT. Quantitative subregional distribution of serotonin1A receptors and serotonin transporters in the human dorsal raphe. Brain Res. 1996;727:1–12. doi: 10.1016/0006-8993(96)00239-9. [DOI] [PubMed] [Google Scholar]
- 68.Lowther S, De Paermentier F, Cheetham SC, Crompton MR, Katona CL, Horton RW. 5-HT1A receptor binding sites in post-mortem brain samples from depressed suicides and controls. J Affect Disord. 1997;42:199–207. doi: 10.1016/s0165-0327(96)01413-9. [DOI] [PubMed] [Google Scholar]
- 69.Sharp T, Boothman L, Raley J, Queree P. Important messages in the ‘post’: recent discoveries in 5-HT neurone feedback control. Trends Pharmacol Sci. 2007;28:629–636. doi: 10.1016/j.tips.2007.10.009. [DOI] [PubMed] [Google Scholar]
- 70.Dillon KA, Gross-Isseroff R, Israeli M, Biegon A. Autoradiographic analysis of serotonin 5-HT1A receptor binding in the human brain postmortem: effects of age and alcohol. Brain Res. 1991;554:56–64. doi: 10.1016/0006-8993(91)90171-q. [DOI] [PubMed] [Google Scholar]
- 71.Joyce JN, Shane A, Lexow N, Winokur A, Casanova MF, Kleinman JE. Serotonin uptake sites and serotonin receptors are altered in the limbic system of schizophrenics. Neuropsychopharmacology. 1993;8:315–336. doi: 10.1038/npp.1993.32. [DOI] [PubMed] [Google Scholar]
- 72.Stockmeier CA, Shapiro LA, Dilley GE, Kolli TN, Friedman L, Rajkowska G. Increase in serotonin-1A autoreceptors in the midbrain of suicide victims with major depression-postmortem evidence for decreased serotonin activity. J Neurosci. 1998;18:7394–7401. doi: 10.1523/JNEUROSCI.18-18-07394.1998. [DOI] [PMC free article] [PubMed] [Google Scholar]
- 73.Boldrini M, Underwood MD, Mann JJ, Arango V. Serotonin-1A autoreceptor binding in the dorsal raphe nucleus of depressed suicides. J Psychiatr Res. 2008;42:433–442. doi: 10.1016/j.jpsychires.2007.05.004. [DOI] [PMC free article] [PubMed] [Google Scholar]
- 74.Cheetham SC, Crompton MR, Katona CL, Horton RW. Brain 5-HT1 binding sites in depressed suicides. Psychopharmacology (Berl) 1990;102:544–548. doi: 10.1007/BF02247138. [DOI] [PubMed] [Google Scholar]
- 75.Lemonde S, Du L, Bakish D, Hrdina P, Albert PR. Association of the C(1019)G 5-HT1A functional promoter polymorphism with antidepressant response. Int J Neuropsychopharmacol. 2004;7:501–506. doi: 10.1017/S1461145704004699. [DOI] [PubMed] [Google Scholar]
- 76.Shively CA, Willard SL, Davenport A, Friedman DP. Neuroscience. San Diego: Society for Neuroscience; 2007. 5HT1a receptor binding in the hippocampus of behaviorally depresse female cynomolgus macaques (Macaca fascicularis) p. 266.221/V265. [Google Scholar]
- 77.Shively CA, Friedman DP, Gage HD, Bounds MC, Brown-Proctor C, Blair JB, et al. Behavioral depression and positron emission tomography-determined serotonin 1A receptor binding potential in cynomolgus monkeys. Arch Gen Psychiatry. 2006;63:396–403. doi: 10.1001/archpsyc.63.4.396. [DOI] [PubMed] [Google Scholar]
- 78.Cleare AJ, Bond AJ. Ipsapirone challenge in aggressive men shows an inverse correlation between 5-HT1A receptor function and aggression. Psychopharmacology (Berl) 2000;148:344–349. doi: 10.1007/s002130050061. [DOI] [PubMed] [Google Scholar]
Associated Data
This section collects any data citations, data availability statements, or supplementary materials included in this article.