Abstract
OBJECTIVE
This study was performed to determine the condylar morphological variation of osteoarthritic (OA) and asymptomatic temporomandibular joints (TMJ) and to determine its correlation with pain intensity and duration.
STUDY DESIGN
Three dimensional surface models of mandibular condyles were constructed from Cone-Beam CT images of 29 female patients with TMJ OA (Research Diagnostic Criteria for Temporomandibular Disorders Group III) and 36 female asymptomatic subjects. Shape Correspondence was used to localize and quantify the condylar morphology. Statistical analysis was performed with MANCOVA analysis using Hotelling T2 metric based on covariance matrices, and Pearson correlation.
RESULTS
OA condylar morphology was statistically significantly different from the asymptomatic condyles (p<0.05). 3D morphological variation of the OA condyles was significantly correlated with pain intensity and duration.
CONCLUSION
3D quantification of condylar morphology revealed profound differences between OA and asymptomatic condyles and the extent of the resorptive changes paralleled pain severity and duration.
INTRODUCTION
Temporomandibular disorders (TMD) are a collection of clinical disorders which involve the temporomandibular joints (TMJ), the muscles of mastication, and associated structures.1 TMD affects approximately 10% of the population and is more prevalent in women.2 The associated pain and limited mouth opening can lead to severe functional impairment and disability.3 TMJ osteoarthritis(OA) is a local inflammatory condition which occurs when the dynamic equilibrium between the breakdown and the repair of joint tissue is compromised. The spectrum of clinical and pathological presentation of TMJ OA range from structural and functional failure of the joint with disc displacement and degeneration, to subchondral bone alterations (erosions), bone overgrowth (osteophytes), loss of articular fibrocartilage, and synovitis._Local inflammatory processes in the TMJ are known to share common pathways with pain and bone resorption.4-9 However, the factors which mitigate the morphological changes and clinical signs and symptoms (such as pain and joint sounds) is unknown.10 Furthermore, the multitude of risk factors, the complex etiopathogenesis, and the heterogeneity of clinical presentation create a challenge for developing novel therapies.11,12
The Research Diagnostic Criteria for Temporomandibular Disorders (RDC/TMD)13 was revised recently to include image analysis criteria for various imaging modalities.14 Reportedly, Computed Tomography (CT) has the best positive percentage agreement (84%) for the diagnosis of TMJ OA. In concordance with these guidelines 42.6% of TMD patients presented with tomographic evidence of TMJ OA changes including bone erosions and osteophytes.15 However, previous studies attempting to correlate two-dimensional (2D) and three-dimensional (3D) cross-sectional radiographic changes of the TMJ to clinical signs and symptoms have yield mixed findings.3,15,16 Refinement in image analysis for accurate visualization by reconstruction of 2D and cross-sectional images into 3D may enable the localization and quantification of previously unidentified condylar resorption patterns and reveal important relationship between the morphological variance and the clinical symptoms.17
Shape Correspondence (SC), a 3D surface mapping technique using CBCT images, was developed for the precise localization and quantification of the extent of resorptive changes in mandibular condyles.18,19 Computer-based methods allow for the development and widespread use of imaging biomarkers (i.e., joint space narrowing and erosions), which may have an impact in clinical decision making, for drug development, and for monitoring of treatment. The transition of OA assessment toward an automatic quantification system minimizes the influence of the reader experience, and thus decreases inter- and intra-reader variability. The automation allows for a remote analysis over the Internet, which is particularly relevant for future multicenter clinical trials that require a consistent assessment of the data. The tracking of individual erosive destructions can lead to a more fundamental understanding of the fine interactions within the disease process, even for large populations, which are difficult to grasp with global scores that are determined manually. This system is already in experimental use. Ongoing research is focused on clinical evaluation in a large population and the integration of follow-up examinations (erosion tracking) in the assessment of the disease progression. This work can play a role in the rapidly evolving field of biomedical imaging research, leading from discrete scales toward continuous imaging biomarkers in musculoskeletal radiology.
With this advanced method, we proposed to investigate the influence of pain and disease duration on the degree of condylar destruction in patients with TMJ OA. Such novel findings will improve the diagnostic yield and consequently, direct the timing and type of therapeutic interventions aimed at preventing further TMJ degradation and pain. Using this technique, the objectives of this study were to: (1) assess the 3D condylar morphology and evaluate the extent of condylar resorption in TMJ OA; (2) determine the difference in location and extent of condylar resorptive changes between osteoarthritic and asymptomatic TMJs; and (3) assess the correlation of the severity of resorption of osteoarthritic condyles with pain intensity and duration.
STUDY DESIGN
SUBJECTS
This retrospective cross-sectional study utilized 3D virtual surface models of the mandibular condyles from the CBCT images of 29 female patients (mean age=40.7 years, SD=15.7 years) with painful TMJ OA who sought treatment at the University of North Carolina School of Dentistry Orofacial Pain Clinic and 36 asymptomatic female patient (controls, mean age=24.3 years, SD=10.8 years) who sought treatment at the Orthodontic Clinic. All control subjects (n=36) met the inclusion criteria of skeletal maturity as determined by the stage 6 of cervical vertebrae maturation assessed in their lateral cephalograms.20 Exclusion criteria for the healthy controls included:
Presence of a cleft or other congenital syndrome
Problems secondary to facial trauma
Previous facial bone osteotomy or genioplasty
Correction by genioplasty only
Systemic medical condition involving immune system, degenerative musculoskeletal, or neuropathy sequelae
History of orofacial pain and mandibular dysfunction.
Biomedical Institutional Review Board approval was obtained for analysis of the CBCTs. Imaging was performed at the initial appointment. A clinical examination, based on the RDC/TMD, was performed on all patients with TMJ pain by an orofacial pain specialist who was trained and experienced in RDC/TMD examination and diagnoses. All cases met the RDC/TMD Group III criteria for TMJ OA,13 and the recently defined radiographic diagnosis criteria.14 Subjects rated their average pain intensity in the past month on a Verbal Rating Scale of ‘0’ to ‘10’ where ‘0’ was ‘no pain’ and ‘10’ was ‘the worst possible pain.’ Pain duration since its onset was also recorded. Pain characteristics (intensity and duration) were recorded for both TMJ sides separately. All asymptomatic control subjects denied orofacial pain and mandibular dysfunction.
CBCT IMAGE ANALYSIS
Radiographic analysis of degenerative changes of the condyles from CBCT cross-sectional slices were interpreted by an oral radiologist. Following radiological interpretation, preliminary studies were conducted to validate the use of 3D surface models (segmentations) and assess the scoring of condylar models from CBCT images using Shape Correspondence.
Validation of segmentation of the CBCT volumes was performed independently by two calibrated observers. Segmentation refers to the process of outlining the structures visible in the cross-sections of a volumetric dataset acquired with the NewTom CBCT-3G (QR-NIM s.r.l., Verona, Italy) with ITK-SNAP (Figure 2).21 The segmentations were performed in 10 TMJ OA volumetric datasets, and systematic differences between observers were assessed by means of Hotelling T2 based on covariance matrices.
Figure 2.
Description of shape correspondence procedures. The segmented 3D surface models of the condyles are converted into surface meshes, and a spherical parametrization is computed for the surface meshes using an area-preserving, distortion minimizing spherical mapping. The SPHARM description is computed from the mesh and its spherical parametrization. Using the first order ellipsoid from the spherical harmonic coefficients, the spherical parametrizations are aligned to establish correspondence across all surfaces. The SPHARM description is then sampled into a triangulated surfaces (SPHARM-PDM). The condylar surfaces are represented using a subdivision level 10 (1002 points in the surface of the condyle).These SPHARM-PDM surfaces are all spatially aligned using rigid Procrustes alignment.
Validation of Shape Correspondence was performed by comparing the assessment of condylar morphology based on the classification system of Koyama et al22 to an automated 3D imaging analysis scoring of condylar models from CBCT images using Shape Correspondence. The severity of condylar resorptive changes was classified according to on a scale of 0 to 4 after reviewing the volume using multiplanar reformatted views (MPR), where 0 = no bone change; 1 = flattening; 2 = erosion; 3 = deformity; and 4 = deformity with accompanied erosion. Three dimensional surface models of these condyles were constructed from the volume data, and Shape Correspondence scores were used to evaluate the condylar morphology. Pearson correlation and two sided t-test were applied.
The general and modular methodological framework for shape analysis in this study consisted of the following steps: segmentation of the CBCT volumes, Shape Correspondence, individual local morphologic variation, and statistical shape analysis (Figures 1 and 2).
Figure 1.
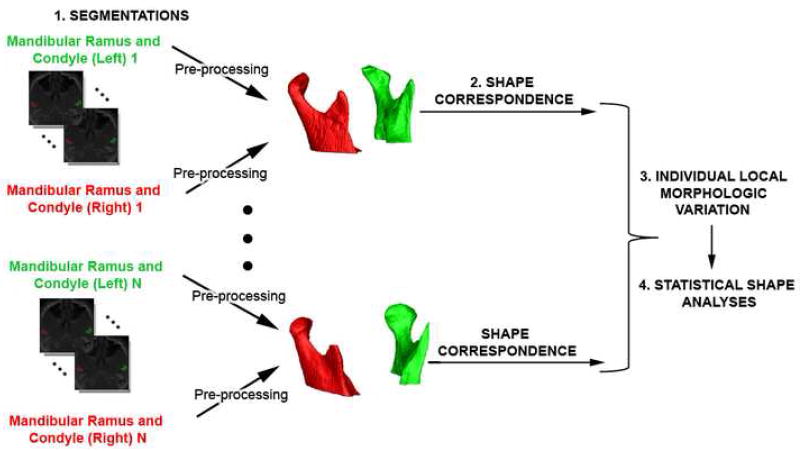
Diagram of methodology used for shape analysis that consisted of 4 steps: 1.segmentation of the CBCT volumes,2. Shape Correspondence, 3. Individual local morphologic variation, and 4. Statistical shape analysis.
Segmentation of the CBCT volumes, i.e. construction of the three-dimensional virtual models of the mandibular condyles from a set of ~300 axial cross-sectional slices for each CBCTC image, with the voxels reformatted for an isotropic of 0.5 × 0.5 × 0.5 mm.
Shape Correspondence (SC) was employed to provide a unique and symmetric point correspondence across all measured surfaces. The correspondence was computed via mapping every point on the condylar 3D surface model to a unique position on the unit sphere (SPHARM software, developed as part of the NAMIC consortium)23 followed by generating a uniformly triangulated surface based on this spherical mapping (SPHARM-PDM)24 (Figures 1 and 2). Alignment of all surfaces was performed using rigid Procrustes alignment.
Individual local morphologic variation specific to TMJ OA was calculated by difference vectors between each point in the individual condyle and the TMJ OA population mean. The difference vector for each point was projected to its corresponding normal vector in the TMJ OA mean. The magnitude of this projection is a measure of shape variation that may be correlated with clinical variables. Individual global morphologic scores were also computed by the difference each TMJ OA condyle and the average TMJ OA shape.
Statistical Shape Analyses were carried out to test cross-patient group differences and to assess the correlation of morphologic variables with clinical variables. The core of the ability to compute group mean and group variability (either parametric or non-parametric) is the correspondence procedure. This allows the association of any location on the condyle of subject A with the correct location on the condyle of subject B. Considerable inter-subject variability is also accounted for in the model that captures the mean condylar morphology and variability around that mean morphology. A multivariate analysis of covariance (MANCOVA) was used to estimate and compare mean group morphology model of asymptomatic controls and of TMJ OA patients.13 The p-values maps for testing group differences were calculated based on the Hotelling T2 metric based on covariance matrices. Pearson correlation coefficients and their p-values were computed between individual global and local morphological variation and pain variables, namely pain duration and intensity.
RESULTS
Validation of segmentations
Small inter-observer differences with mean, 0.64mm and 0.68mm, and maximum, 1.11mm and 1.13mm, distances were found between the composite models from each observer respectively for the left and right condyles. The significance maps showed no significant differences for all points (p > 0.05) (Figure 3).
Figure 3.
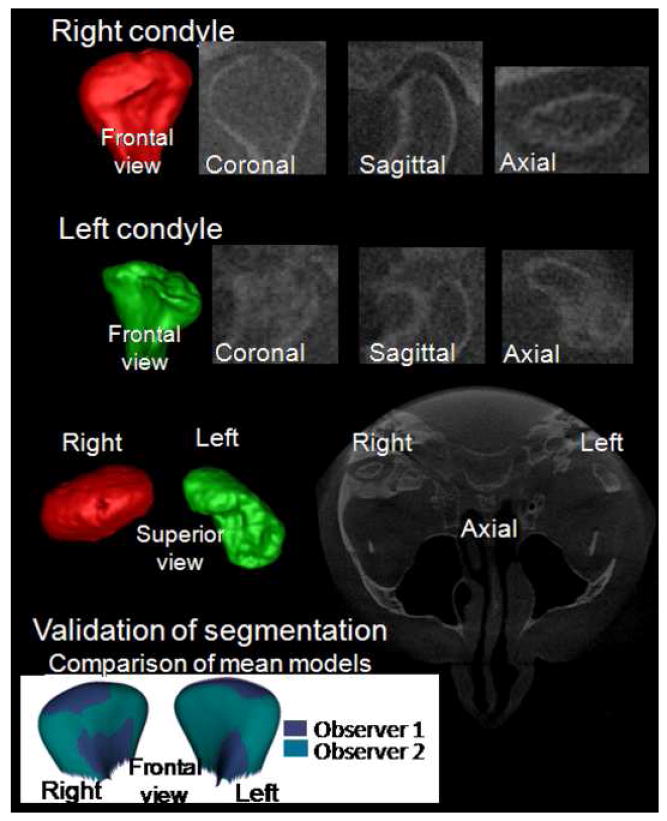
Validation of condylar 3D models constructed from CBCT: The bottom row shows the overlay of composite models constructed by 2 observers for 10 TMJ OA subjects.
Validation of Shape Correspondence assessment of condylar morphology
Based on Shape Correspondence, the 3D condylar morphology scores ranged from 1.31 to 8.48. Statistically significant correlation between the classification system of Koyama et al.22 and 3D morphology scores using Shape Correspondence were observed (left condyles: r=0.89, p<.0001; right condyles: r= 0.93, p <.0001) (Figure 3).
Morphological characteristics of osteoarthritic TMJ
Three-dimensional virtual surface models allowed clear visualization of 3D shape as well as surface erosions, osteophytes and surface flattening. For the TMJ OA group, all subjects showed either flattening and/or osteoarthritic changes. Condylar flattening was observed in 60% of the condyles (35 out of 58 right and left condyles), and osteoarthritic surface irregularities such as erosions and osteophytes were found in 40% of the condyles (23 condyles out of 58 right and left condyles). Different degrees of surface flattening were observed and varied from partial surface to whole condylar head remodeling (5 out of 58 right and left condyles). Condyles with incipient surface remodeling displayed a characteristic morphology with the long axis of the condyle forming an unusually large angle to the trans-meatal line (Figure 4). Although 15% of asymptomatic controls presented some degree of condylar flattening, surface irregularities, such as erosions and osteophytes, were not observed in this group.
Figure 4.
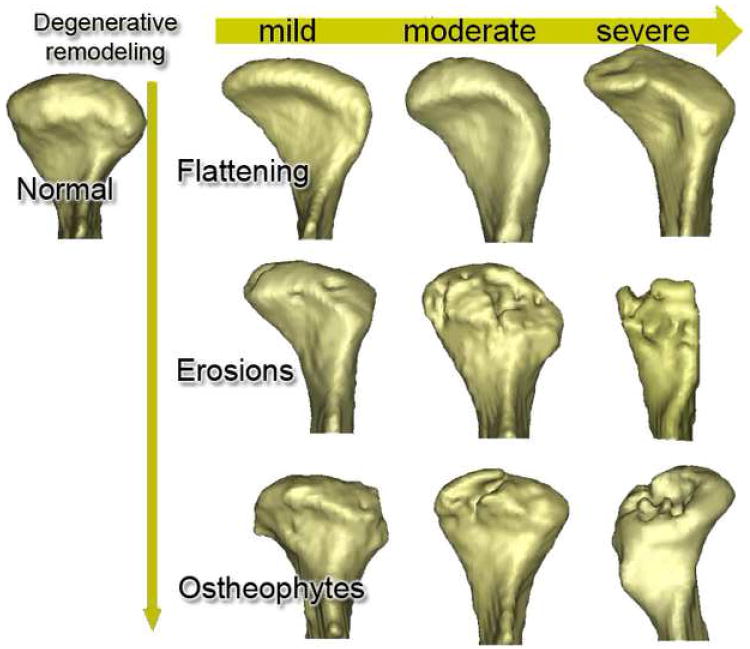
The 3D morphological distribution of condylar shapes associated with a possible continuum of osteoarthritic changes. The vertical axis illustrates the progression (flattening, erosions and osteophytes) of degenerative change while the horizontal axis illustrates levels of severity.
Group comparisons
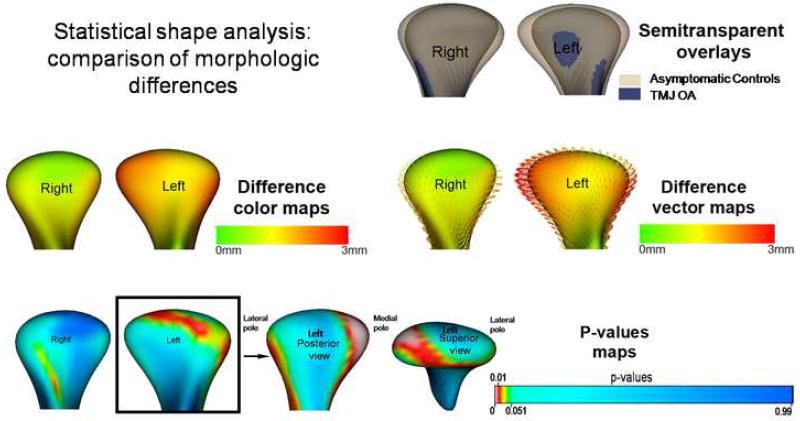
Semi-transparent overlays displayed the differences between the composite TMJ OA and the asymptomatic controls. These differences were visualized with color-coded magnitude maps, difference vector maps, and their associated p-values maps in Figure 5. The condylar morphology of the TMJ OA group was statistically significantly different from the asymptomatic group (p < 0.05), with maximum corresponding surface distance differences of 2.11mm for the right condyles and 2.96 mm for the left condyles. The composite TMJ OA left condyle compared to the asymptomatic group showed resorption of the anterior surface of the lateral pole, the posterior surface of the medial pole, and flattening of the articular surface.
Figure 5.
Group comparisons using statistical shape analysis: semi-transparent overlay of composite model of asymptomatic control and the TMJ OA group, color maps, difference vectors and p-value maps of the Hotelling t-tests maps showing that statistically significant differences were noted between the groups, for the left condyle at the anterior surface of the lateral pole and posterior surface of the medial pole.
Pain variables
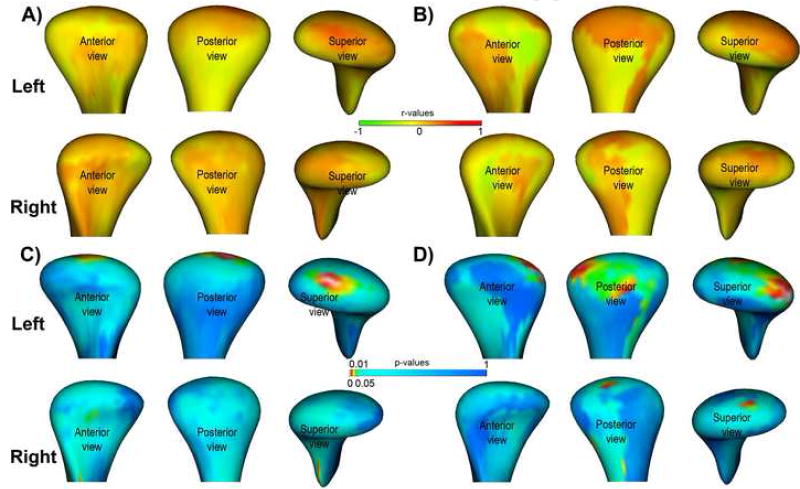
The self-reported average pain intensity in the past month ranged from 2 to 9 (mean 5.9 ±1.8) and pain duration ranged from 1 to 408 months (mean 72 ± 171 months). Regarding individual global morphologic scores, the correlation with pain intensity was r=-.27 (p= 0.22) and r=-0.14 (p=0.54) respectively for the left and right condyles, and the correlation with pain duration was r=0.49 (p=0.02) and r=0.43 (p=0.06) respectively for the left and right condyles. Regarding individual local morphologic variation, the correlation with pain intensity was statistically significant at the superior surface of the left condyles (r>0.6, p<0.01) and the correlation with pain duration was statistically significant at the superior, posterior, & lateral surface of the left condyles (r>0.6, p<0.01) (Figure 6).
Figure 6.
Local morphological correlation with pain variables. A, Local correlations with pain intensity. B, Local correlations with pain onset. C and D, statistical significance maps for A an B. The significance maps show statistically significant correlations in the superior surface of the condyle in A and the lateral and posterior surfaces of the condyle in B.
DISCUSSION
Over the years, numerous studies reported radiographic examinations with various imaging modalities which lacked well defined diagnostic criteria.25-28 With recent advancements in radiology, the spiral CT14,22 and CBCT29,30 multi-planar (axial, coronal and sagittal) images have been shown to be superior for the investigation of osseous changes of the condyle. This study is the first to precisely quantify 3D condylar morphology using SC technology and correlate the morphological changes to pain variables.
In this study, statistically significant condylar morphological differences were established between TMJ OA and asymptomatic controls. Another useful application of this SC technology include the 3D assessment of glenoid fossa changes associated with TMJ OA which was not explored in this study.
Based on the individual global morphologic scores, the severity of the resorption was not correlated with pain intensity in this study. Wiese et al.15 reported that clinical pain and radiographic signs in TMJ tomograms were not correlated. The same conclusion was reached in an analysis of CBCT cross-sectional slices by Hajati et al.5,6 of early TMJ rheumatoid arthritis (RA). However, individual local morphologic variation in the left condyles revealed statistically significant positive correlation between the extent of resorption on certain condylar surfaces and pain intensity and duration. This reflects the superiority of the 3D SC technique in quantifying the exact morphological location and extent of the condylar surface changes which was previously unidentified based on 2D global qualitative assessment measures. This technology will allow future studies to longitudinally map the stages of disease progression in TMJ OA and identify morphological variants or subtypes which may explain the heterogeneity of clinical presentation. Automatic, continuous assessment of imaging biomarkers makes a quantification of disease progress possible during treatment and across clinical sites. Such assessment can be expected to decrease inter-reader variability and artifacts introduced by individual readers.31 Finesse in the quantification of condylar morphology is integral to the phenotyping process. This, together with adequate genotyping,32 has the potential to acquire new knowledge on the pathophysiology of TMJ OA and lay the grounds for novel therapeutic intervention.
Finally, a few limitations deserve mention. First, the more extensive morphological differences in the left compared to the right condyles in this cohort was probably specific to this sample and related to the small sample size. Second, our cases and controls were not age-matched. While an increase in age is associated with an increase in the frequency of diagnosis of TMJ osteoarthritis, it is not known whether the extent of condylar resorption of an osteoarthritic condyle in a 20 year old patient with TMJ OA differs from that of a 55 year old patient with TMJ OA. Osteoarthritis is an age-related disease. The progression and severity of osseous changes in condylar head and mandibular fossa have been reported to increase with age.33 In older age groups, patients are expected to have more frequent and severe progressive degenerative bony changes due to the development of TMJ osteoarthritis than patients in younger age groups. Third, the pain intensity rating was based on self-reported information, even though an effort was made for collection of side-specific data. In addition, since TMJ OA by itself, without masticatory myalgia, is rare, the presence and extent of masticatory myalgia may influence the pain rating. Future studies should consider age-matched cohorts and studies of a longitudinal design will actually better investigate the age factor as a confounder. Studies should also take into consideration other clinical variables, such as the mandibular range of motion and masticatory myalgia, which often contribute to the debilitating nature of TMJ OA.
CONCLUSIONS
This study is the first to precisely quantify 3D condylar morphology using SC technology and report statistically significant positive correlation between the location and extent of condylar resorption and pain intensity and duration. This technology will allow future studies to longitudinally map the stages of disease progression in TMJ OA and identify morphological variants or subtypes which may explain the heterogeneity of clinical presentation.
Acknowledgments
Supported by NIDCR DE017727, DE005215 and DE018962 and NCRR UL1RR025847.
Footnotes
Publisher's Disclaimer: This is a PDF file of an unedited manuscript that has been accepted for publication. As a service to our customers we are providing this early version of the manuscript. The manuscript will undergo copyediting, typesetting, and review of the resulting proof before it is published in its final citable form. Please note that during the production process errors may be discovered which could affect the content, and all legal disclaimers that apply to the journal pertain.
References
- 1.De Leeuw R. American Academy of Orofacial Pain Guidelines for Assessment, Diagnosis, and Management. 4. Chicago: Quintessence Publishing Co; 2008. [Google Scholar]
- 2.LeResche L. Epidemiology of temporomandibular disorders: Implications for the investigation of etiologic factors. Crit Rev Oral Biol Med. 1997;8:291–305. doi: 10.1177/10454411970080030401. [DOI] [PubMed] [Google Scholar]
- 3.Helenius LM, Tervahartiala P, Helenius I, Al-Sukhun J, Kivisaari L, Suuronen R, et al. Clinical, radiographic and MRI findings of the temporomandibular joint in patients with different rheumatic diseases. Int J Oral Maxillofac Surg. 2006;35:983–989. doi: 10.1016/j.ijom.2006.08.001. [DOI] [PubMed] [Google Scholar]
- 4.Alstergren P, Kopp S. Insufficient endogeneous control of tumor necrosis factor-α contributes to temporomandibular joint pain and tissue destruction in rheumatoid arthritis. J Rheumatol. 2006;33:1734–1739. [PubMed] [Google Scholar]
- 5.Hajati A-K. Early signs of bone tissue resorption in the TMJ of patients with recent diagnosis of rheumatoid arthritis. In: McNamara JA Jr, Kapila SD, editors. Temporomandibular Disorders and Orofacial Pain: Separating Controversy from Consensus Monograph 46, Craniofacial Growth Series, Department of Orthodontics and Pediatric Dentistry and Center for Human Growth and Development, The University of Michigan, Ann Arbor. 2009. pp. 147–157. [Google Scholar]
- 6.Hajati A-K, Alstergren P, Näsström K, Bratt J, Kopp S. Endogenous glutamate in association with inflammatory and hormonal factors modulates bone tissue resorption of the temporomandibular joint in patients with early rheumatoid arthritis. J Oral Maxillofac Surg. 2009;67:1895–1903. doi: 10.1016/j.joms.2009.04.056. [DOI] [PMC free article] [PubMed] [Google Scholar]
- 7.Carbone LD, Nevitt MC, Wildy K, Barrow KD, Harris F, Felson D, Peterfy C, Visser M, Harris TB, Wang BWE, Kritchevsky SB. The Relationship of Antiresorptive Drug Use toStructural Findings and Symptoms of Knee Osteoarthritis. Arthritis Rheum. 2004;50:3516–3525. doi: 10.1002/art.20627. [DOI] [PubMed] [Google Scholar]
- 8.Kurita H, Kojima Y, Nakatsuka A, Koike T, Kobayashi H, Kurashin K. Relationship between temporomandibular joint (TMJ)-related pain and morphological changes of the TMJ condyle in patients with temporomandibular disorders. Dentomaxillofac Radiol. 2004;33:329–333. doi: 10.1259/dmfr/13269559. [DOI] [PubMed] [Google Scholar]
- 9.Shinoda C, Takaku S. Interleukin-1b, interleukin-6, and tissue inhibitor of metalloproteinase-1 in the synovial fluid of the temporomandibular joint with respect to cartilage destruction. Oral Diseases. 2000;6:383–390. doi: 10.1111/j.1601-0825.2000.tb00131.x. [DOI] [PubMed] [Google Scholar]
- 10.Stone L. Joint degeneration and chronic pain: still looking for the missing link. Pain. 2009;141:185–6. doi: 10.1016/j.pain.2008.12.001. [DOI] [PubMed] [Google Scholar]
- 11.Hunter DJ, Hellio Le Graverand-Gastineau M-P. How close are we to having structure-modifying drugs available? Med Clin North Am. 2009;93:223–34. doi: 10.1016/j.mcna.2008.07.011. [DOI] [PubMed] [Google Scholar]
- 12.Wadhwa S, Kapila S. TMJ disorders: future innovations in diagnostics and therapeutics. J Dent Educ. 2008;72:930–947. [PMC free article] [PubMed] [Google Scholar]
- 13.Dworkin SF, LeResche L. Research diagnostic criteria for temporomandibular disorders: Review, criteria, examinations, and specifications, critique. J Craniomandib Disord. 1992;6:301–355. [PubMed] [Google Scholar]
- 14.Ahmad M, Hollender L, Anderson Q, Kartha K, Ohrbach RK, Truelove EL, et al. Research diagnostic criteria for temporomandibular disorders (RDC/TMD): development of image analysis criteria and examiner reliability for image analysis. Oral Surg Oral Med Oral Pathol Oral Radiol Endod. 2009 doi: 10.1016/j.tripleo.2009.02.023. in press. [DOI] [PMC free article] [PubMed] [Google Scholar]
- 15.Wiese M, Svensson P, Bakke M, List T, Hintze H, Petersson A. Associations between temporomandibular joint symptoms, signs, and clinical diagnosis using the RDC/TMD and radiographic findings in temporomandibular joint tomograms. J Orofac Pain. 2008;22:239–251. [PubMed] [Google Scholar]
- 16.Helenius LM, Hallikainen D, Helenius I, Meurman JH, Könönen M, Leirisalo-Repo M, et al. Clinical and radiographic findings of the temporomandibular joint in patients with various rheumatic diseases: A case control study. Oral Surg Oral Med Oral Pathol Oral Radiol Endod. 2005;99:455–463. doi: 10.1016/j.tripleo.2004.06.079. [DOI] [PubMed] [Google Scholar]
- 17.Costa ALF, Yasuda CL, Appenzeller S, Lopes SLP, Cendes F. Comparison of conventional MRI and 3D reconstruction model for evaluation of temporomandibular joint. Surg Radiol Anat. 2008;30:663–667. doi: 10.1007/s00276-008-0400-z. [DOI] [PubMed] [Google Scholar]
- 18.Cevidanes LH, Bailey LJ, Tucker GR, Jr, Styner MA, Mol A, Phillips CL, et al. Superimposition of 3D cone-beam CT models of orthognathic surgery patients. Dentomaxillofac Radiol. 2005;34:369–375. doi: 10.1259/dmfr/17102411. [DOI] [PMC free article] [PubMed] [Google Scholar]
- 19.Cevidanes LHS, Walker D, Styner M, Lim PF. Condylar resorption in patients with TMD. In: Mcnamara JA Jr, Kapila SD, editors. Temporomandibular Disorders and Orofacial Pain - Separating Controversy from Consensus. 2009 Moyers Symposium Volume 46, Craniofacial Growth Monograph Series, Ann Arbor. 2009. pp. 147–157. [PMC free article] [PubMed] [Google Scholar]
- 20.Baccetti T, Franchi L, McNamara JA., Jr The cervical vertebral maturation (CVM method for the assessment of optimal treatment timing in dentofacial orthopedics. Semin Orthod. 2005;11:119–129. [Google Scholar]
- 21.Yushkevich PA, Piven J, Hazlett HC, Smith RG, Ho S, Gee JC, et al. User-guided 3D active contour segmentation of anatomical structures: Significantly improved efficiency and reliability. Neuroimage. 2006;31:1116–1128. doi: 10.1016/j.neuroimage.2006.01.015. [DOI] [PubMed] [Google Scholar]
- 22.Koyama J, Nishiyama H, Hayashi T. Follow-up study of condylar bony changes using helical computed tomography in patients with temporomandibular disorder. Dentomaxillofac Radiol. 2007;36:472–477. doi: 10.1259/dmfr/28078357. [DOI] [PubMed] [Google Scholar]
- 23.Styner M, Oguz I, Xu S, Brechbuhler C, Pantazis D, Levitt J, et al. Framework for the Statistical Shape Analysis of Brain Structures using SPHARM-PDM. Special Edition Open Science Workshop at MICCAI. Insight Journal. 2006:1–7. [PMC free article] [PubMed] [Google Scholar]
- 24.Gerig G, Styner M, Jones D, Weinberger D, Lieberman J. Shape analysis of brain ventricles using spharm. MMBIA Proceedings IEEE. 2001:171–178. [Google Scholar]
- 25.Hayashi T, Ito J, Koyama J, Hinoki A, Kobayashi F, Torikai Y, et al. Detectability of anterior displacement of the articular disk in the temporomandibular joint on helical computed tomography: The value of open mouth position. Oral Surg Oral Med Oral Pathol Oral Radiol Endod. 1999;88:106–111. doi: 10.1016/s1079-2104(99)70202-7. [DOI] [PubMed] [Google Scholar]
- 26.Nebbe B, Brooks SL, Hatcher D, Hollender LG, Prasad NG, Major PW. Magnetic resonance imaging of the temporomandibular joint: interobserver agreement in subjective classification of disk status. Oral Surg Oral Med Oral Pathol Oral Radiol Endod. 2000;90:102–7. doi: 10.1067/moe.2000.106300. [DOI] [PubMed] [Google Scholar]
- 27.Schellhas KP, Pollei SR, Wilkes CH. Pediatric internal derangements of the temporomandibular joint: Effect on facial development. Am J Orthod Dentofacial Orthop. 1993;104:51–59. doi: 10.1016/0889-5406(93)70027-L. [DOI] [PubMed] [Google Scholar]
- 28.Yamada K, Hiruma Y, Hanada K, Hayashi T, Koyama J, Ito J. Condylar bony change and craniofacial morphology in orthodontic patients with temporomandibular disorders (TMD) symptoms: A pilot study using helical computed tomography and magnetic resonance imaging. Clin Orthod Res. 1999;2:133–142. doi: 10.1111/ocr.1999.2.3.133. [DOI] [PubMed] [Google Scholar]
- 29.Honey OB, Scarfe WC, Hilgers MJ, Klueber K, Silveira AM, Haskell BS. Accuracy of cone-beam computed tomography imaging of the temporomandibular joint: comparisons with panoramic radiology and linear tomography. Am J Orthod Dentofac Orthop. 2007;132:429–38. doi: 10.1016/j.ajodo.2005.10.032. [DOI] [PubMed] [Google Scholar]
- 30.Hussain AM, Packota G, Major PW, Flores-Mir C. Role of different imaging modalities in assessment of temporomandibular joint erosions and osteophytes: a systematic review. Dentomaxillofac Radiol. 2008;37:63–71. doi: 10.1259/dmfr/16932758. [DOI] [PubMed] [Google Scholar]
- 31.Langs G, Peloschek P, Bischof H, Kainberger F. Automatic Quantification of Joint Space Narrowing and Erosions in Rheumatoid Arthritis. IEEE Transactions on Medical Imaging. 2009;28:151–164. doi: 10.1109/TMI.2008.2004401. [DOI] [PubMed] [Google Scholar]
- 32.Goldring MB, Goldring SR. Osteoarthritis. J Cell Physiol. 2007;213(3):626–634. doi: 10.1002/jcp.21258. [DOI] [PubMed] [Google Scholar]
- 33.Alexiou KE, Stamatakis HC, Tsiklakis K. Evaluation of the severity of temporomandibular joint osteoarthritic changes related to age using cone beam computed tomography. Dentomaxillofac Radiol. 2009;38:141–147. doi: 10.1259/dmfr/59263880. [DOI] [PubMed] [Google Scholar]


