Abstract
Objective
To validate fast perfusion mapping techniques in a setting of coronary artery stenosis, and to further assess the relationship of absolute myocardial blood volume (MBV) and blood flow (MBF) to global myocardial oxygen demand.
Methods
A group of 27 mongrel dogs were divided into 10 controls and 17 with acute coronary stenosis. On 1.5-T MRI, first-pass perfusion imaging with a bolus injection of a blood-pool contrast agent was performed to determine myocardial perfusion both at rest and during either dipyridamole-induced vasodilation or dobutamine-induced stress. Regional values of MBF and MBV were quantified by using a fast mapping technique. Color microspheres and 99mTc-labeled red blood cells were injected to obtain respective gold standards.
Results
Microsphere-measured MBF and 99mTc-measured MBV reference values correlated well with the MR results. Given the same changes in MBF, changes in MBV are twofold greater with dobutamine than with dipyridamole. Under dobutamine stress, MBV shows better association with total myocardial oxygen demand than MBF. Coronary stenosis progressively reduced this association in the presence of increased stenosis severity.
Conclusions
MR first-pass perfusion can rapidly estimate regional MBF and MBV. Absolute quantification of MBV may add additional information on stenosis severity and myocardial viability compared with standard qualitative clinical evaluations of myocardial perfusion.
Keywords: Coronary stenosis, Myocardial blood flow, Myocardial blood volume
Introduction
Coronary artery disease (CAD) has profound effects on the myocardial microcirculation [1]. If blood supply (blood flow) cannot meet the oxygen demand of the myocytes, myocardial ischemia ensues, and if uncorrected, infarction will occur. Stress imaging is widely used in the diagnosis of CAD patients. Pharmacological stressors such as dipyridamole and dobutamine provide alternative stress for patients with limited exercise capability. Dipyridamole directly works on arteriolar smooth muscle as a coronary vasodilator and increases myocardial blood flow (MBF) without significantly increasing myocardial oxygen demand. The inotropic agent dobutamine, on the other hand, increases myocardial oxygen demand, and through β2-adrenoceptor-mediated vasodilation of resistance vessels, increases MBF. Both agents have been used to assess myocardial flow reserve (or MFR, defined as the ratio of MBF during the hyperemia vs. resting MBF) which has demonstrated great sensitivity and specificity in detecting CAD [2, 3].
Myocardial blood volume (MBV) has been paid less attention, partially because MBV is generally correlated with MBF and is less sensitive to the changes in the setting of upstream coronary artery flow. Recently, myocardial contrast echocardiography (MCE) [4] and electron-beam CT (EBCT) [5] have demonstrated nonlinear associations between MBV and MBF. Specifically, changes in MBV have outstripped the changes in MBF in settings of greatly elevated myocardial oxygen consumption. In a two-center study with qualitative analysis, MBV appeared to be associated with the functional relevance of coronary artery stenosis [6] and myocardial oxygen consumption (MVO2) [7], and may provide a comprehensive evaluation of coronary stenosis severity [8].
Magnetic resonance imaging can quantitatively measure MBF and MBV by first-pass perfusion imaging [9–11], and by arterial spin-labeling (ASL) techniques [12, 13].We have recently developed and validated fast mapping techniques for quantifying MBF and MBV with the first-pass perfusion approach in normal dogs [14, 15]. Therefore, the goals of this study were to first validate our MR techniques of measuring MBF and MBV in dogs with coronary artery stenosis and then assess their changes with myocardial oxygen demand at rest and during dipyrida-mole- or dobutamine-induced hyperemia.
Materials and methods
Animal preparation
All animal experiments were approved by the Animal Studies Committee in the local institute. Twenty-seven mongrel dogs (weight = 24.4 ± 5.5 kg) were divided into five groups of varying coronary stenosis and pharmacological stressors (Table 1). Anesthesia was induced with 12.5 mg/kg sodium thiopental. Dogs were then intubated with an endotracheal tube, and ventilated with 100% oxygen at a tidal volume of 12 ml/kg and a rate of 10–15 breaths/min. Anesthesia was maintained with ventilated 1–2% isoflurane. A femoral artery was exposed by a cutdown and an 8-F catheter was advanced into the left atrium for the injection of colored microspheres. Another catheter was inserted into the contralateral femoral artery to withdraw reference blood samples for the microsphere MBF measurement. This catheter was also connected to a fluid-filled transducer for blood pressure monitoring. Another catheter was placed into a femoral vein for the administration of fluids and dipyridamole or dobutamine. Dipyridamole (Bedford Laboratories, Bedford, OH, USA) was injected intravenously at a dose of 0.14 mg/kg/min for 4 min. Dobutamine (Hospira Inc., Lake Forest, IL, USA) was titrated in 5 µg/kg/min increments every 5 min up to a maximum of 30 µg/kg/min. Heart rate and blood pressure were monitored continuously by using an MRI-compatible hemodynamic monitor (Vital Signs Monitoring System, Invivo Research, Orlando, FL, USA).
Table 1.
Dog groups
| Group (n) | Stenosis | Pharmacological stressor |
|---|---|---|
| 1 (5) | Control | Dipyridamole |
| 2 (5) | Control | Dobutamine |
| 3 (7) | Severe | Dipyridamole |
| 4 (5) | Moderate | Dobutamine |
| 5 (5) | Severe | Dobutamine |
The methods for inducing acute coronary stenosis have been reported previously [16]. Briefly, the left anterior descending coronary artery (LAD) was dissected free distal to the first diagonal branch and then instrumented (in proximal–distal order) with a Doppler flow probe, a pneumatic occluder, and a homemade MR-compatible stenosis clamp. Before tightening the stenosis, several 20-s occlusions were performed to determine an average hyperemic flow response. The stenosis clamp was then tightened and the severity of lumen area decrease was estimated by the magnitude reduction of reactive hyperemia after another 20-s occlusion. After the desired stenosis severity was attained, the occluder and flow probe were removed and the dogs (with the chest remaining open) were moved to the MRI suite. Control dogs without coronary stenosis (groups 1 and 2) did not undergo the thoracotomy surgery. Group 3 dogs were given stenoses of 86–95%, and were subjected to dipyridamole vasodilation. Groups 4 and 5 were given dobutamine. The severity of stenosis was 75% (moderate stenosis) and 86–95% (severe stenosis) in groups 4 and 5, respectively.
MR imaging protocol
All dogs were imaged with a 1.5T Sonata (Siemens Medical Solutions, Malvern, PA, USA), equipped with a fast gradient system (maximal gradient strength = 40 mT m−1, maximal slew rate = 200 mT m−1/ms). A four-element phased array coil placed around the dog’s chest was used for signal reception and a body coil was used as a transmitter. Control dogs were imaged supine while dogs with coronary stenoses were placed in the right lateral position to preserve the stenosis placement. Scout imaging was performed first to obtain a short-axis image of the left ventricle (LV) at the mid-cavity level. Cine imaging was performed to determine the motionless period of the cardiac cycle. During imaging, respiratory motion was eliminated by turning off the ventilator. First-pass perfusion images to quantify MBF and MBV were obtained during the bolus injection (15 µmol/kg) of Gadomer contrast agent (Bayer Schering Pharma AG, Berlin, Germany) by a saturation-recovery, turbo fast low-angle shot (SR-turboFLASH) sequence at a resolution of 2.1 mm × 0.9 mm and a slice thickness of 8 mm. The saturation-prepared pulse is a non-slice-selective hyperbolic secant pulse with a duration of 5.12 ms. Three short-axis slices of the LV myocardium were acquired during each sequence, triggered by the R wave of the ECG. The second slice was obtained during mid-diastole and was used in subsequent image analysis. A total of 60–80 dynamic images were collected for each slice and images were collected at every RR interval. Other imaging parameters included: TR = 2.5 ms; TE = 1.2 ms; TI = 90 ms; flip angle = 18°; FOV = 220 mm × 138 mm; matrix size = 128 × 80; voxel size = 2.0 × 0.9 × 8.0 mm; and image acquisition time window per cardiac cycle = 150 ms.
Validation of measurements of MBF and MBV
Fourteen dogs were randomly chosen in order to validate the MRI measurements of MBF with simultaneous measurement of MBF by using microspheres. Colored microspheres (15 µm, STERIspheres, BioPAL, Inc., Worcester, MA, USA) were injected for measuring the MBF at rest and under stress conditions, respectively, by procedures described previously [17]. Sixteen dogs were randomly chosen in order to validate MRI measurements of MBV with use of 99mTc-labeled red blood cells (RBC). Because 99mTc-RBC can only be performed once on each dog, the reference MBV measurement was performed on 6 dogs at rest, 5 during dipyridamole stress, and 5 during dobutamine stress. A 3-mL blood aliquot was withdrawn and labeled with a 99mTc labeling kit for 30 min (UltraTag, Mallinckrodt Medical, Inc., St. Louis, MO, USA). The 99mTc-RBCs were then injected intravenously, and allowed to circulate for 5 min before the animal was euthanized. The hearts were excised and a 1-cm ring was cut from the mid-portion of the LV, approximating the measured MRI slice. Radioactive counting was performed with a well gamma counter, and determination of MBV followed standard protocols [18]. The 99mTc-RBC-measured MBV data were corrected for hematocrit as previously reported [12].
Image analysis
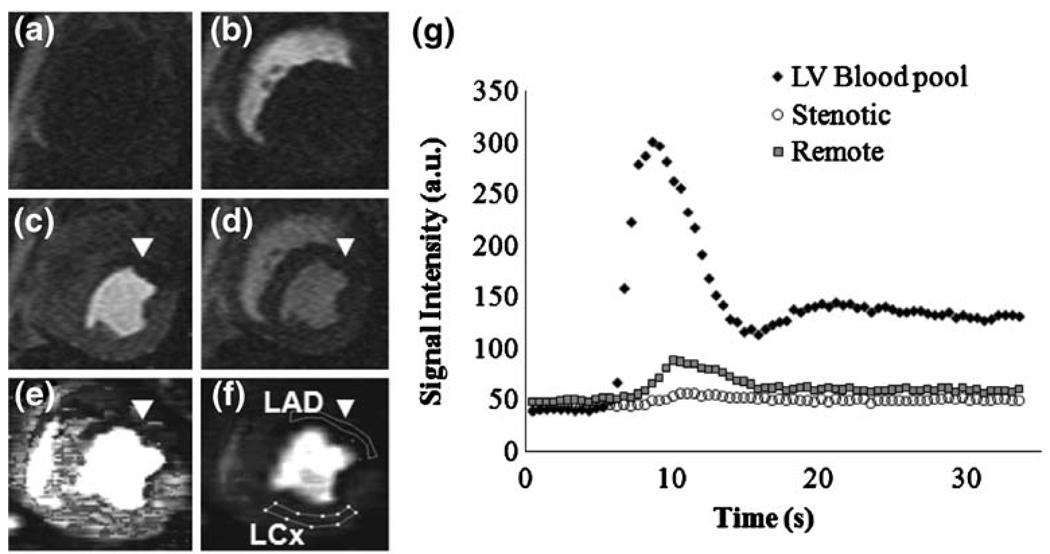
Magnetic resonance images were transferred from the imaging console in DICOM format and analyzed with a Java program (Java Runtime Environment V5.0, Sun Microsystems, Santa Clara, CA, USA) developed in our lab. Images were denoised [19], and then subjected to a validated perfusion quantification algorithm [12, 13] similar to the established B-spline method [20]. This method can create MBF and MBV maps rapidly, with a 5-s computation time. Regions of interest (ROIs) were then drawn in the LAD- and left circumflex (LCx)-subtended areas for regional comparisons (Fig. 1). Rate–pressure product (RPP) was used as the index of global myocardial oxygen demand or consumption. A larger RPP value indicates higher myocardial oxygen demand [21].
Fig. 1.
Representative short-axis images of a dog with a 95% LAD stenosis (a–f), and a signal intensity plot during the Gadomer bolus (g). a Baseline before Gadomer bolus. b First-pass of contrast material enters the right ventricle. c First-pass into the LV. d After first-pass. MBF map e and MBV map f showing LAD (unmarked lines) and LCx regions of interest (marked lines). Coronary stenosis caused an area of hypointensity (poor perfusion) in the anterior LAD-perfused myocardium(arrowheads). g Plot of signal intensity vs. time confirming poor contrast enhancement in the myocardium affected by the coronary stenosis
Statistical analysis
MFR and MBV reserves (MFR and MVR, respectively) were calculated as the ratio of respective hyperemic and resting values. A paired t test was used to compare between groups and between rest and pharmacological stress. Analysis of covariance was carried out with an interaction effect to test the difference in slopes of linear regression lines of MBF or MBV versus RPP. P values less than or equal to 0.05 were considered to be statistically significant. MRI and reference methods were compared by linear regression analysis.
Results
Hemodynamics
Table 2 displays the changes in heart rate (HR), systolic blood pressure (BP), and RPP during dipyridamole or dobutamine stress for control dogs and those with coronary stenosis. Significant differences were observed between hyperemia and rest, as well as between control dogs and dogs with coronary stenosis for HR and RPP change during dobutamine (P < 0.05). Systolic BP was also increased significantly in dogs with coronary stenosis during dobutamine stress. All other differences were not significant.
Table 2.
Hemodynamic results for control dogs and dogs with coronary stenosis
| Heart rate (bpm) |
Systolic BP (mmHg) |
RPP (mmHg/min) | |
|---|---|---|---|
| Control dogs | |||
| Rest (n = 10) | 96±5 | 102±24 | 9,724±1,731 |
| DIP (n = 5) | 101±6 | 109±25 | 11,165±1,633 |
| DOB (n = 5) | 117±25* | 107±24 | 12,871±4,265* |
| Stenosis dogs | |||
| Rest (n = 17) | 102±16 | 88±12 | 8,812±2,125 |
| DIP (n = 7) | 102±18 | 83±12 | 8,623±2,561 |
| DOB (n = 10) | 139±18*† | 121±16* | 16,744±3,725*† |
Values are presented as mean ± SD
HR heart rate, BP blood pressure, RPP rate pressure product, DIP dipyridamole, DOB dobutamine
P < 0.05, stress vs. rest;
P < 0.05, stenosis vs. control dogs
Validation of MBF and MBV measurements
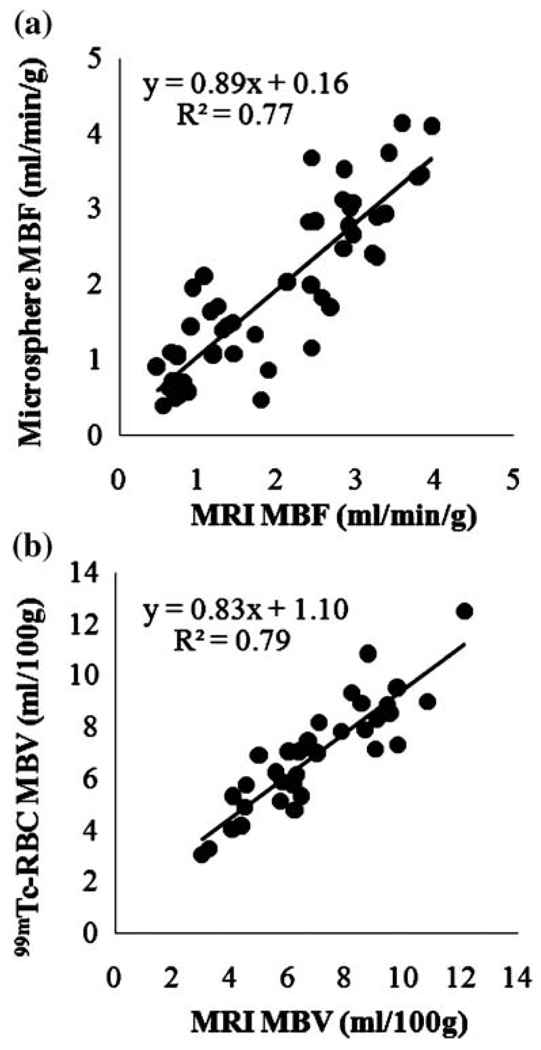
The Gadomer contrast bolus increased the blood signal intensity 684 ± 183% at the peak of perfusion curve and that of normal perfused myocardium 55 ± 23% compared with baseline (Fig. 1). MR-acquired MBF and MBV values correlated reasonably well with respective reference values over a wide range of MBF and MBV (Fig. 2).
Fig. 2.
Linear regression for microsphere- and MRI-derived MBF values (a), and for 99mTc-labeled red blood cell and MRI-obtained MBV values (b)
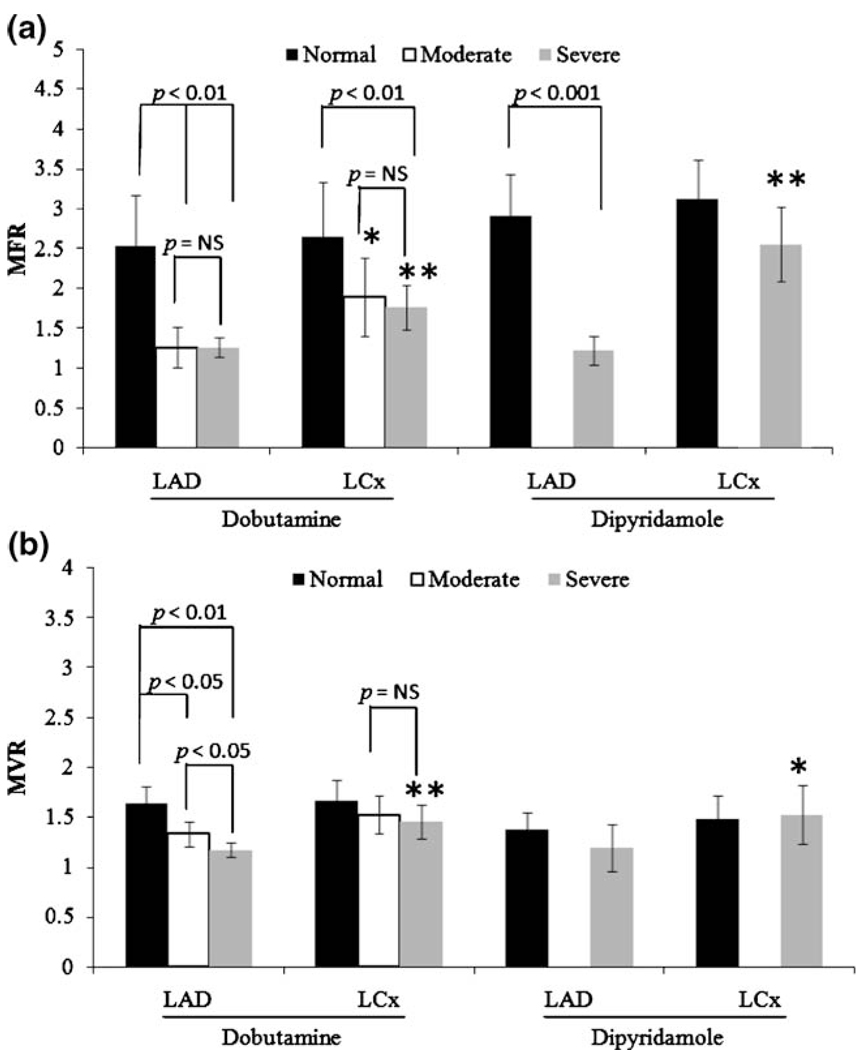
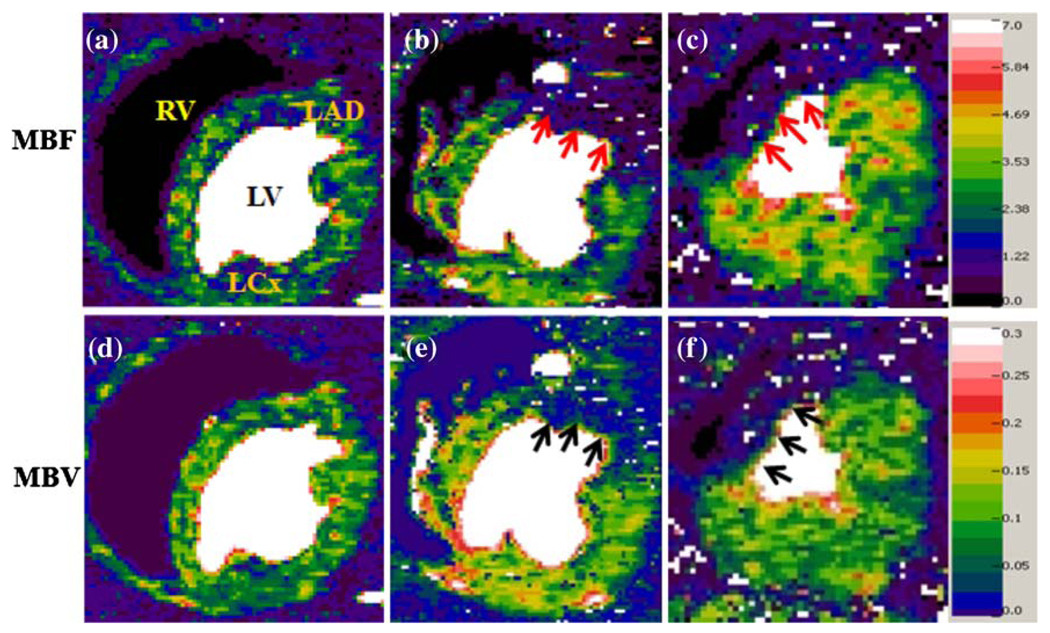
The MFR and MVR in the LAD- and LCx-perfused regions are shown in Fig. 3. In the stenosis-subtended LAD region, both dobutamine and dipyridamole induced significantly higher MFRs (ca. 2.5) in normal dogs than (ca. 1.3) in stenotic dogs. However, only dobutamine induced significant differences in MVR among dogs with increased stenosis severity. Figure 4 shows representative MBF and MBV maps during dobutamine stress from dog groups 2 (control), 4 (moderate stenosis), and 5 (severe stenosis).
Fig. 3.
Plots of myocardial flow reserve or MFR (a), and volume reserve or MVR (b) in both control dogs and dogs with LAD coronary stenosis. Reserve is calculated as stress/rest. The significant differences between LAD and LCx regions are denoted by asterisks. *p < 0.05 and **p < 0.01
Fig. 4.
Examples of MBF and MBV maps with different stenosis severity during dobutamine-induced hyperemia: normal (a and d), moderate stenosis (b and e), and severe stenosis (c and f). The color scale for MBF is from 0 to 7 mL/min/g and for MBV from 0 to 0.3 mL/g or 30 mL/100 g. MBF in the LAD-subtended regions (b and c) shows similar reduction for both moderate and severe stenosis (arrows), but MBV in the same regions (e and f) reveals difference with slightly lower intensity in map (f) (arrows)
Correlation of MBV and MBF with RPP
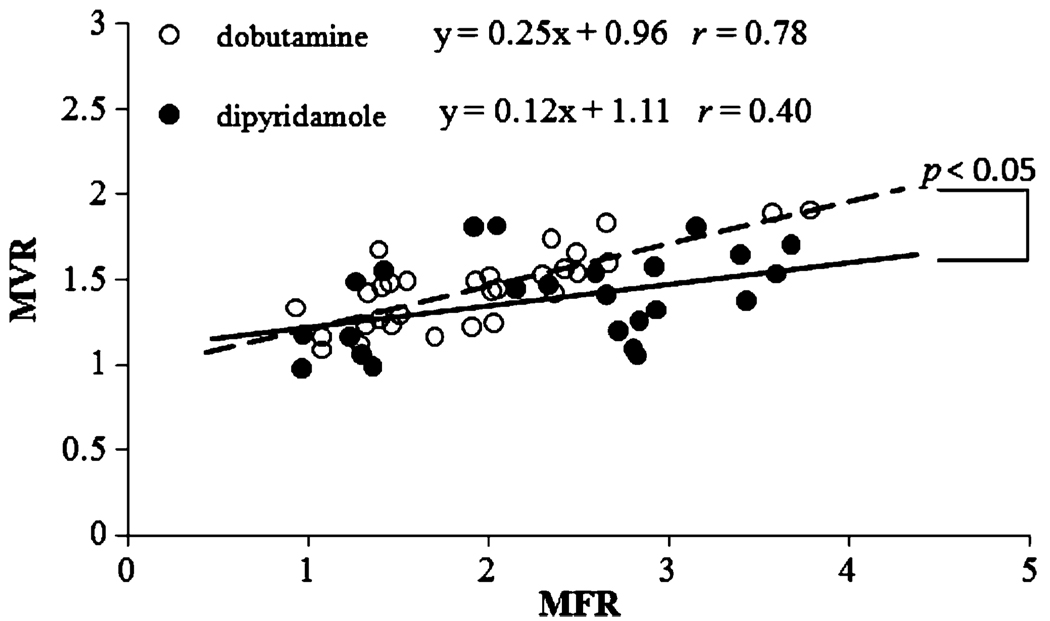
Figure 5 shows the linear correlations between MVR and MFR during dobutamine and dipyridamole stress. For each stressor, data are combined from those measured in LAD and LCx regions in all dogs with and without coronary stenosis. The slope of the correlation was twofold greater with dobutamine than with dipyridamole (p < 0.05). Therefore, for an equivalent change in MBF, blood volume change, or capillary recruitment, is greater during dobutamine stress than during dipyridamole vasodilation.
Fig. 5.
Correlations of MFR and MVR for the LAD and LCx-perfused regions during dipyridamole and dobutamine stress. Overall, MVR is more closely coupled with MFR during dobutamine-induced hyperemia than with dipyridamole. Changes in MBV were also significantly greater under dobutamine stress than similar changes in MBF
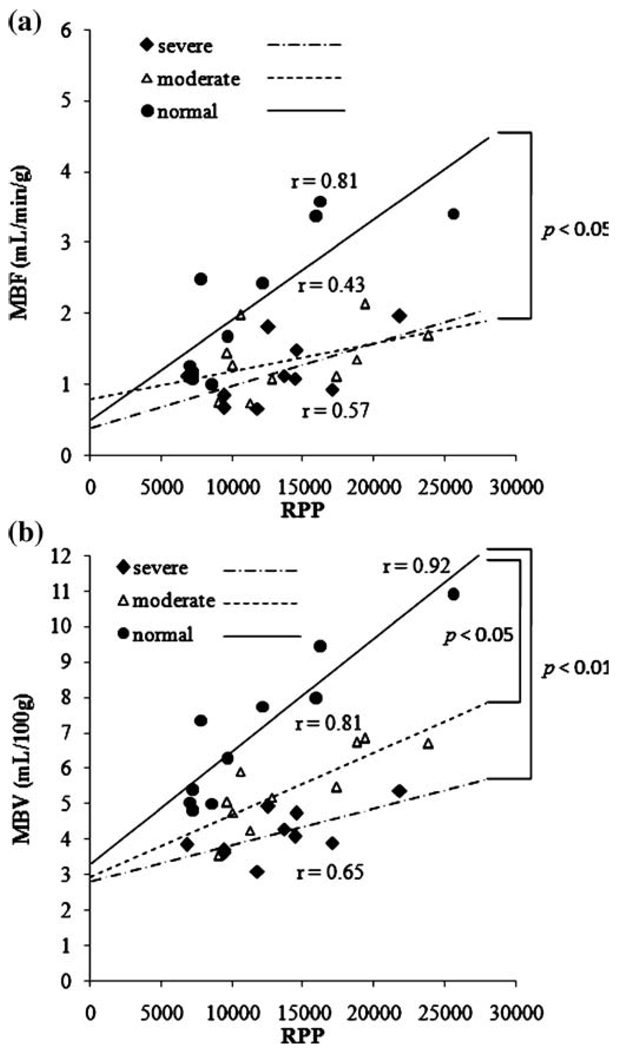
Figure 6 demonstrates the relationship of LAD MBF and MBV to global myocardial oxygen demand indexed by RPP during dobutamine stress. In control dogs, both MBF and MBV are closely correlated with global myocardial oxygen demand. In dogs with moderate and severe coronary stenosis, the association of LAD MBF and global oxygen demand is reduced, as indicated by the smaller slope (Fig. 6a). There is a significant difference in the slope of linear correlation of MBF between control and moderate groups, but no difference was observed between control and severe or between moderate and severe groups. On the other hand, the severity of this dissociation in MBV vs. oxygen demand progressively increased with increasing stenosis severity (Fig. 6b). Analysis of covariance with all three groups showed statistically significant differences (p = 0.01). By pairwise comparison, the difference in the slopes of the control and severe groups was statistically significant. The difference between control and moderate groups also trended toward significance.
Fig. 6.
Correlations between MBF and RPP (a) and between MBV and RPP (b). There is a similar dissociation between MBF and RPP in the presence of moderate and severe stenosis. However, the two stenosis severities lead to different dissociations of MBV and RPP
Discussion
In this study, we have successfully determined regional MBF and MBV at both rest and after pharmacological hyperemia in the absence or presence of acute coronary stenosis with use of a newly developed first-pass perfusion mapping method. These measurements were validated against microsphere and 99mTc-RBC methods. Changes in MBF and MBV due to acute coronary artery stenosis were clearly seen and are in accordance with other reports [22, 23]. More importantly, MBV was found to be more closely associated with increases in oxygen demand than MBF and appeared to better differentiate between moderate and severe stenosis under dobutamine stress. This technical advance may allow for further exploration of MRI for assessing the pathophysiology of coronary artery disease and other cardiac/metabolic diseases involving impaired myocardial microcirculation.
As expected, during dobutamine hyperemia, both MBF and MBV were blunted in the myocardium distal to the coronary stenosis compared with the remote LCx-perfused myocardium. While MFR was reduced similarly for moderate and severe stenosis, the decreases in MVR were proportional to stenosis severity (Fig. 3). One consistent finding for MFR and MVR was that the normal LCx-perfused myocardium also showed a similar progressive attenuation. This finding is in general agreement with several other reports; one utilizing positron emission tomography (PET) to quantify perfusion in patients [22] and one using radiolabeled microspheres in dogs [24]. During dipyridamole vasodilation, stenosis reduced MFR significantly without much decrease in MVR, although both reserves in the remote LCx regions were significantly greater than in post-stenosis LAD regions. This suggests that, without much change in global oxygen demand, myocardial capillary perfusion is not strongly associated with myocardial capillary blood volume or MBV and MBF increases are solely mediated by an increase in blood velocity due to arteriolar vasodilation, as suggested by MCE studies in dogs [4] and humans [6].
This point is more evident in Fig. 5, where MFR and MVR correlations are shown during dipyridamole and dobutamine hyperemia. The dobutamine slope is twofold greater than dipyridamole and the correlation coefficient with dobutamine is significantly larger than with dipyridamole. These results agree well with reports using MCE in the presence of chronic coronary stenosis [25, 26]. This phenomenon is likely due to the increase in MBF secondary to the increase in global oxygen demand during dobutamine hyperemia. This increase in oxygen demand prompts the increase in capillary density or MBV. Conversely, dipyridamole induces much less of an increase in oxygen demand and MBV increases to a lesser extent. The role of limiting MBV by coronary stenosis in settings of increased O2 demand is clearly demonstrated in Fig. 6.MBF and MBV correlate well with global myocardial O2 demand during dobutamine stress in control dogs, but coronary stenosis progressively dissociates this relationship. This observation agrees well with another report studying patients with single-vessel coronary disease [23]. Furthermore, MBF appears to be very sensitive to the detection of coronary stenosis, but failed to distinguish the difference between moderate and severe stenosis. On the other hand, progressive dissociation with stenosis severity is more apparent by evaluating MBV, indicating better specificity in the detection of coronary stenosis severity.
Therefore, coronary stenosis and different stressors appear to modify the correlation of MBF and MBV. For this reason, we did not attempt to derive a closer relationship between MBF and MBV, as reported by others [27, 28]. The role of MBV appears to become increasingly more important in the setting of coronary stenosis. When MBF reserve is exhausted during hyperemia, further demand for O2 requires recruitment of capillary vessels, resulting in an increase in MBV. Thus, evaluating changes in MBV may be able to pinpoint viable vs. non-viable myocardium. In other words, when both MBF and MBV reserves are exhausted, the myocardial tissue is unlikely to survive. However, the precise mechanism for such decoupling of MBV and MBF with myocardial oxygen demand remains unclear. Further studies on their relationship with coronary driving pressure and regional myocardial oxygen status are warranted to elucidate this complex issue.
There are several limitations to our study. First, the microsphere and 99mTc-labeled RBC reference values were measured from dissected heart tissue. All attempts were made to keep the dissection regions similar to the ROIs drawn on MR images. Also, microsphere and 99mTc measurements were not performed on all dogs. Second, the turboFLASH sequence used in this study is relatively noisy, and may induce certain calculation errors. Fortunately, the algorithm to calculate first-pass perfusion parameters (MBF and MBV) is relatively insensitive to noise. Further investigation may involve the use of a trueFISP type of sequence to improve image contrast and thus the accuracy of MBF and MBV measurements.
In conclusion, our fast perfusion mapping technique appears to be a promising non-invasive technique for the quantitative evaluation of regional myocardial perfusion. Assessment of both MBF and MBV changes may facilitate a more comprehensive evaluation of myocardial ischemia in settings of significant coronary artery stenosis. The strong association of MBV with myocardial O2 demand confirms other findings and suggests that evaluating MBV with first-pass perfusion may be a valuable tool for determining the functional relevance of stenosis.
Acknowledgements
This work was supported by a grant from the National Institutes of Health R01 HL74019-01
Contributor Information
Kyle S. McCommis, Email: mccommisk@mir.wustl.edu, Mallinckrodt Institute of Radiology, Washington University School of Medicine, St. Louis, MO, USA.
Thomas A. Goldstein, Email: tomgoldstein1@gmail.com, Mallinckrodt Institute of Radiology, Washington University School of Medicine, St. Louis, MO, USA.
Dana R. Abendschein, Email: dabensc@dom.wustl.edu, Center for Cardiovascular Research, Washington University School of Medicine, St. Louis, MO, USA.
Bernd Misselwitz, Email: bernd.misselwitz@bayerhealthcare.com, Bayer Schering Pharma AG, Berlin, Germany.
Thomas Pilgram, Email: pilgramt@wustl.edu, Mallinckrodt Institute of Radiology, Washington University School of Medicine, St. Louis, MO, USA.
Robert J. Gropler, Email: groplerr@mir.wustl.edu, Mallinckrodt Institute of Radiology, Washington University School of Medicine, St. Louis, MO, USA; Center for Cardiovascular Research, Washington University School of Medicine, St. Louis, MO, USA.
Jie Zheng, Email: zhengj@mir.wustl.edu, Mallinckrodt Institute of Radiology, Washington University School of Medicine, St. Louis, MO, USA; Cardiovascular Imaging Lab, 510 South Kingshighway Blvd., Campus Box 8225, St. Louis, MO, 63110, USA, Tel.: +1-314-7474608 Fax: +1-314-7473882.
References
- 1.Maher VM. Coronary atherosclerosis stabilization: an achievable goal. Atherosclerosis. 1995;118 Suppl:S91–S101. [PubMed] [Google Scholar]
- 2.Schwitter J, Nanz D, Kneifel S. Assessment of myocardial perfusion in coronary artery disease by magnetic resonance: a comparison with positron emission tomography and coronary angiography. Circulation. 2001;103:2230–2235. doi: 10.1161/01.cir.103.18.2230. [DOI] [PubMed] [Google Scholar]
- 3.Picano E, Molinaro S, Pasanisi E. The diagnostic accuracy of pharmacological stress echocardiography for the assessment of coronary artery disease: a meta-analysis. Cardiovasc Ultrasound. 2008;6:30. doi: 10.1186/1476-7120-6-30. [DOI] [PMC free article] [PubMed] [Google Scholar]
- 4.Le DE, Bin JP, Coggins MP, et al. Relation between myocardial oxygen consumption and myocardial blood volume: a study using myocardial contrast echocardiography. J Am Soc Echocardiogr. 2002;15:857–863. doi: 10.1067/mje.2002.121275. [DOI] [PubMed] [Google Scholar]
- 5.Möhlenkamp S, Behrenbeck TR, Lerman A, et al. Coronary microvascular functional reserve: quantification of long-term changes with electron-beam CT preliminary results in a porcine model. Radiology. 2001;221:229–236. doi: 10.1148/radiol.2211001004. [DOI] [PubMed] [Google Scholar]
- 6.Firschke C, Andrássy P, Linka AZ, Busch R, Martinoff S. Adenosine myocardial contrast echo in intermediate severity coronary stenoses: a prospective two-center study. Int J Cardiovasc Imaging. 2007;23:311–321. doi: 10.1007/s10554-006-9157-9. [DOI] [PubMed] [Google Scholar]
- 7.Bin JP, Le DE, Jayaweera AR, et al. Direct effects of dobutamine on the coronary microcirculation: comparison with adenosine using myocardial contrast echocardiography. J Am Soc Echocardiogr. 2003;16:871–879. doi: 10.1067/S0894-7317(03)00423-1. [DOI] [PubMed] [Google Scholar]
- 8.Lindner JR, Skyba DM, Goodman NC, Jayaweera AR, Kaul S. Changes in myocardial blood volume with graded coronary stenosis. Am J Physiol. 1997;272:H567–H575. doi: 10.1152/ajpheart.1997.272.1.H567. [DOI] [PubMed] [Google Scholar]
- 9.Wilke N, Kroll K, Merkle H, et al. Regional myocardial blood volume and flow: first-pass MR imaging with polylysine-Gd-DTPA. J Magn Reson Imaging. 1995;5:227–237. doi: 10.1002/jmri.1880050219. [DOI] [PMC free article] [PubMed] [Google Scholar]
- 10.Kahler E, Waller C, Rommel E, et al. Perfusion-corrected mapping of cardiac regional blood volume in rats in vivo. Magn Reson Med. 1999;42:500–506. doi: 10.1002/(sici)1522-2594(199909)42:3<500::aid-mrm12>3.0.co;2-3. [DOI] [PubMed] [Google Scholar]
- 11.Christian TF, Rettman DW, Aletras AH, et al. Absolute myocardial perfusion in canines measured by using dual-bolus first-pass MR imaging. Radiology. 2004;232:677–684. doi: 10.1148/radiol.2323030573. [DOI] [PubMed] [Google Scholar]
- 12.Waller C, Kahler E, Hiller KH, et al. Myocardial perfusion and intercapillary blood volume in rats at rest and with coronary dilatation: MR imaging in vivo with use of a spin-labeling technique. Radiology. 2000;215:189–197. doi: 10.1148/radiology.215.1.r00ap07189. [DOI] [PubMed] [Google Scholar]
- 13.Streif JU, Nahrendorf M, Hiller KH, et al. In vivo assessment of absolute perfusion and intercapillary blood volume in the murine myocardium by spin labeling magnetic resonance imaging. Magn Reson Med. 2005;53:584–592. doi: 10.1002/mrm.20327. [DOI] [PubMed] [Google Scholar]
- 14.McCommis KS, Goldstein TA, Zhang H, et al. Quantification of myocardial blood volume during dipyridamole and dobutamine stress: a perfusion CMR study. J Cardiovasc Magn Reson. 2007;9:785–792. doi: 10.1080/10976640701545206. [DOI] [PubMed] [Google Scholar]
- 15.Goldstein TA, Jerosch-Herold M, Misselwitz B, et al. Fast mapping of myocardial blood flow with MR first-pass perfusion imaging. Magn Reson Med. 2008;59:1394–1400. doi: 10.1002/mrm.21559. [DOI] [PubMed] [Google Scholar]
- 16.Nohara R, Abendschein DR, Bergmann SR. Transmural gradients of coronary flow reserve with physiologically and morphometrically defined stenoses in dogs. Am Heart J. 1989;118:1167–1175. doi: 10.1016/0002-8703(89)90005-7. [DOI] [PubMed] [Google Scholar]
- 17.Heymann MA, Payne BD, Hoffman JI, Rudolph AM. Blood flow measurements with radionuclide-labeled particles. Prog Cardiovasc Dis. 1977;20:55–79. doi: 10.1016/s0033-0620(77)80005-4. [DOI] [PubMed] [Google Scholar]
- 18.Fukuyama T, Sobel BE, Roberts R. Microvascular deterioration: implications for reperfusion. Cardiovasc Res. 1984;18:310–320. doi: 10.1093/cvr/18.5.310. [DOI] [PubMed] [Google Scholar]
- 19.Goldstein TA, Zhang H, Misselwitz B, Gropler RJ, Zheng J. Improvement of quantification of myocardial first-pass perfusion mapping: a temporal and spatial wavelet denoising method. Magn Reson Med. 2006;56:439–445. doi: 10.1002/mrm.20950. [DOI] [PubMed] [Google Scholar]
- 20.Jerosch-Herold M, Swingen C, Seethamraju RT. Myocardial blood flow quantification with MRI by model-independent deconvolution. Med Phys. 2002;29:886–897. doi: 10.1118/1.1473135. [DOI] [PubMed] [Google Scholar]
- 21.Hoeft A, Sonntag H, Stephan H, Kettler D. Validation of myocardial oxygen demand indices in patients awake and during anesthesia. Anesthesiology. 1991;75:49–56. doi: 10.1097/00000542-199107000-00009. [DOI] [PubMed] [Google Scholar]
- 22.Sambuceti G, Marzullo P, Giorgetti A, et al. Global alteration in perfusion response to increasing oxygen consumption in patients with single-vessel coronary artery disease. Circulation. 1994;90:1696–1705. doi: 10.1161/01.cir.90.4.1696. [DOI] [PubMed] [Google Scholar]
- 23.Jagathesan R, Barnes E, Rosen SD, Foale R, Camici PG. Dobutamine-induced hyperaemia inversely correlates with coronary artery stenosis severity and highlights dissociation between myocardial blood flow and oxygen consumption. Heart. 2006;92:1230–1237. doi: 10.1136/hrt.2005.075101. [DOI] [PMC free article] [PubMed] [Google Scholar]
- 24.Wu JC, Yun JJ, Dione DP, et al. Severe regional ischemia alters coronary flow reserve in the remote perfusion area. J Nucl Cardiol. 2000;7:43–52. doi: 10.1067/mnc.2000.99189. [DOI] [PubMed] [Google Scholar]
- 25.Bin JP, Pelberg RA, Wei K, et al. Dobutamine versus dipyridamole for inducing reversible perfusion defects in chronic multivessel coronary artery stenosis. J Am Coll Cardiol. 2002;240:167–174. doi: 10.1016/s0735-1097(02)01908-3. [DOI] [PubMed] [Google Scholar]
- 26.Wei K, Jayaweera AR, Firoozan S, et al. Basis for detection of stenosis using venous administration of micro-bubbles during myocardial contrast echocardiography: bolus or continuous infusion? J Am Coll Cardiol. 1998;32:252–260. doi: 10.1016/s0735-1097(98)00212-5. [DOI] [PubMed] [Google Scholar]
- 27.Wu XS, Ewert DL, Liu YH, Ritman EL. In vivo relation of intramyocardial blood volume to myocardial perfusion. Evidence supporting microvascular site for autoregulation. Circulation. 1992;85:730–737. doi: 10.1161/01.cir.85.2.730. [DOI] [PubMed] [Google Scholar]
- 28.Li X, Springer CS, Jr, Jerosch-Herold M. First-pass dynamic contrast-enhanced MRI with extravasating contrast reagent: evidence for human myocardial capillary recruitment in adenosine-induced hyperemia. NMR Biomed. 2009;2:148–157. doi: 10.1002/nbm.1293. [DOI] [PubMed] [Google Scholar]


