

Abstract
Tumor-associated macrophages (TAMs) are diverse population containing multiple subtypes. M2 macrophages promote tumor growth and metastasis, in part by secreting a wide range of proangiogenic factors and growth factors. Selective depletion of M2 macrophages has been evaluated as a novel approach to anti-cancer therapy. In this study, a dual magneto-optical imaging probe, PG-Gd-NIR813 was synthesized and evaluated for noninvasive assessment of TAMs after intravenous injection. PG-Gd-NIR813 injected in nude rats bearing C6 tumors showed high uptake of the polymeric contrast agent in the tumor at 1 and 48 h after injection both in vivo and ex vivo optical imaging. T1-weighted MR imaging results showed accumulation of PG-Gd-NIR813 into the tumor necrotic area, which was confirmed by TUNEL staining of resected tumors. The uptake of PG-Gd-NIR813 within tumor necrosis decreased after animals were treated by the macrophage depleting agent. Immunohistochemical staining demonstrated that PG-Gd-NIR813 colocalized with CD68 (marker for macrophages) and CD169 (marker for activated macrophages), but not with CD163 (residential macrophages). Using combined near-infrared fluorescence imaging and MRI, we demonstrated that the accumulation of PG-Gd-NIR813 in tumors was mediated through M2 TAMs. Therefore, poly(L-glutamic acid) based reagents could be potentially used to image response to antitumor therapies targeted at M2 TAMs. Furthermore, poly(L-glutamic acid) is a promising carrier for candidate immunotherapeutics targeting M2 TAMs.
1. Introduction
It is well known that solid tumors are frequently infiltrated by macrophages [1–3]. A high degree of macrophage infiltration correlates with a poor prognosis in many human malignancies, including gliomas, colon, breast, and lung carcinomas [4]. On the other hand, there are contradicting data showing macrophage infiltration correlates with better prognosis [5, 6]. Macrophages that produce pro-inflammatory mediators and exert antitumor cytotoxicity are referred to as classically activated (or M1) macrophages [3]. These macrophages are commonly found during infections and inflammation. A different subset of tumor-associated macrophages (TAMs), called alternatively activated (or M2) macrophages, are reported to promote tumor growth and metastasis, in part by secreting a wide range of proangiogenic factors and growth factors [1–3]. In addition, M2 TAMs are thought to enhance tumor growth and metastasis by suppressing the activity of CD8+ T cells [7]. For these reasons, selective depletion of M2 TAMs has been considered as a novel approach to anti-cancer therapy [8–10].
The ability to define pharmacodynamic endpoints using non-invasive imaging modalities will be an essential component of the preclinical and clinical studies of targeted anti-TAM therapy. At present, the response of tumors to drug therapy is determined mainly by computed tomography (CT) or magnetic resonance imaging (MRI). These modalities assess changes in tumor size over several weeks or months and are unable to show changes in TAM density early in therapy. The use of imaging techniques like 18F-fluoro-deoxy-glucose positron emission tomography ([18F]FDG-PET) and dynamic contrast-enhanced MRI (DCE-MRI) allows metabolic and functional changes in tumors to be detected early in the course of drug therapy. However, [18F]FDG-PET and DCE-MRI cannot directly distinguish between tumor cells and TAMs. In particular, these techniques cannot distinguish M1 macrophages from M2 macrophages. Therefore, a suitable imaging technique is needed for detection of M2 macrophage sub-population, and for direct assessment of the depletion of TAMs. Recently, a magneto-fluorescent nanoparticle was shown to label endogenous TAMs selectively and can be tracked noninvasively using fluorescence molecular tomography, T2-weighted MRI, and microscopy [11].
We have previously reported on a biodegradable macromolecular MRI contrast agent, poly(L-glutamic acid)-Gd-chelated p-aminobenzyl-diethylenetriaminepentaacetic acid (PG-Gd), that localizes to tumor peri-necrotic areas [12]. In this study, we seek to evaluate the use of a dual magneto-optical imaging probe, PG-Gd-NIR813, for noninvasive assessment of TAMs after intravenous injection.
2. Materials and Methods
2.1. Materials
Poly(L-glutamic acid) (PG) sodium salt, 1,3-diisopropylcarbodiimide, pyridine, 4-dimethylaminopyridine, trifluoroacetic acid (TFA), gadolinium (III) chloride hexahydrate, 1-ethyl-3-(3-dimethylaminopropyl)-carbodiimide (EDC), 2-(morpholino)ethanesulfonic acid buffer (MES), IR-783 dye, N-hydroxysuccinimide (NHS), N,N-diisopropylethylamine, and all the other reagents and solvents used were purchased from Sigma-Aldrich (St. Louis, MO). N-tert-butoxycarbonyl-1,5-diamino- pentane toluenesulfonic acid salt was purchased from Novabiochem (San Diego, CA). 4-Mercaptobenzoic acid was purchased from TCI (Portland, Oregon). p-Aminobenzyl-diethylenetriaminepentaacetic acid(t-butyl ester) (DTPA ester) was obtained from Macrocyclics (Dallas, TX). Spectra/Pro 7 dialysis tubing with a molecular weight cut-off of 10,000 and PD-10 columns were purchased from Amersham-Pharmacia Biotech (Piscataway, NJ).
Biotinylated secondary antibody, streptavidin-horseradish peroxidase (streptavidin-HRP), 3,3′-diaminobenzidine (DAB), hematoxylin, luciferin, and 4% paraformaldehyde were purchased from Fisher Scientific (Waltham, MA). Rat anti-mouse CD31 monoclonal antibody was purchased from Millipore (Billerica, MA). Alexa Fluor 594-tagged goat anti-rat IgG and RPMI-1640 phenol red free cell culture medium were purchased from Invitrogen (Carlsbad, CA). Rat anti-mouse CD68, mouse anti-rat CD68, mouse anti-rat CD163, and mouse anti-rat CD169 monoclonal antibodies were obtained from AbD Serotec (Raleigh, NC). IRDye 680 goat anti-mouse IgG was bought from LI-COR Biosciences (Lincoln, NE). Terminal deoxynucleotidyl transferase dUTP nick-end labeling (TUNEL) kit was bought from R&D Systems (Minneapolis, MN). Isoflurane was obtained from Baxter (Deerfield, IL).
2.2. Synthesis of PG-Gd-NIR813
PG-Gd-NIR813 was synthesized according to the previously published method of Melancon, et al. [13] Briefly, DTPA ester (2.1 g, 2.79 mmol) was conjugated to PG (Mn, 41,400; 1 g, 7.75 mmol of carboxylic unit) in dimethylformamide (DMF) using 1,3-diisopropylcarbodiimide (403 mg, 3.1 mmol) as a coupling agent. The t-butyl protective groups were removed by treatment with trifluoroacetic acid (TFA) at 4°C overnight to yield PG-DTPA. To chelate PG-DTPA with Gd3+, a solution of GdCl3·6H2O in 0.1 M sodium acetate was added into a solution of PG-DTPA in 0.1 M sodium acetate (pH 5.5) in small fractions. The solution was then dialyzed extensively against water (molecular weight cut-off, 10,000) until no free Gd3+ was detected, and lyophilized. NIR813 (4.17 mg, 0.0045 mmol) dissolved in 200 μL of DMF was added to a solution of PG-DTPA-Gd (90 mg, 0.698 mmol Glu) in 0.1 M 2-(N-morpholino)ethanesulfonic acid (MES) buffer (2 mL) in the presence of 1-ethyl-3-(3-dimethylaminopropyl)carbodiimide (EDC) (10 mg, 0.005 mmol). The reaction mixture was stirred at 4°C overnight while protected from light, filtered through a 0.2-μm filter, dialyzed against phosphate-buffered saline (PBS) and water sequentially, and lyophilized. The yield of PG-Gd-NIR813 was 64.6 mg (72%). The conjugate contained 10% (w/w) or 13% (mol Gd/mole repeating unit) and about 4.4% (w/w) or 1% (mole NIR813 dye/mole repeating unit).
Gel permeation chromatography (GPC) was performed on a Waters (Milford, MA) high-performance liquid chromatography (HPLC) system consisting of a 600 controller, a 717 plus auto sampler, and a Viscotek E-Zpro triple detector (Viscotek, Houston, TX) that records refractive index, viscosity, and light-scattering signals. The samples were separated using a TSK-G4000PW 4.6 mm × 30 cm column (TosoHaas, Montgomeryville, PA) eluted with PBS containing 0.1% LiBr at a flow rate of 1.0 ml/min. Number-average molecular weights of the polymer conjugates were calculated using Viscotek TriSEC GPC software. Matrix-assisted laser desorption ionization mass spectrometry (MALDI) was performed by the Proteomics Core Laboratory, Department of Molecular Pathology, The University of Texas M. D. Anderson Cancer Center. Elemental analysis was performed by Galbraith Laboratories, Inc. (Knoxville, TN).
Analytical HPLC was carried out on an Agilent 1100 system (Wilmington, DE) equipped with a Vydac peptide and protein analytic C-18 column (Anaheim, CA). The sample was eluted with water and acetonitrile containing 0.1% TFA varying from 10% to 80% over 30 min. The fluorescence emission scan was measured using a Spex Fluorolog spectrofluorimeter (Jobin Yvon, Inc., Edison, NJ), while the fluorescence intensity of PG-Gd-NIR813 was measured using the 800-nm channel of an Odyssey Imaging system (LI-COR Biosciences).
2.3. In Vivo Imaging and Biodistribution Studies
Rat glioma C6 cells and mouse lymphoma A20 cells were obtained from the American Type Culture Collection (Rockville, MD). Cells were grown in RPMI-1640 plus 10% fetal bovine serum. Cells were trypsinized and suspended in Hanks’ balanced salt solution (HBSS, Sigma, Saint Louis, MO) before inoculation.
All animal studies were carried out in the Small Animal Imaging Facility at M. D. Anderson Cancer Center in accordance with institutional guidelines. C6 tumors were grown subcutaneously on the hind legs of nude rats (150 g; Harlan Sprague Dawley, Indianapolis, IN) by injecting 5 × 10⁵ viable tumor cells suspended in PBS. When tumors had grown to 0.8–1.0 cm in average diameter (about 3 weeks after inoculation), the rats (n=3) were brought into the imaging suite for pre-contrast optical and magnetic resonance imaging.
Prior to imaging, the rats were anesthetized with 2% isoflurane gas in oxygen. During imaging, the rats were maintained in an anesthetized state with 0.5%–1.5% isoflurane in oxygen. Optical imaging was done first using an IVIS imaging system (200 series) (Xenogen Corp., Alameda, CA) with indocyanine green (ICG) filter sets (excitation band/emission band: 710–760/810–875 nm). The field of view was 13.1 cm in diameter. The fluency rate for near-infrared fluorescence (NIRF) excitation light was 2 mW/cm2. The camera settings included maximum gain, 2 × 2 binning, 640 × 480 pixel resolution, and an exposure time of 0.8 s. After the pre-contrast optical imaging, MRI was performed on a 7.0-Tesla Bruker Biospec scanner. Axial and coronal images were obtained using a 950-mT/m, 5.7-cm-inner-diameter actively shielded gradient coil system (19,000 mT/m-s slew rate) and a 3.5-cm-inner-diameter volume radiofrequency coil. T1-weighted MR images (TE = 8.5 ms, TR = 900 ms) were acquired with a 6×6 cm field of view, 0.75-mm section thickness, 0.25-mm gap, and a 192 × 128 matrix.
After pre-contrast optical and MR imaging, the rats were injected intravenously with PG-Gd-NIR813 at a dose of 0.2 mmol Gd/kg (50 nmol NIR813/rat) at an injection volume of 500 μL per rat. Twenty-four hours later, the rats were subjected to optical imaging and MRI using the same methods and parameters as described above. After the imaging, the rats were sacrificed and tumors were collected for analysis.
For the biodistribution studies, rats bearing C6 tumors were injected intravenously with 0.2 mmol Gd/kg (50 nmol NIR813/rat) PG-Gd-NIR813 at an injection volume of 500 μL per rat. One group of rat was sacrificed at 1h (n=3) and another group at 48 h (n=4). Major organs were then collected and imaged ex vivo with Xenogen optical imaging system with the parameters listed above. Quantification of relative fluorescence was done using the Living Image Software v. 3.2. Tissues with p-values <0.05 were considered statistically significant using Student’s T-test.
2.4. Immunohistochemical Staining
The excised C6 tumors were frozen with optimum cutting temperature (OCT) compound (Sakura Finetek, Torrance, CA) and sectioned into 5-μm slices. The slides were washed with PBS and then fixed with 4% paraformaldehyde for 20 min at room temperature. After another PBS washing, the slices were incubated with 10% goat serum for 30 min at 37°C and then subjected to mouse anti-rat CD68 (pan-macrophages) monoclonal antibody (1:100) at 4°C overnight. IRDye 680 goat anti-mouse IgG (1:750) was applied as the secondary antibody for 1 h at room temperature. Sections were washed with PBS and mounted. The whole slices were scanned under an Odyssey imaging system (LI-COR). The fluorescence of PG-Gd-NIR813 was scanned using the 800-nm channel, while the fluorescence of IRDye 680-conjugated secondary antibody was scanned using the 700-nm channel. The micrograph was examined by fluorescence microscopy (Zeiss Axio Observer.Z1, Carl Zeiss MicroImaging GmbH, Göttingen, Germany). Adjacent slices were stained for CD163 (resident macrophages), CD169 (activated macrophages), TUNEL (apoptotic cells), and hemotoxylin and eosin. Cell nuclei were counterstained with 4′,6-diamidino-2-phenylindole (DAPI). The TUNEL staining was performed according to manufacturer’s protocol.
2.5. Macrophage Depletion
The macrophage-depletion agent, clodronate-loaded liposomes, was prepared according to a previously published procedure [14]. Ten BALB/c mice were inoculated in the hind legs with 1 × 10⁶ A20 cells. After 2–3 weeks of tumor inoculation, when the tumors reached about 6–8 mm in average diameter, the mice were divided into two groups (n=5/group). Group 1 was injected intravenously with 0.2 mL of clodronate-loaded liposomes (containing 1 mg of clodronate) to deplete the macrophages present in the tumors, whereas group 2 received saline as a control. Twenty-four hours after injection of the macrophage-depleting agent or saline, the mice were injected intravenously with PG-Gd-NIR813 at 0.2 mmol Gd/kg (~50 nmol NIR dye/mouse, 0.2 mL). After 24 h, the mice were imaged using fluorescence molecular tomography (FMT) (FMT2500; VisEn Medical, Bedford, MA). The excitation wavelength used was 750 nm and the emission wavelength was 780 nm. Anesthetized mice were maintained in a fixed position using the imaging cassette. Reconstruction of the three-dimensional maps of PG-Gd-NIR813 was done using TrueQuant 3D V1.2.1 software, and the data were expressed as mean fluorescent concentration.
3. Results and Discussion
3.1. PG-Gd-NIR813 Synthesis and Characterization
PG-Gd-NIR813 (Fig. 1A) is a dual modality MR/optical imaging agent. It contains 4% (wt/wt) NIR813 and 10% (wt/wt) Gd. It gives positive contrast with MRI and has relaxivity values, R1=8.6 and R2=25.1 mM−1s−1. As a dual-modality MR/optical imaging agent, PG-Gd-NIR813 also fluoresces at 813 nm.
Figure 1.

Structure of PG-Gd-NIR813.
3.2. In Vivo Biodistribution and Imaging of Tumor Necrotic Region
It was previously shown that PG-Gd-NIR813 drains into the sentinel lymph nodes after subcutaneous injection and can potentially differentiate metastatic from non-metastatic lymph nodes after subcutaneous injection in mice [13]. The biodistribution of PG-Gd-NIR813 in rats bearing C6 tumors at 1 h (n=3) and 48 h (n=4) following intravenous injection is shown in Fig. 2. At 1 h after injection, PG-Gd-NIR813 uptake was highest in the liver among all the major organs. PG-Gd-NIR813 uptake in the tumor was the second highest. Uptake of PG-Gd-NIR813 in all organs significantly decreased after 48 h. However, the tumor-to-heart, tumor-to-muscle, tumor-to-liver, and tumor-to-kidney ratios increased, from 4.87 ± 0.98, 1.42 ± 0.38, 0.56 ± 0.03, and 2.10 ± 0.07 at 1 h postinjection to 5.19 ± 0.31, 4.61 ± 1.41, 1.37 ± 0.25, and 2.32 ± 0.19 at 48 h postinjection, respectively.
Figure 2.

Biodistribution of PG-Gd-NIR813 in rats bearing C6 tumors at 1 h and 48 h following intravenous injection of 0.20 mmol Gd/kg (50 nmol of NIR dye) PG-Gd-NIR813. The fluorescence intensity of major organs and tumors was quantified (n=3 for 1h, n=4 for 48 h).
In vivo MR imaging clearly revealed significant accumulation of PG-Gd-NIR813 in C6 tumors at 48 h after intravenous injection of the contrast agent (Fig. 3A). PG-Gd-NIR813 was distributed toward the central zone of the tumor. The region of MR signal enhancement correlated with the necrotic area in the tumor (Fig. 3B, hematoxylin and eosin staining, whole tumor). Using a fluorescence microscope, we found that PG-Gd-NIR813 co-localized with the TUNEL-positive apoptotic cells, but not with the viable tumor cells (Fig. 3B, fluorescent images). These results confirm that PG-Gd-NIR813 targets the tumor apoptotic/necrotic area.
Figure 3.
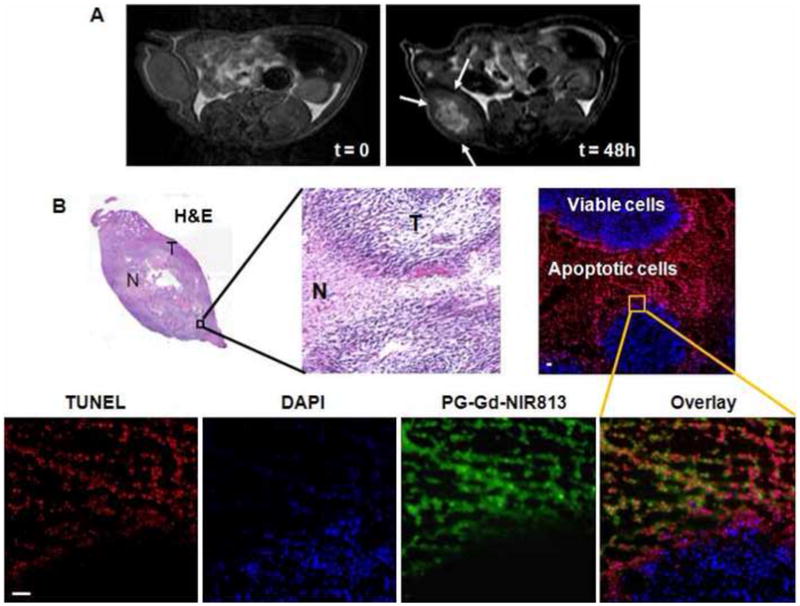
(A) Representative MR imaging of C6 tumor-bearing nude rats, before and 48 h after i.v. injection of PG-Gd-NIR813 at a dose of 0.20 mmol of Gd/kg (50 nmol NIR813). Arrows, tumors. (B) Histological evaluation of tumor distribution of PG-Gd-NIR813 in C6-bearing nude rats after in vivo imaging. H&E staining shows necrotic regions in the tumors as light pink staining. Fluorescent micrographs of the adjacent tumor slide depicted the co-localization of PG-Gd-NIR813 with TUNEL-stained tumor cells. Cell nuclei were counterstained with DAPI. N, necrotic area; T, tumor. Bar, 50 μm.
3.3. Tumor-infiltrating Macrophage Involved in the Uptake of PG-Gd-NIR813
A previous study illustrated that biotin-L-PG-DTPA-Gd colocalized with macrophages in the necrotic tissue in OCA-1 tumors, suggesting that the affinity of PG-DTPA-Gd for necrotic tissue may be mediated through macrophages [15]. However, the mechanism behind the selective accumulation of poly(L-glutamic acid) polymer in tumor necrotic regions is not entirely clear. To elucidate this mechanism, we labeled the tumor cells with specific macrophage markers, including monoclonal antibodies against CD68 (ED1, pan-monocyte/macrophage marker), CD163 (ED2, mature tissue/residential macrophages), and CD169 (ED3, activated macrophages) [5, 16]. Immunohistochemical analyses demonstrated the presence of CD68+ macrophages residing in both the outer margins of tumor nodules and the peri-necrosis regions of C6 tumors. CD163+ macrophages were present mainly at the outer margins of tumor nodules, while CD169+ macrophages were primarily localized to the peri-necrotic area (Fig. 4).
Figure 4.

Colocalization of macrophages and PG-Gd-NIR813 in C6 tumors 48 h after i.v. injection. Tumor-associated macrophages, including CD68 (pan-macrophages/monocytes), CD169 (activated macrophages), and CD163 (residential macrophages), were stained with different markers (red). Green represents the pseudo-color of PG-Gd-NIR813 fluorescence. The cell nuclei were counterstained with DAPI (blue). Bar for whole tumors, 2 mm; for micrographs, 50 μm.
The distribution of CD163+ macrophages at the border of tumor nodules and of newly recruited CD68+ macrophages scattered throughout the tumors was in agreement with a previous report [5]. CD163+ residential macrophages are regarded as classically activated macrophages (M1) that suppress tumor growth, whereas newly recruited CD68+ macrophages are alternatively activated macrophages (M2) that produce angiogenic factors that stimulate tumor progression [5]. PG-Gd-NIR813 was colocalized with CD68+ in the tumor peri-necrotic region but not with CD163+ macrophages in the periphery of the tumor (Fig. 4). Therefore, it is likely that PG-Gd-NIR813 was deposited in the tumor peri-necrotic region after being phagocytized by the infiltrating M2. Furthermore, PG-Gd-NIR813 was found to colocalize with CD169+ activated macrophages in tumor necrotic regions (Fig. 4). Landstrom et al [16] reported that there was a positive correlation between the percentage of TUNEL-positive apoptotic cells and the extent of CD169+ infiltration in prostate tumors. These results suggest that the distribution of PG-Gd-NIR813 to tumor necrotic regions may involve activated tumor-infiltrating macrophages that play an important role in phagocytosis and the removal of dead tumor cells.
To further test the hypothesis that infiltration macrophages are responsible for PG-Gd-NIR813’s distribution to tumor peri-necrotic areas, BALB/c mice bearing A20 syngeneic tumors were treated with intravenous injection of clodronate-loaded liposomes to deplete circulation macrophages. FMT imaging showed that tumor-bearing mice treated with clodronate-loaded liposomes had significantly lower tumor uptake of PG-Gd-NIR813 than the control mice (Fig. 5A). Quantitative analysis of relative fluorescence intensity revealed a decrease in PG-Gd-NIR813 signals of about sevenfold in tumors from mice with the macrophage-depleting treatment compared with those without treatment (Fig. 5B). Immunohistochemical evaluation showed colocalization between PG-Gd-NIR813 and CD68+ macrophages in the tumor necrotic regions of A20 tumors in mice without receiving a macrophage-depleting agent. However, 24 hr following macrophage depletion, both the accumulation of PG-Gd-NIR813 in tumor necrotic areas and the population of CD68+ macrophages significantly decreased (Fig. 5C, arrows). In tumor necrotic areas where CD68+ macrophages were not depleted, strong PG-Gd-NIR813 fluorescence signals could still be found (Fig. 5C, arrowheads). Similar results were found in nude rats bearing C6 glioma tumors, where complete loss of the fluorescent signal of PG-Gd-NIR813 in tumor necrotic areas was achieved after administration of the macrophage-depleting agent (Fig. 5D). Both CD68+ and CD169+ macrophages were completely depleted in the necrotic regions of A20 tumors in mice injected with liposomal clodronate.
Figure 5.


Intra-tumoral distribution of PG-Gd-NIR813 following macrophage depletion treatment. (A) In vivo FMT imaging of PG-Gd-NIR813 in A20 tumor-bearing BALB/c mice with or without treatment with clodronate-loaded liposomes containing 1 mg of clodronate. Twenty-four hours after i.v. injection of the clodronate-loaded liposomes or saline, all the mice received 0.2 mmol/kg of PG-Gd-NIR813 and were imaged again 24 hours later (n=5/group). (B) Fluorescent intensities of PG-Gd-NIR813 in A20 tumors from FMT imaging in mice injected with macrophage-depleting agent compared with saline control. (C) Fluorescence micrographs of A20 tumors in mice injected with PG-Gd-NIR813 (green) with or without macrophage depletion. The tumor-associated macrophages were stained with CD68 (red). The adjacent slices were stained with H&E. N, necrosis. Arrows, tumor necrosis region with complete depletion of macrophages. Arrowheads, tumor necrotic area where CD68+ macrophages are partially depleted. Bar, 2 mm. (D) Fluorescence micrographs of C6 tumors in nude rats injected with PG-Gd-NIR813 (green) with or without macrophage depletion. The tumor-associated macrophages were stained with CD68 and CD169 in two adjacent slices. Adjacent slices were stained with H&E. N, necrosis. Bar, 2 mm.
Our current data indicate that PG-Gd-NIR813 was phagocytized by M2 subset of tumor-infiltrating macrophages, which are recruited to the peri-necrotic areas of tumors. The role of these infiltrating macrophages is likely multifaceted, involving both the removal of tumor debris and the promotion of angiogenesis. Similar mechanisms may have contributed to the accumulation of PG-TXL conjugate in tumor necrotic areas [15]. As M2 macrophages in general promote tumor growth, selective retaining of PG-TXL by M2 macrophages, and subsequent intratumoral release if Taxol may be partially responsible for the significantly increased antitumor efficacy of PG-TXL used alone [17, 18] and in combination with radiotherapy as compared to the parent drug [19].
4. Conclusion
Our results show that PG-Gd-NIR813 is a dual-modality optical/MR imaging agent suitable for imaging TAM behavior in vivo. PG-Gd-NIR813 has increased uptake into the tumor and selectively accumulates in the necrotic/apoptotic region of the tumor. Immunohistochemical analysis showed that PG-Gd-NIR813 co-localizes with CD68 (newly recruited macrophages) and CD169 (activated macrophages) but not with CD163 (residential macrophages), suggesting that tumor-infiltrating activated macrophages (M2) may play an important role in the phagocytosis of not only apoptotic tumor cells but also PG-Gd-NIR813. The macrophage depletion experiment verified that the accumulation of PG-Gd-NIR813 in tumor necrotic areas correlated well with the amount and distribution of tumor-infiltrating macrophages in that area. This indicates that PG-Gd-NIR813 is an indicator for the presence of TAMs and may be used to track TAMs in vivo.
Acknowledgments
We thank Dawn Chalaire for editing the manuscript. This work was supported in part by a grant from the National Institutes of Health (R01 CA119387), a Seed Grant through the Alliance for NanoHealth by the Department of Army Telemedicine and Advanced Technology Research Center (W81XWH-07-2-0101), a grant from John S. Dunn, Sr. Distinguished Chair in Diagnostic Imaging (to Dr. Murphy) by the John S. Dunn Foundation, a start-up fund by M.D. Anderson Cancer Center to DZ, and an Odyssey Fellowship (to MPM). The Odyssey Fellowship is supported by the Odyssey Program and the Cockrell Foundation for Scientific Achievement at The University of Texas M. D. Anderson Cancer Center. We also acknowledge the NCI Cancer Center Support Grant CA016672 for the support of our small animal facility and small animal imaging facility.
Footnotes
Publisher's Disclaimer: This is a PDF file of an unedited manuscript that has been accepted for publication. As a service to our customers we are providing this early version of the manuscript. The manuscript will undergo copyediting, typesetting, and review of the resulting proof before it is published in its final citable form. Please note that during the production process errors may be discovered which could affect the content, and all legal disclaimers that apply to the journal pertain.
References
- 1.Condeelis J, Pollard JW. Macrophages: obligate partners for tumor cell migration, invasion, and metastasis. Cell. 2006;124(2):263–6. doi: 10.1016/j.cell.2006.01.007. [DOI] [PubMed] [Google Scholar]
- 2.Pollard JW. Tumour-educated macrophages promote tumour progression and metastasis. Nat Rev Cancer. 2004;4(1):71–8. doi: 10.1038/nrc1256. [DOI] [PubMed] [Google Scholar]
- 3.Gordon S. Alternative activation of macrophages. Nat Rev Immunol. 2003;3(1):23–35. doi: 10.1038/nri978. [DOI] [PubMed] [Google Scholar]
- 4.Bingle L, Brown NJ, Lewis CE. The role of tumour-associated macrophages in tumour progression: implications for new anticancer therapies. J Pathol. 2002;196(3):254–65. doi: 10.1002/path.1027. [DOI] [PubMed] [Google Scholar]
- 5.van der Bij GJ, Bogels M, Oosterling SJ, Kroon J, Schuckmann DT, de Vries HE, et al. Tumor infiltrating macrophages reduce development of peritoneal colorectal carcinoma metastases. Cancer Lett. 2008;262:77–86. doi: 10.1016/j.canlet.2007.11.040. [DOI] [PubMed] [Google Scholar]
- 6.Forssell J, Oberg A, Henriksson ML, Stenling R, Jung A, Palmqvist R. High macrophage infiltration along the tumor front correlates with improved survival in colon cancer. Clin Cancer Res. 2007;13(5):1472–9. doi: 10.1158/1078-0432.CCR-06-2073. [DOI] [PubMed] [Google Scholar]
- 7.Nagaraj S, Gupta K, Pisarev V, Kinarsky L, Sherman S, Kang L, et al. Altered recognition of antigen is a mechanism of CD8+ T cell tolerance in cancer. Nat Med. 2007;13(7):828–35. doi: 10.1038/nm1609. [DOI] [PMC free article] [PubMed] [Google Scholar]
- 8.Sica A, Schioppa T, Mantovani A, Allavena P. Tumour-associated macrophages are a distinct M2 polarised population promoting tumour progression: potential targets of anti-cancer therapy. Eur J Cancer. 2006;42(6):717–27. doi: 10.1016/j.ejca.2006.01.003. [DOI] [PubMed] [Google Scholar]
- 9.Allavena P, Signorelli M, Chieppa M, Erba E, Bianchi G, Marchesi F, et al. Anti-inflammatory properties of the novel antitumor agent yondelis (trabectedin): inhibition of macrophage differentiation and cytokine production. Cancer Res. 2005;65(7):2964–71. doi: 10.1158/0008-5472.CAN-04-4037. [DOI] [PubMed] [Google Scholar]
- 10.Joseph IB, Isaacs JT. Macrophage role in the anti-prostate cancer response to one class of antiangiogenic agents. J Natl Cancer Inst. 1998;90(21):1648–53. doi: 10.1093/jnci/90.21.1648. [DOI] [PubMed] [Google Scholar]
- 11.Leimgruber A, Berger C, Cortez-Retamozo V, Etzrodt M, Newton AP, Waterman P, et al. Behavior of endogenous tumor-associated macrophages assessed in vivo using a functionalized nanoparticle. Neoplasia. 2009;11(5):459–68. doi: 10.1593/neo.09356. [DOI] [PMC free article] [PubMed] [Google Scholar]
- 12.Wen X, Jackson EF, Price RE, Kim EE, Wu Q, Wallace S, et al. Synthesis and characterization of poly(L-glutamic acid) gadolinium chelate: a new biodegradable MRI contrast agent. Bioconjug Chem. 2004;15(6):1408–15. doi: 10.1021/bc049910m. [DOI] [PubMed] [Google Scholar]
- 13.Melancon MP, Wang Y, Wen X, Bankson JA, Stephens LC, Jasser S, et al. Development of a macromolecular dual-modality MR-optical imaging for sentinel lymph node mapping. Invest Radiol. 2007;42(8):569–78. doi: 10.1097/RLI.0b013e31804f5a79. [DOI] [PMC free article] [PubMed] [Google Scholar]
- 14.Van Rooijen N, Sanders A. Liposome mediated depletion of macrophages: mechanism of action, preparation of liposomes and applications. J Immunol Methods. 1994;174(1–2):83–93. doi: 10.1016/0022-1759(94)90012-4. [DOI] [PubMed] [Google Scholar]
- 15.Jackson EF, Esparza-Coss E, Wen X, Ng CS, Daniel SL, Price RE, et al. Magnetic resonance imaging of therapy-induced necrosis using gadolinium-chelated polyglutamic acids. Int J Radiat Oncol Biol Phys. 2007;68(3):830–8. doi: 10.1016/j.ijrobp.2007.01.011. [DOI] [PMC free article] [PubMed] [Google Scholar]
- 16.Landstrom M, Funa K. Apoptosis in rat prostatic adenocarcinoma is associated with rapid infiltration of cytotoxic T-cells and activated macrophages. Int J Cancer. 1997;71(3):451–5. doi: 10.1002/(sici)1097-0215(19970502)71:3<451::aid-ijc24>3.0.co;2-h. [DOI] [PubMed] [Google Scholar]
- 17.Li C, Yu DF, Newman RA, Cabral F, Stephens LC, Hunter N, et al. Complete regression of well-established tumors using a novel water-soluble poly(L-glutamic acid)-paclitaxel conjugate. Cancer Res. 1998;58(11):2404–9. [PubMed] [Google Scholar]
- 18.Li C, Price JE, Milas L, Hunter NR, Ke S, Yu DF, et al. Antitumor activity of poly(L-glutamic acid)-paclitaxel on syngeneic and xenografted tumors. Clin Cancer Res. 1999;5(4):891–7. [PubMed] [Google Scholar]
- 19.Li C, Ke S, Wu Q-P, Tansey W, Hunter N, Buchmiller LM, et al. Potentiation of ovarian OCa-1 tumor radioresponse by poly (L-glutamic acid)-paclitaxel conjugate. Int J Radiat Oncol Biol Phys. 2000;48(4):1119–26. doi: 10.1016/s0360-3016(00)00757-4. [DOI] [PubMed] [Google Scholar]