Abstract
Quick cytosolic calcium clearance is essential for the effective modulation of various cellular functions. An excess of cytosolic calcium after influx is largely removed via ATP-dependent mechanisms located in the plasma membrane and the endoplasmic reticulum. Therefore, calcium clearance depends critically on the adequate supply of ATP, which may come from either glycolysis or mitochondria, or both. However, it presently remains unknown the degree to which individual ATP generating pathways - glycolysis and mitochondria power ATP-dependent calcium as well as other vital ion clearance mechanisms in neurons. In this study, we explored the relationship between the energy generating pathways and ion clearance mechanisms in neurons by characterizing the effects of glycolytic and mitochondrial inhibitors of ATP synthesis on calcium clearance kinetics in the soma, dendrites and spines. Stimulation of cultured cerebellar granule cells by brief pulses of 60 mM potassium ACSF, and electrical stimulation of purkinje cells in acutely prepared slices led to a transient calcium influx, whose clearance was largely mediated by the plasma membrane Ca2+-ATPase pump. Inhibition of glycolysis by deoxyglucose or iodoacetic acid resulted in a marked slowing in calcium clearance in the soma, dendrites, and spines with the spines affected the most. However, inhibition of the mitochondrial citric acid cycle with fluoroacetate and arsenite, or mitochondrial ATP-synthase with oligomycin did not produce any immediate effects on calcium clearance kinetics in any of those neuronal regions. Although cytosolic calcium clearance was not affected by the inhibition of mitochondria, the magnitude of the calcium clearance delay induced by glycolytic inhibitors in different neuronal compartments was related to their mitochondrial density. Conversely, the endoplasmic reticulum Ca2+-ATPase pump activity is fuelled by both glycolytic and mitochondrial ATP, as evidenced by a minimal change in the endoplasmic reticulum calcium contents in cells treated with either deoxyglucose supplemented with lactate or arsenite. Taken together, these data suggest that calcium clearance in cerebellar granule and purkinje cells relies on the plasma membrane Ca2+-ATPase, and is powered by glycolysis.
1. Introduction
Evoked ion fluxes across the plasma membrane allow rapid intracellular communications in neurons, which is the basis for the transformation of information. An ion influx into the cell is governed by the electrochemical gradient, whereas efflux or ion clearance from the cell requires energy in the form of ATP [1]. In fact, nearly 70 % of all neuronal ATP is consumed to reverse ion fluxes [2, 3]. Although calcium clearance accounts for the consumption of only ~ 15 % of neuronal ATP [4], it is critical due to the extreme toxicity of calcium ions [5].
Cytosolic calcium ([Ca2+]i) clearance in neurons is mediated by distinct mechanisms located in different parts of the cells. Na+/Ca2+ exchanger (NCX), one of the major cellular [Ca2+]i clearance mechanisms is located in the plasma membrane. Its low calcium affinity and high capacity make NCX suitable for a quick clearance of large amounts of calcium without the need of ATP hydrolysis [6]. Thus, NCX may act as a protective mechanism against calcium overflow [7]. Although it has been shown that glutamate excitotoxicity causes an increase in the intracellular sodium level, which reverses NCX and causes calcium overload [5, 8]. Nevertheless, the bulk of [Ca2+]i is cleared by the Ca2+ ATP-dependent pumps found in both the plasma membrane (PMCA) and the endoplasmic reticulum (SERCA) [9]. A typical calcium influx results in a rather small elevation in [Ca2+]i, rarely exceeding 1 μM [10,11] (excluding cellular microdomains), which is more effectively cleared by the high-affinity calcium pumps such as PMCA and SERCA. Accordingly, an efficient removal of [Ca2+]i requires an adequate input of ATP to power those pumps. However, the amounts of ATP available to the pumps, and its sources may differ due to the inhomogeneous distribution of the energy generating mechanisms (mitochondria and glycolytic enzymes) throughout the cell. We therefore wished to determine the specific energy mechanisms neurons use to ensure an uninterrupted supply of ATP.
In the present study, we show in cultured cerebellar granule cells and purkinje cells in acute slices that glycolysis is crucial for the fast clearance of [Ca2+]i Glycolytic inhibition leads to a delay in [Ca2+]i clearance, primarily through the disruption of PMCA activity. The delay was more pronounced in the spines, followed by the dendrites and the soma, which directly correlates with a normal mitochondrial distribution in neurons. Furthermore, we show that SERCA, while not a major [Ca2+]i clearance mechanism, is capable of utilizing both glycolysis and mitochondria to fuel its activity.
2. Methods
2.1. Chemicals
2-deoxy-D-glucose, caffeine, sodium meta-arsenite, iodoacetic acid, sodium fluoroacetate, poly-D-lysine, lanthanum (III) chloride, lactic acid, and sucrose were purchased from Sigma-Aldrich (St. Louis, MO). Oligomycin, bongkrekic acid (BA) and cyclopiazonic acid (CPA) are from Fisher Scientific (Pittsburg, PA). Thapsigargin, fluo-3AM, and fura-2 (potassium salt) were obtained from Invitrogen (Carlsbad, CA).
2.2. Cell culture
Mice used for all experiments were purchased from TACONIC, and were housed and cared for in accordance with the National Institutes of Health Guide for the Care and Use of Laboratory Animals.
Postnatal C57BL/6 mice (P2-P12) were anesthetized and decapitated. After the removal of the skull, the brain was isolated and immediately placed into the ice-cold Hank’s balanced salt solution (Sigma-Aldrich). The cerebellum was excised and transferred into a 1.5 ml eppendorf tube with 500 μl of ice-cold 0.25 % Trypsin-EDTA solution (Gibco) and diced with small surgical scissors. The tube was then incubated at 37°C for 30 min. The tissue suspension was spun down in the pre-cooled to 4 °C centrifuge at 300 g for 5 min. The supernatant was discarded and the pellet re-suspended in 500 μl of digestion quenching solution comprising of 8 mg/ml soybean trypsin inhibitor (Sigma-Aldrich), 8 mg/ml bovine serum albumin (ICN) and 250 U/ml DNase (Sigma-Aldrich) in Dulbecco’s PBS (Gibco). The tissue was then gently dissociated by several strokes with a fire-polished glass pipette. The resulting cell suspension was centrifuged at 300 g for 5 min, and the formed pellet was re-suspended in 1 ml of the pre-warmed to 37°C Neurobasal medium (Invitrogen) supplemented with 1 mM sodium pyruvate (Sigma-Aldrich), 2 mM glutamine (Sigma-Aldrich), 1x B27 supplement (Gibco) and penicillin/streptomycin (Gibco). A small drop of the cell suspension was placed in the center of each poly-D-lysine covered glass coverslip (Fisher Scientific). The cells were allowed to settle for 30 min, after which the volume in each well was brought to 500 μl with Neurobasal medium. The medium was replaced with fresh medium the next day, after which one-half of the culture medium was replaced every 3 days. Cultures were maintained at 37°C in a 95% air, 5 % CO2 humidified incubator. Cultured cells were fit for experiments 3–5 days after their preparation.
2.3. Slice preparation
Cerebellar slices were prepared as previously described [31]. Briefly, 14- to 30-day-old rats were anaesthetized with pentobarbital (50 mg/kg−1) and decapitated. A rapid craniotomy allowed the cerebellum to be quickly detached, removed and chilled (0–4°C) in 95% O2–5% CO2 saturated artificial cerebrospinal fluid (ACSF) containing (mM): NaCl 125; KCl 2.5; CaCl2 2; MgCl2 2; NaHCO3 25; glucose 10.Next, the cerebellum was glued to the stage of a vibratome, and transversal slices (200 μm thick) were cut in cold oxygenated ACSF. After a recovery period of ~ 1 h in RT ACSF, slices were placed in a microscope chamber, held in position by a nylon mesh glued to a U-shaped platinum wire and continuously superfused with oxygenated ACSF at room temperature at all time during the experiment.
2.4. Optical measurements, Experimental Conditions and Data Processing
Two-photon images were acquired using a custom-built two-photon laser scanning microscope. Briefly, the microscope is based on the Olympus AX70 microscope frame coupled to the laser system composed of Millena X diode pump and Tsunami® mode-locked Ti:Sapphire laser. The system generates laser pulses with a frequency of 80 MHz and duration of 70 fs. The scanning unit (model 6215H) was controlled by a custom-written algorithm based on LabVIEW interface (National Instruments). Average pixel dwell time was 2 μs. The emission signal was detected with a photomultiplier tube H7732 MOD2 (Hamamatsu Photonics). Laser power output was tuned to 3 mW at the nosepiece of the objective lens. A 60x Olympus water immersion objective (0.90 NA) was used for all experiments.
Cells grown on glass coverslips were placed in a custom-designed perfusion chamber. The chamber design allowed for a quick solution exchange, and minimal perfusion volume of less than 500 μl. The bathing solution (Tyrode solution, mM: CaCl2 1.8, MgSO4 0.8, KCl 5.4, NaCl 116.2, NaH2PO4 1, glucose 5, NaHCO3 26.2) was pre-warmed to 37ºC in a diode-based heating element, and perfused at a rate of 3.5 ml/min. Drug application was achieved by switching between different solutions with a complete solution exchange time of around 30 s.
Cytosolic calcium was measured with the use of the acetoxy-methyl ester form of fluo-3 (AM), a visible fluorescent calcium indicator with Kd ~ 400 nM. Cells were stained with 1 μM fluo-3 for 25 min at 37°C, which was followed by 30 min incubation in dye-free medium. Some cytosolic calcium experiments were also performed with the use of 1 μM calcium green-1, the loading protocol used was identical to fluo-3. Both dyes were excited at 780 nm.
In case of purkinje cells, cells were injected with the Ca2+ indicator dye fura-2 potassium salt (Kd ~ 224 nM), and imaged through the two-photon microscope during short exposures to 740 nm laser light. Purkinje cell activity was elicited by an electrical stimulation of climbing fiber collaterals. Images of dye fluorescence were obtained in either line or frame scan modes at a maximum frequency of ~ 0.2 ms/line.
Images were saved as 12-bit raw data, and later converted into 8-bit TIFF format for offline processing. ImageJ (available from NIH Public Domain), and LabVIEW custom-written programs were used for image processing and analysis. Images were combined into a stack, and background subtracted, filtered with the median filter, and then used for intensity measurements of regions of interest (ROI). ROIs were selected as follows: for calcium clearance measurements in cerebellar granules cells, fluorescence was collected from a single field of view covering ~ 4–10 cells, for the measurements of ER calcium release, fluorescence from the soma of individual cells was used. Increases in intracellular free Ca2+ were expressed as the ratio of fluorescence intensity of Fluo-3 AM to baseline fluorescence intensity (F/F0).
Statistical analysis was performed on all data sets in Microsoft Excel and an online post-hoc calculator at http://www.graphpad.com/quickcalcs/posttest1.cfm. Data are presented as the mean and standard error of the mean and statistical significance was determined either by a paired Student’s t test or by ANOVA one-way analysis of variance with Bonferroni’s multiple comparison tests for post-hoc analysis of selected groups, as specified in each case, depending upon the number of groups to be compared.
3. Results
Measurements of [Ca2+]i clearance kinetics in young cultured cerebellar granule cells, and purkinje cells in acute slices were used to characterize ATP generating pathways that power [Ca2+]i clearance mechanisms in the neuronal soma, dendrites, and spines. Calcium influx was induced by either electrical stimulation (purkinje cells) or application of high potassium ACSF (granule cells).
Young cultures of cerebellar granule cells were employed to study [Ca2+]i clearance mechanisms in the neuronal soma. The use of young cultures (3–5 days after isolation) is essential, since mature cultured neurons exhibit significant and permanent adaptations in their energy metabolism [12]. Cerebellar granule cells loaded with fluo-3 were stimulated by brief pulses (≤ 10 s) of 60 mM K+ ACSF. Repetitive stimulation of the same preparations yielded reproducible monophasic [Ca2+]i clearance responses, see Fig. 1, which was critical for the comparison of controls and the inhibitory responses. Moreover, monophasic calcium clearance response is characteristic of a small calcium influx (< 0.5 μM) cleared by a single mechanism, most likely calcium ATP-dependent pumps [13]. That, in turn, allows to directly relate ATP availability to the activity of calcium pumps, and thus, [Ca2+]i clearance.
Figure 1. Calcium transients in cultured cerebellar granule cells.
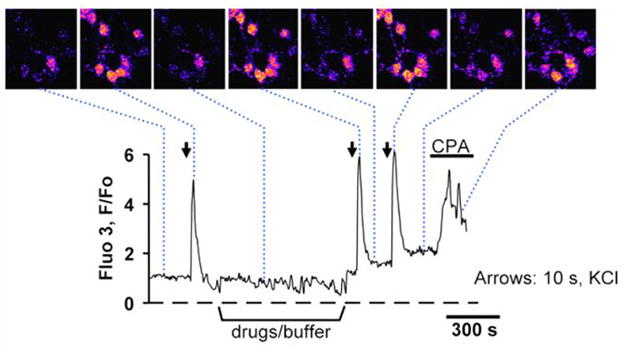
Fluorescent images of cultured cerebellar granule cells (the top row) loaded with 1 μM fluo-3AM and stimulated by brief pulses of 60 mM K+ ACSF (arrows) solution produced reproducible calcium responses. Addition of 50 μM CPA (horizontal bar) led to the release of ER calcium as evidenced by a transient increase in [Ca2+]i.
Contributions of cellular ATP generating pathways to the ATP pool that powers [Ca2+]i clearance mechanisms were assessed by a selective inhibition of ATP production in glycolysis and mitochondria. Iodoacetic acid (IAA), an inhibitor of glyceraldehyde 3-phosphate dehydrogenase, and deoxyglucose (DOG), a blocker of hexokinase were used to inhibit glycolysis. Sodium fluoroacetate (FAc), an inhibitor of aconitase, sodium arsenite (Arsn), an inhibitor of pyruvate dehydrogenase, and oligomycin and bongkrekic acid, the drugs that directly interfere with mitochondrial ATP synthesis were utilized to inhibit mitochondria. Although both IAA and FAc are often used to inhibit metabolism in glia due to their high rate of acetate uptake relative to neurons, metabolism in cultured neurons is also effectively inhibited by higher concentrations (> 100 μM) of these drugs [14].
Selective inhibition of glycolysis with 1 mM IAA or 10 mM DOG resulted in a significant prolongation of [Ca2+]i clearance, Fig. 2A. Both IAA and DOG nearly doubled τ1/2 (the time to ½ decay in [Ca2+]i ), resulting in a 66 ± 25 % increase in τ1/2 over control with IAA (t-test, p<0.05, n = 8 (fields of view)), and 65 ± 15 % increase in τ1/2 with DOG (t-test, p<0.05, n = 8 (fields of view)), respectively, see Fig. 3. However, inhibition of the citric acid cycle with 1 mM FAc or 1 mM Arsn produced no statistically significant effects on [Ca2+]i kinetics, 18 ± 15 % and 14 ± 12 % increase in τ1/2, respectively (t-test, p<0.05, n = 8 (fields of view)) Fig. 2B and Fig. 3. Likewise, addition of either 5 μg/ml oligomycin or 5 μM bongkrekic acid to directly inhibit mitochondrial ATP synthesis had no effects on [Ca2+]i clearance, see Fig. 2B. Additionally, we also used DOG supplemented with lactate, a mitochondrial substrate, to mitigate the effects of mitochondrial co-inhibition typically seen with glycolytic inhibitors [15]. However, addition of 5 mM lactate to DOG failed to improve [Ca2+]i clearance kinetics, resulting in a 73 ± 17 % increase in τ1/2 (t-test, p<0.05, n = 5 (fields of view)). All of these findings suggest that calcium clearance relies on glycolysis rather than mitochondria for its ATP needs, as evidenced by a significant difference (p<.01, one-way ANOVA with Bonferroni correction) in the effects of glycolytic and mitochondrial inhibitors on [Ca2+]i clearance kinetics, Fig. 3.
Figure 2. Inhibition of glycolysis slows down cytosolic calcium clearance in the soma of cultured cerebellar granule cells.
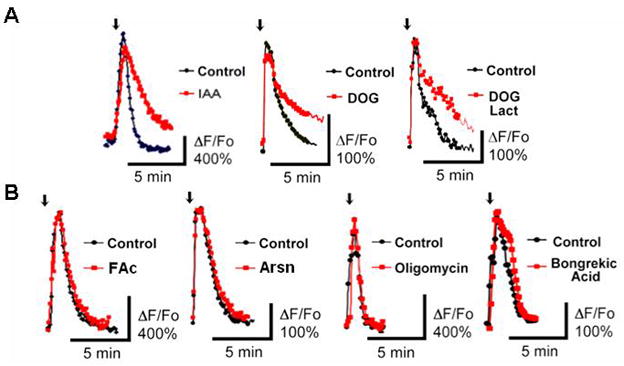
A) Pretreatment of cultured cerebellar granule cells with glycolytic inhibitors - 1 mM IAA, 10 mM DOG, or 10 mM DOG with 5 mM lactate for 5 min delayed clearance of KCl-evoked [Ca2+]i transients as shown by red traces. B) Arsn or abolition of mitochondrial ATP production with 5 μg/ml oligomycin and 5 μM bongrekic acid (shown in red) did not have an immediate influence on [Ca2+]i clearance. Arrows in A and B: 10 s, 60 mM K+ ACSF.
Figure 3. Inhibition of glycolysis but not mitochondria prolongs calcium clearance.
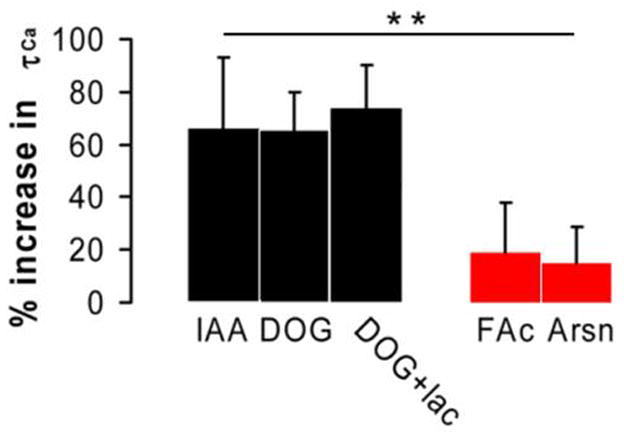
Statistical analysis of mitochondrial and glycolytic inhibitors effects on [Ca2+]i clearance in cultured cerebellar granule neurons. Plotted are the mean values of the half-clearance times for various metabolic inhibitors with their corresponding confidence intervals derived from t-test with p<0.05 (n=8 for all except DOG+lac, n=5 (fields of view)). ANOVA single factor analysis with Bonferroni correction was used to cross compare individual means of glycolytic and mitochondrial inhibitors (** P<0.01).
We next estimated the relative contributions of PMCA, SERCA, and NCX to the overall [Ca2+]i clearance kinetics in cerebellar granule cells. First, we explored the role of NCX in clearing of [Ca2+]i. NCX contribution to [Ca2+]i clearance was assessed by isosmotic replacement of Na+ with sucrose in the perfusion media immediately after stimulation with 60 mM K+ ACSF. Inhibition of NCX with sucrose did not significantly prolong [Ca2+]i clearance, causing only a 7.9 ± 7.5 % increase in τ1/2 (t-test, p<0.05, n = 7 (coverslips)), see Fig. 4. This result confirmed our earlier assumption that the stimulation used results in a calcium influx cleared by a single mechanism other than NCX. Similarly to NCX, SERCA contribution to [Ca2+]i clearance was also insignificant. Pretreatment of cerebellar granule cells with 50 μM cyclopiazonic acid (CPA), a specific inhibitor of SERCA, for ~ 5–10 min led to a transient increase in [Ca2+]i level, which returned to the baseline following 3 min. Further stimulation of the cells with high saline did not reveal any significant changes in [Ca2+]i clearance kinetics over control, a 5.0 ± 4.5 % increase in τ1/2 (t-test, p<0.05, n = 7 (coverslips)), Fig. 4. In contrast, inhibition of PMCA with 300 μM La3+, a concentration that does not interfere with voltage-dependent calcium channels [16], resulted in a considerable slowdown in [Ca2+]i clearance kinetics, producing a 64 ± 21 % increase in τ1/2 (t-test, p<0.05, n = 7 (coverslips)). The magnitude of the increase in τ1/2 induced by La3+ was comparable to that seen with DOG and DOG with lactate. Additionally, application of 300 μM La3+ with 10 mM DOG failed to produce any synergic effect and increased τ1/2 by 75 ± 21 % (t-test, p<0.05, n = 7 (coverslips)), Fig. 4. Thus, it suggests that both DOG and La3+ act on the same target. These results with the abovementioned findings provide a clear evidence implicating PMCA as a major [Ca2+]i clearance mechanism, and glycolysis as its source of ATP in granule cells.
Figure 4. Plasma membrane Ca2+ ATP-dependent pump is powered by glycolysis.
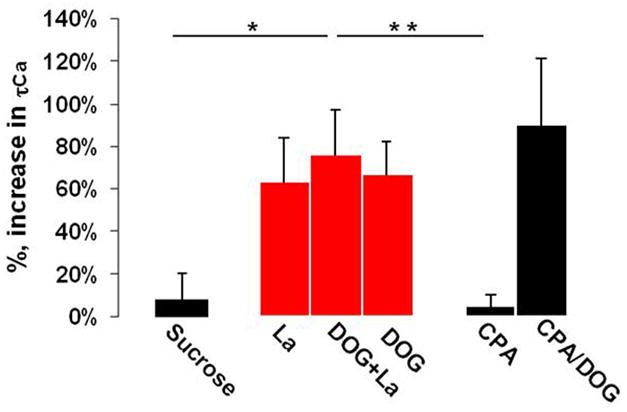
Shown are the mean values of the percentage increase in calcium τ1/2 over control for each treatment and their corresponding confidence intervals derived from t-test with p<0.05, and n=7 (fields of view). Cultured cerebellar granule cells were treated with the specific inhibitors of calcium clearance mechanisms: 224 mM sucrose ACSF to inhibit NCX, 300 μM La3+ used for PMCA, 50 μM CPA for SERCA. Disruption of the plasma membrane Ca2+ pump activity in cerebellar granule cells resulted in the largest delay in [Ca2+]i clearance, and it was similar to the delay seen with 10 mM DOG. ANOVA single factor analysis with Bonferroni correction was used to cross compare individual means for each inhibitor (* P<0.05, ** P<0.01).
Despite SERCA minor contribution to the clearance of [Ca2+]i, the ATP pathways powering its activity are of great interest. The cytosolic location of SERCA might necessitate utilization of different ATP sources than the ones used by PMCA. Thus, we explored the contributions of glycolysis and mitochondria to the ATP pool that powers SERCA. The degree of SERCA activity could be assessed by quantifying changes in the amount of calcium stored in the ER (endoplasmic reticulum) before and after inhibition, since SERCA represents the primary mechanism responsible for the ER calcium uptake [17]. ER calcium release was induced by the addition of 50 μM CPA, leading to the elevation in [Ca2+]i, Fig. 5A. The area under the peak was used as a measure of the ER calcium contents with the control (no drugs) taken as 100%. Inhibition of glycolysis with 10 mM DOG resulted in a 48 ± 11 % reduction in the ER calcium contents (t-test, p<0.05, n = 6 (cells)), see Fig. 5B. However, supplementation of DOG with 5 mM lactate to prevent mitochondrial co-inhibition resulted in almost complete recovery of the ER calcium load, 91 ± 28 % of control (t-test, p<0.05, n = 6 (cells)). Thus, the disruption of glycolysis as such does not affect the activity of SERCA/ER calcium contents, as mitochondria may readily compensate for the loss of glycolytic ATP. Similarly, selective inhibition of mitochondrial ATP production with 1 mM Arsn or 5 μg/ml oligomycin (not shown) produced only a minimal effect (Fig. 5B) on the ER calcium contents 98 ± 13 % of the control ER calcium load for Arsn (t-test, p<0.05, n = 6 (cells)), which implies that glycolysis alone may also provide a sufficient amount of ATP to sustain SERCA activity. Thus, it is clear that unlike PMCA, which relies mostly on glycolysis, SERCA, due to its location in the cytosol may be powered by both glycolysis and mitochondria.
Figure 5. ER Ca2+ ATP-dependent pump derives its ATP from both glycolysis and mitochondria.
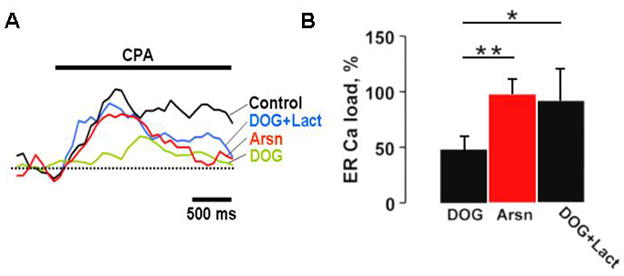
A) ER calcium load in cerebellar granule cells was assessed by measuring the area under the peak of [Ca2+]i induced by 50 μM CPA. Pretreatment with 10 mM DOG for 5 min led to a substantial reduction in ER calcium which was reversed by the addition of 5 mM lactate. Inhibition of mitochondrial citric acid cycle with 1 mM Arsn produced a negligible effect. B) Statistical analysis of the effects of metabolic inhibitors on ER calcium contents. Shown are the mean area values for each treatment expressed as a percentage of control (no drugs) and their corresponding confidence intervals derived from t-test with p<0.05, and n=6 (cells). ANOVA single factor analysis with Bonferroni correction was used to cross compare individual means for each inhibitor (* P<0.05, ** P<0.01).
In addition to characterizing [Ca2+]i clearance in the soma, we also explored the interactions between calcium clearance and energy pathways in the dendrites and the dendritic spines. It is well-known that the distribution of mitochondria throughout the neuron is not uniform and depends on neuronal morphology as well as neuronal activity [18]. Thus, the amount of ATP contributed by mitochondria in the different parts of the neuron would vary with the number of mitochondria. We looked at [Ca2+]i clearance in the dendrites and the spines, the two neuronal compartments that differ in their metabolic pathways. [Ca2+]i clearance in the dendrites and the spines was studied in purkinje cells in acutely prepared cerebellar slice by utilizing two-photon line-scan microscopy of fura 2. Electrical stimulation of the climbing fiber afferents typically triggers a near simultaneous activation and calcium influx response in both the dendrites and the spines. However, in our experiments the onset of calcium influx in the dendrites was delayed when compared to the spines by 31.0 ± 6.5 ms (t-test, p<0.05, n = 8 (cells)) Fig. 6. This could be attributed to the difference in the density of calcium channels between these two compartments. It is has been shown previously that the spines typically express a higher number of voltage sensitive Ca2+ channels per unit of surface than the dendrites [19].
Figure 6. Imaging of dendritic and spine calcium kinetics.
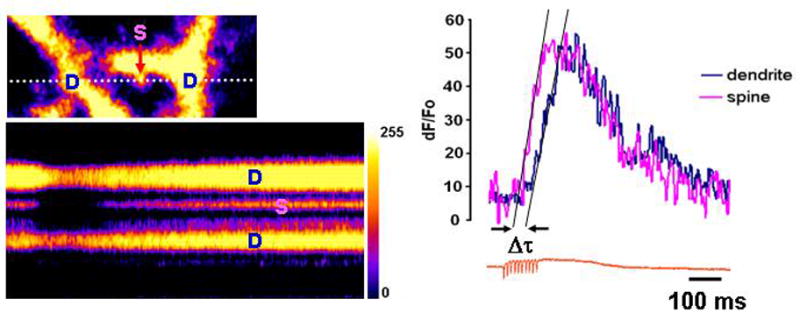
Shown on the right is the image of a portion of Purkinje cell dendritic tree, with the white dotted line indicating the line scan location and crossing 2 dendrites (D) and the spine (S). The results of the line scan with pulse-train stimulation are presented below. The dendritic and spine calcium responses are plotted in the graph and show that the onset of calcium influx in the spine precedes that one in the dendrite by ~ 30 ms.
Similar to the experiments on cultured granule cells, we tested the effects of glycolytic and mitochondrial inhibitors on [Ca2+]i clearance in the dendrites and their spines in purkinje cells. The application of 10 mM DOG supplemented with 5 mM lactate slowed [Ca2+]i clearance in both compartments, a 163 ± 27 % increase in τ1/2 in the spines versus 114 ± 14 % in the dendrites (t-test, p<0.05, n = 5 (cells for both)) Fig. 7A, C. The delay observed in the spines was longer than in the dendrites. The lack of mitochondria from the spines makes them highly dependent on glycolysis for their ATP needs. Therefore, disruption of glycolysis results in a more severe decline in ATP, leading to a stronger inhibition of the activity of calcium pumps in the spines than in the dendrites. Conversely, inhibition of mitochondrial ATP synthesis with 5 μg/ml oligomycin similarly to cerebellar granule cells produced no immediate changes in [Ca2+]i clearance kinetics (2.0 ± 6.7 % for the spines versus 9.1 ± 8.4 % for the dendrites t-test, p<0.05, n = 5 (cells for both)) Fig. 7B, C. These results not only show that [Ca2+]i clearance in the spines and the dendrites like in the soma depends on glycolysis, but also that the degree of [Ca2+]i clearance dependence on glycolysis varies in different neuronal compartments with the number of mitochondria.
Figure 7. Glycolysis is essential for calcium clearance in both the dendrites and the spines.
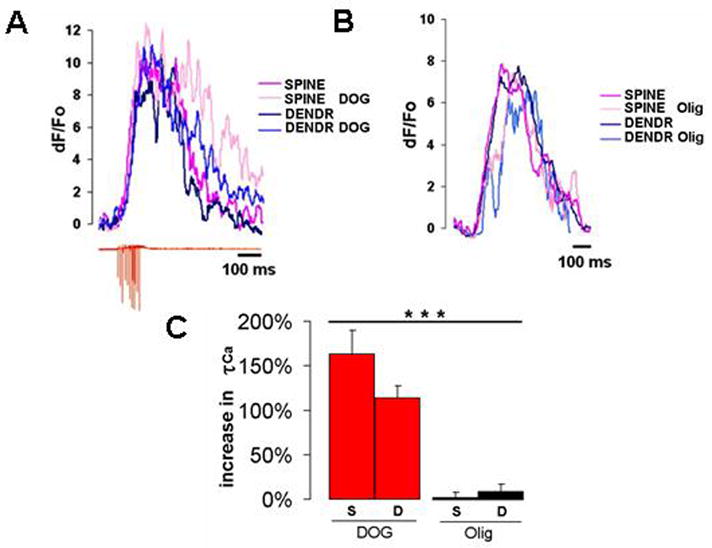
A) Amplitude-adjusted calcium responses in the dendrite and the spine before and after treatment with 10 mM DOG with 5 mM lactate. Inhibition of glycolysis slows calcium clearance in both compartments, with the spine exhibiting the strongest effect. B) Disruption of mitochondrial ATP synthase with 5 μg/ml oligomycin does not alter calcium response in either the dendrites or the spine. C) Statistical analysis of the effects of glycolytic and mitochondrial inhibitors on calcium kinetics in the dendrites and the spines. the mean values of the percentage increase in calcium τ1/2 over control for each treatment and their corresponding confidence intervals derived from t-test with p<0.05, and n=5 (cells). ANOVA single factor analysis with Bonferroni correction was used to cross compare individual means for every inhibitor (*** P<0.001).
4. Discussion
The effectiveness and specificity of a signal transduction system depends on such factors as a rapid onset and termination of the signaling cascade [20]. In the case of calcium signaling, the effectiveness of signal transduction is achieved through a rapid calcium influx via voltage–dependent calcium channels followed by its swift removal by calcium pumps. Unlike calcium influx, calcium clearance requires ATP, which may originate from either glycolysis or mitochondria. Glycolysis and mitochondria differ substantially in their ATP output capacity, the rate of ATP production, and initial metabolic substrates as well as their availability in the brain/cell [21, 22]. All of these factors have an effect on the amount of ATP produced and available to the calcium clearance mechanisms.
The results of this study give new insight into the energy requirements of calcium clearance in neurons, and also, the broader mechanism of coupling energy production to neuronal activity. We show that [Ca2+]i clearance in neurons is mostly mediated by the plasma membrane Ca2+-ATPase and powered by glycolysis. Consequently, inhibition of glycolysis results in a significant slowdown in the calcium clearance rate. Furthermore, the rate of the slowdown is more pronounced in the spines and dendrites, than the soma, which is in agreement with the fact that the density of mitochondria in the dendrites is typically lower than in the soma.
Neuronal plasma membrane is rich in ATP-dependent ion pumps that maintain ionic gradients across the plasma membrane, the process, which comes at a huge cost. It has been estimated that ion pumps consume over 70 % of all neuronal ATP [1, 2, 3]. Neuronal activation accompanied by an rise in [Ca2+]i leads to a transient increase in ATP demand, which is satisfied by glycolysis. Although glycolysis is not as efficient as mitochondria, it generates ATP much faster in fewer steps [21]. Thus, “fast” glycolysis is suited better than efficient but “slow” mitochondria in meeting transient increases in ATP demand. In addition, it has been found that glycolytic enzymes tend to cluster near the plasma membrane, giving rise to the so-called glycolytic complexes [23, 24]. Immunocytochemical staining for GADPH in hippocampal neurons results in an extensive labelling of the plasma membrane, which suggests that such glycolytic complexes may also be present in neurons. That, in turn, puts glycolytic enzymes in the proximity of both the glucose transport systems (glucose transporters) and the ion pumps, resulting in a coupling of glucose uptake and ATP utilization. Taken together, the results of the previous and present studies suggest that ATP-dependent mechanisms in the plasma membrane such as Na+/K+-ATPase, Ca2+-ATPases, and numerous kinases rely on glycolysis for their ATP needs.
Extensive morphology and distinct energy demands throughout the neuron lead to a non-uniform distribution of mitochondria [18], which has an influence on the amounts of ATP derived from either glycolysis or mitochondria. Our results in cerebellar granule and purkinje cells show that calcium clearance in the spines is the most sensitive to glycolytic inhibition, followed by the dendrites and the soma. This pattern is explained by the morphological distinctions and mitochondrial population differences between those compartments. Specifically, the spine morphology (narrow neck and small head volume) is not accommodative of mitochondria [26]. In fact, most of the spines are devoid of mitochondria, making them highly dependent on glycolysis as their source of ATP [27, 28]. In contrast, both the soma and dendrites have mitochondria. However, the soma of neurons and proximal dendrites tend to have a higher number of mitochondria necessitated by the on-going biosynthetic activity than either remote dendrites or the axon [29, 30]. In line with that we show in this study that cytosolic ATP-dependent processes in the soma such as SERCA have no dependence on any single ATP source, and instead have the flexibility of utilizing ATP from both glycolysis and mitochondria.
5. Conclusions
In summary, our results provide a better understanding of the mechanisms involved in coupling of neuronal calcium signaling and energy production. We show that PMCA, the pump responsible for the clearance of the most of [Ca2+]i, derives its energy from glycolysis rather than mitochondria. On the other hand, SERCA, due to its cytosolic location is fuelled by both mitochondrial and glycolytic ATP. Furthermore PMCA dependence on glycolysis varies in different parts of the neuron, with the highest dependency in the spines and lowest in the soma.
Acknowledgments
This work was supported by funding from the National Institutes of Health, NIH Grant NS13742-30.
Footnotes
Publisher's Disclaimer: This is a PDF file of an unedited manuscript that has been accepted for publication. As a service to our customers we are providing this early version of the manuscript. The manuscript will undergo copyediting, typesetting, and review of the resulting proof before it is published in its final citable form. Please note that during the production process errors may be discovered which could affect the content, and all legal disclaimers that apply to the journal pertain.
Contributor Information
Maxim V. Ivannikov, Email: mvi205@nyu.edu.
Mutsuyuki Sugimori, Email: Mutsuyuki.Sugimori@nyumc.org.
Rodolfo R. Llinás, Email: Rodolfo.Llinas@nyumc.org.
References
- 1.Erecinska M, Dagani F. Relationships between the neuronal sodium/potassium pump and energy metabolism. Effects of K+, Na+, and adenosine triphosphate in isolated brain synaptosomes. J Gen Physiol. 1990;95:591–616. doi: 10.1085/jgp.95.4.591. [DOI] [PMC free article] [PubMed] [Google Scholar]
- 2.Matsumura F, Clark JM. ATP-utilizing systems in the squid axons: a review on the biochemical aspects of ion-transport. Prog Neurobiol. 1982;18:231–55. doi: 10.1016/0301-0082(82)90011-9. [DOI] [PubMed] [Google Scholar]
- 3.Atwell D, Laughlin SB. An energy budget for signaling in the grey matter of the brain. J Cereb Blood Flow Metab. 2001;21:1133–1145. doi: 10.1097/00004647-200110000-00001. [DOI] [PubMed] [Google Scholar]
- 4.Lenny P. The cost of cortical computation. Curr Biol. 2003;13:493–7. doi: 10.1016/s0960-9822(03)00135-0. [DOI] [PubMed] [Google Scholar]
- 5.Bano D, Young KW, Guerin CJ, Lefeuvre R, Rothwell NJ, Naldini L, Rizzuto R, Carafoli E, Nicotera P. Cleavage of the plasma membrane Na+/Ca2+ exchanger in excitotoxicity. Cell. 2005;120:275–285. doi: 10.1016/j.cell.2004.11.049. [DOI] [PubMed] [Google Scholar]
- 6.Carafoli E. Biogenesis, plasma membrane calcium ATPase: 15 years of work on the purified enzyme. FASEB J. 1994;8:993–1002. [PubMed] [Google Scholar]
- 7.Tortiglione A, Pignataro G, Minale M, Secondo A, Scorziello A, Di Renzo GF, Amoroso S, Caliendo G, Santagada V, Annunziato L. Na+/Ca2+ exchanger in Na+ efflux-Ca2+ influx mode of operation exerts a neuroprotective role in cellular models of in vitro anoxia and in vivo cerebral ischemia. Ann NY Acad Sci. 2002;976:408–412. doi: 10.1111/j.1749-6632.2002.tb04768.x. [DOI] [PubMed] [Google Scholar]
- 8.Andreeva N, Khodorov B, Stelmashoo E, Cragoe E, Victorov I. Inhibition of Na+/Ca2+ exchange enhances delayed neuronal death elicited by glutamate in cerebellar granule cell cultures. Brain Res. 1991;548:322–325. doi: 10.1016/0006-8993(91)91141-m. [DOI] [PubMed] [Google Scholar]
- 9.Thayer SA, Usachev YM, Pottorf WJ. Modulating Ca2+ clearance from neurons. Front Biosci. 2002;7:1255–1279. doi: 10.2741/A838. [DOI] [PubMed] [Google Scholar]
- 10.Stuenkel EL. Regulation of intracellular calcium and calcium buffering properties of rat isolated neurohypophysial nerve endings. J Physiol. 1994;481:251–71. doi: 10.1113/jphysiol.1994.sp020436. [DOI] [PMC free article] [PubMed] [Google Scholar]
- 11.Höger U, Meisner S, Torkkeli PH, French AS. Regional distribution of calcium elevation during sensory transduction in spider mechanoreceptor neurons. Neurosci Res. 2008;62:278–85. doi: 10.1016/j.neures.2008.09.006. [DOI] [PubMed] [Google Scholar]
- 12.Malthankar-Phatak GH, Patel AB, Xia Y, Hong S, Chowdhury GM, Behar KL, Orina IA, Lai JC. Effects of continuous hypoxia on energy metabolism in cultured cerebro-cortical neurons. Brain Res. 2008;1229:147–54. doi: 10.1016/j.brainres.2008.06.074. [DOI] [PMC free article] [PubMed] [Google Scholar]
- 13.Sasaki N, Dayanithi G, Shibuya I. Ca2+ clearance mechanisms in neurohypophysial terminals of the rat. Cell Calcium. 2005;37:45–56. doi: 10.1016/j.ceca.2004.06.007. [DOI] [PubMed] [Google Scholar]
- 14.Hassel B, Westergaard N, Schousboe A, Fonnum F. Metabolic differences between primary cultures of astrocytes and neurons from cerebellum and cerebral cortex. Effects of fluorocitrate. Neurochem Res. 1995;20:413–20. doi: 10.1007/BF00973096. [DOI] [PubMed] [Google Scholar]
- 15.Shryock JC, Rubio R, Berne RM. Release of adenosine from pig aortic endothelial cells during hypoxia and metabolic inhibition. Am J Physiol. 1988;254:H223–9. doi: 10.1152/ajpheart.1988.254.2.H223. [DOI] [PubMed] [Google Scholar]
- 16.Shimizu H, Borin ML, Blaustein MP. Use of La3+ to distinguish activity of the plasmalemmal Ca2+ pump from Na+/Ca2+ exchange in arterial myocytes. Cell Calcium. 1997;21:31–41. doi: 10.1016/s0143-4160(97)90094-4. [DOI] [PubMed] [Google Scholar]
- 17.Green KN, LaFerla FM. Linking calcium to Abeta and Alzheimer’s disease. Neuron. 2008;59:190–4. doi: 10.1016/j.neuron.2008.07.013. [DOI] [PubMed] [Google Scholar]
- 18.Mironov SL. Spontaneous and evoked neuronal activities regulate movements of single neuronal mitochondria. Synapse. 2006;59:403–11. doi: 10.1002/syn.20256. [DOI] [PubMed] [Google Scholar]
- 19.Kopec CD, Real E, Kessels HW, Malinow R. GluR1 links structural and functional plasticity at excitatory synapses. J Neurosci. 2007;27:13706–18. doi: 10.1523/JNEUROSCI.3503-07.2007. [DOI] [PMC free article] [PubMed] [Google Scholar]
- 20.Scholich K, Mullenix JB, Wittpoth C, Poppleton HM, Pierre SC, Lindorfer MA, Garrison JC, Patel TB. Facilitation of signal onset and termination by adenylyl cyclase. Science. 1999;283:1328–31. doi: 10.1126/science.283.5406.1328. [DOI] [PubMed] [Google Scholar]
- 21.Pfeiffer T, Schuster S, Bonhoeffer S. Cooperation and competition in the evolution of ATP-producing pathways. Science. 2001;292:504–7. doi: 10.1126/science.1058079. [DOI] [PubMed] [Google Scholar]
- 22.Abi-Saab WM, Maggs DG, Jones T, Jacob R, Srihari V, Thompson J, Kerr D, Leone P, Krystal JH, Spencer DD, During MJ, Sherwin RS. Striking differences in glucose and lactate levels between brain extracellular fluid and plasma in conscious human subjects: effects of hyperglycemia and hypoglycemia. J Cereb Blood Flow Metab. 2002;22:271–9. doi: 10.1097/00004647-200203000-00004. [DOI] [PubMed] [Google Scholar]
- 23.Campanella ME, Chu H, Low PS. Assembly and regulation of a glycolytic enzyme complex on the human erythrocyte membrane. PNAS. 2005;102:2402–7. doi: 10.1073/pnas.0409741102. [DOI] [PMC free article] [PubMed] [Google Scholar]
- 24.Dhar-Chowdhury P, Malester B, Rajacic P, Coetzee WA. The regulation of ion channels and transporters by glycolytically derived ATP. Cell Mol Life Sci. 2007;64:3069–83. doi: 10.1007/s00018-007-7332-3. [DOI] [PMC free article] [PubMed] [Google Scholar]
- 25.Laschet JJ, Minier F, Kurcewicz I, Bureau MH, Trottier S, Jeanneteau F, Griffon N, Samyn B, Van Beeumen J, Louvel J, Sokoloff P, Pumain R. Glyceraldehyde-3-phosphate dehydrogenase is a GABAA receptor kinase linking glycolysis to neuronal inhibition. J Neurosci. 2004;24:7614–22. doi: 10.1523/JNEUROSCI.0868-04.2004. [DOI] [PMC free article] [PubMed] [Google Scholar]
- 26.Spacek J. Three-dimensional analysis of dendritic spines. II. Spine apparatus and other cytoplasmic components. Anat Embryol (Berl) 1985;171:235–43. doi: 10.1007/BF00341418. [DOI] [PubMed] [Google Scholar]
- 27.Shepherd GM, Harris KM. Three-dimensional structure and composition of CA3-->CA1 axons in rat hippocampal slices: implications for presynaptic connectivity and compartmentalization. J Neurosci. 1998;18:8300–10. doi: 10.1523/JNEUROSCI.18-20-08300.1998. [DOI] [PMC free article] [PubMed] [Google Scholar]
- 28.Wu K, Aoki C, Elste A, Rogalski-Wilk AA, Siekevitz P. The synthesis of ATP by glycolytic enzymes in the postsynaptic density and the effect of endogenously generated nitric oxide. PNAS. 1997;94:13273–8. doi: 10.1073/pnas.94.24.13273. [DOI] [PMC free article] [PubMed] [Google Scholar]
- 29.Müller M, Mironov SL, Ivannikov MV, Schmidt J, Richter DW. Mitochondrial organization and motility probed by two-photon microscopy in cultured mouse brainstem neurons. Exp Cell Res. 2005;3:114–27. doi: 10.1016/j.yexcr.2004.09.025. [DOI] [PubMed] [Google Scholar]
- 30.Li Z, Okamoto K, Hayashi Y, Sheng M. The importance of dendritic mitochondria in the morphogenesis and plasticity of spines and synapses. Cell. 2004;119:873–87. doi: 10.1016/j.cell.2004.11.003. [DOI] [PubMed] [Google Scholar]
- 31.Kimura T, Sugimori M, Llinás RR. Purkinje cell long-term depression is prevented by T-588, a neuroprotective compound that reduces cytosolic calcium release from intracellular stores. PNAS. 2005;102:17160–5. doi: 10.1073/pnas.0508190102. [DOI] [PMC free article] [PubMed] [Google Scholar]


