

Abstract
Using a T1ρ MRI based indirect detection method, we demonstrate the detection of cerebral oxidative metabolism and its modulation by administration of the mitochondrial uncoupling agent 2,4-dinitrophenol (DNP) in a large animal model with minimum utilization of  gas. The study was performed by
  inhalation in swine during imaging on clinical MRI scanners. Metabolic changes in swine were determined by two methods. First, in a series of animals, increased metabolism caused by DNP injection was measured by exhaled gas analysis. The average whole-body metabolic increase in seven swine was 11.9%+/-2.5% per mg/kg, stable over three hours. Secondly, hemispheric brain measurements of oxygen consumption stimulated by DNP injection were made in five swine using T1ρ MRI following administration of
  gas. Metabolism was calculated from the change in the T1ρ weighted MRI signal due to H217O generated from
  inhalation before and after doubling of metabolism by DNP. These results were confirmed by direct oxygen-17 MR spectroscopy, a gold standard for in vivo H217O measurement. Overall, this work underscores the ability of indirect oxygen-17 imaging to detect oxygen metabolism in an animal model with a lung capacity comparable to the human with minimal utilization of expensive
  gas. Given the demonstrated high efficiency in use of
  and the proven feasibility of performing such measurements on standard clinical MRI scanners, this work enables the adaption of this technique for human studies dealing with a broad array of metabolic derangements.
Keywords: 2,4-dinitrophenol; cerebral metabolic rate of oxygen consumption; CMRO2; oxygen-17
Derangement of oxidative metabolism is noted in numerous conditions including Alzheimer’s disease, cerebral ischemia, cancer, and aging. Despite the known derangements in oxidative metabolism that occur in many diseases, there are still no routine clinical, nonradioactive technologies that directly assess oxidative metabolism. To address this need, a number of studies have investigated techniques based on 17O, the only stable, naturally occurring, NMR-visible isotope of oxygen. These techniques utilize either proton detection of 17O through the strong 1H-17O J-coupling in water (1), termed “indirect” imaging (2–5), or “direct” spectroscopy based upon imaging of the 17O nucleus in H217O (6–10).
While the direct detection methods are highly specific to 17O, their inherent low SNR requires either long acquisition times or ultrahigh magnetic fields, which precludes their implementation in the routine clinical setting. In contrast, indirect detection methods exploit the higher sensitivity of proton MR and can be implemented on routine clinical scanners. Using both direct and indirect 17O MR detection methods, oxidative metabolism has been demonstrated in small animals such as cats, rats, and mice (4, 11–13). To date there have been only two published abstracts of direct 17O NMR studies of healthy humans (14, 15). There have been no reports of indirect detection of oxidative metabolism in humans.
We have recently demonstrated oxidative metabolism in swine, an animal model with a lung capacity comparable to that of the human. This study enabled us to verify the recirculation delay demonstrated previously by 15O PET (16) and to apply CMRO2 measurement techniques applicable to humans while using clinical MRI equipment with minimal modification (17).
Large animal experiments introduce several differences when compared with small animal studies. In contrast to large animal experiments, the recirculation delay, i.e., the delay between water production in tissues and its arterial recirculation to the rest of the body, has not been observed in small animals (18). Consequently, measurement of metabolism in small animals requires different modeling procedures than those used by this group and by many in the 15O PET community that include the recirculation delay (19, 20). In addition, small animal experiments have the luxury of measurements made with relatively ample amounts of  contrast agent. However, the high cost of 17O-enriched compounds dictates conservative use of
  for large animal experiments.
For the purpose of studying metabolic derangements, there are some additional drawbacks to using large animals. Large animal models also require invasive surgery for production of focal ischemia (21). In swine this typically involves a transorbital approach with direct vessel obstruction (22) or penetration of the skull and application of direct pressure to the brain to produce ischemia (23). These measures are employed because swine, like other large animals, have a highly collateralized cerebral circulation (24, 25). A less invasive method of causing global metabolic change utilizes hypothermia. This was demonstrated recently in rats with 17O in vivo MRS (26). Hypothermia has also been shown to reduce the metabolism of swine (27). Because of the long cooling times required by the hypothermic approach and the difficulty of maintaining large animal body temperature stability over the duration of the experiment, we sought a different method of metabolic manipulation.
For the above reasons and in order to demonstrate the detection of metabolic changes in large animals via T1ρ MRI based 17O detection, we have chosen administration of 2,4-dinitrophenol (DNP) to stimulate metabolism. DNP acts as a proton shuttle that disrupts the mitochondrial proton gradient used by ATP synthase to generate ATP. In doing so, DNP uncouples oxidative phosphorylation from ATP production; hence DNP is referred to as an uncoupling agent. This disruption induces elevated futile energetic consumption by cells to reestablish the proton gradient. The relevant effect is an increased conversion of O2 to H2O by complex IV, which can be measured by 17O imaging methods that directly measure conversion of  to H217O (i.e., they directly measure the activity of cytochrome oxidase, the ultimate step in oxidative phosphorylyation). DNP has been used in humans and many animals and has been shown to stimulate brain metabolism in goats when injected intravenously (28). However, there are no previous studies outlining the drug’s effects on swine (29, 30).
The goal of this manuscript is twofold: (i) to characterize the whole-body metabolic effects of large animal injection of DNP to assess its suitability for studies of metabolism, and (ii) to demonstrate in animals nearly the size of humans previously undescribed changes in brain metabolism stimulated by DNP utilizing the indirect method based on T1ρ MRI and direct 17O MRS techniques.
Results
DNP increased porcine whole-body oxygen consumption by 11.5%+/-2.5% s.d. per mg/kg animal weight of DNP administered intravenously (13 pigs, total of 21 doses). The linear correlation of DNP dose to whole-body oxygen consumption was r2 > .96. The pooled data are summarized in Table 1.
Table 1.
Whole-body oxygen consumption, measured as % change modulated by DNP injection
| DNP (mg/kg) | VO2 Increase | |
| Pig 1 | 5 | 38% ± 4% |
| 10 | 102% ± 5% | |
| 15 | 182% ± 9% | |
| Pig 2 | 3 | 35% ± 11% |
| 6 | 95% ± 9% | |
| 9 | 144% ± 1% | |
| Pig 3 | 6 | 50% ± 7% |
| 12 | 136% ± 16% | |
| Pig 4 | 6 | 60% ± 8% |
| 12 | 106% ± 12% | |
| Pig 5 | 6 | 70% ± 5% |
| 12 | 165% ± 6% | |
| Pig 6 | 6 | 50% ± 2% |
| 12 | 131% ± 11% | |
| Pig 7 | 9 | 101% ± 9% |
| Pig 8 | 9 | 103% ± 14% |
| Pig 9 | 9 | 104% ± 8% |
| Pig 10 | 9 | 154% ± 10% |
| Pig 11 | 9 | 120% ± 11% |
| Pig 12 | 9 | 115% ± 2% |
| Pig 13 | 9 | 101% ± 8% |
Whole-body oxygen consumption (VO2) was measured by respiratory gas analysis for a series of seven swine given various doses of DNP. The dose indicates the cumulative dose for each swine. For example, pig 1 was administered three 5 mg/kg boluses of DNP, for a final and maximum cumulative dose of 15 mg/kg. Each VO2 value represents an average of three respiratory measurements taken over one half hour after one distinct DNP bolus. The standard deviation of those three measurements is given as the ± value.
Whole-body metabolic stimulation was very stable, likely owing to the previously reported (29) long half-life of DNP, as shown for three pigs in Fig. 1. The data at time zero represents an average of three control measurements, the standard deviations being 2–8%. Each imaging experiment in the following figures requires 15 min. The very minor variations in metabolism on the time scale of the 15 min imaging experiment indicate that DNP induces a stable metabolic boost for these experiments.
Fig. 1.

Whole-body oxygen metabolism time course. Pigs 5 and 6 were administered 6 mg/kg of DNP twice at time 0 and time 30. Pig 7 was administered 9 mg/kg of DNP at time 0. The animals were followed with VO2 measurements every 10 min to assess the stability of the metabolic stimulation.
Five swine (pig 8–12) inhaled  -containing gas for 1 min prior to and following DNP administration. A representative pixel-by-pixel map of this signal change converted to units of CMRO2 is shown in Fig. 2. Hemispheric oxygen metabolism change for these five pigs is shown in Fig. 3 and compared to the whole-body VO2 change in Table 2. Overall, the average brain CMRO2 for each swine (N = 5) increased slightly more than the whole-body metabolism measurements (Increase = 14%, SD = 11%, p = 0.09 by two-tailed Student’s t-test with unequal variance). Pig 13 underwent direct, unlocalized 17O spectroscopy at 3T to verify the indirect measurements. The CMRO2 increase by unlocalized 17O direct spectroscopy is also similar to the CMRO2 by hemispheric indirect measurements. All imaging and spectroscopy measurements are included in Table 2.
Fig. 2.

Metabolic maps of CMRO2 before and after DNP stimulation. Images from a representative animal dataset using the indirect method. (A) A coronal (magnet axial) T1-weighted image, showing anatomical detail. (B) Average map of the resting cerebral metabolic rate during  administration before DNP administration. (C) The elevated CMRO2 map 30 min after a 9 mg/kg injection of DNP.
Fig. 3.

Summary of DNP stimulated brain metabolism measured using  . A series of six swine were delivered
  as a metabolic tracer during imaging or spectroscopy before (Pre, in gray) and 30 min after (Post, in black) DNP administration. The dip in signal from the generated H217O was converted into hemispheric (L, left; R, right) measurement of cerebral metabolism of oxygen (CMRO2) using the techniques in the methods (N = 18 measurements). The measurements from pigs 8–12 were performed using indirect imaging, exemplified in Fig. 2. The direct measurement was performed via unlocalized 17O spectroscopy and is taken to represent whole brain (WB) and surrounding structures, such as skin and temporalis muscle.
Table 2.
Summary of 17O-based measurements of metabolic stimulation
| Hemisphere |
Hemisphere |
Average | VO2 | ||||
| Left | CMRO2 | Increase | Right | CMRO2 | Increase | Increase | Increase |
| Pig 8 Pre | 0.74 ± 0.57 | 8 Pre | 0.64 ± 0.52 | ||||
| Pig 8 Post | 1.70 ± 0.21 | 129% | 8 Post | 1.74 ± 0.79 | 172% | 150% | 103% |
| Pig 9 Pre | 0.97 ± 0.29 | 9 Pre | 1.30 ± 0.68 | ||||
| Pig 9 Post | 2.75 ± 0.21 | 183% | 9 Post | 2.80 ± 0.58 | 116% | 150% | 104% |
| Pig 10 Pre | 0.83 ± 0.12 | 10 Pre | 0.85 ± 0.10 | ||||
| Pig 10 Post | 2.39 ± 0.53 | 189% | 10 Post | 2.75 ± 0.31 | 223% | 206% | 154% |
| Pig 11 Pre | 1.16 ± 0.40 | 11 Pre | 1.15 ± 0.17 | ||||
| Pig 11 Post | 2.38 ± 0.25 | 106% | 11 Post | 2.75 ± 0.31 | 139% | 123% | 120% |
| Pig 12 Pre | 0.98 ± 0.23 | 12 Pre | 1.44 ± 0.22 | ||||
| Pig 12 Post | 2.56 ± 0.20 | 162% | 12 Post | 2.58 ± 0.22 | 80% | 121% | 115% |
| Direct Unlocalized Brain | |||||||
| Pig 13 Pre | 0.74 ± 0.08 | ||||||
| Pig 13 Post | 1.38 ± 0.06 | 87% | 101% | ||||
The CMRO2 measurements are compared to whole-body measurements of metabolism by respiratory gas analysis. Data is split into left hemisphere and right hemisphere measurements of CMRO2 (μmol H217O/g brain/ min), their standard errors, and the percent increases for each hemisphere after DNP stimulation. The increases are also reported for whole-body VO2. The unlocalized spectroscopy data and relative increases are also shown with the same units.
Discussion
Here we have measured the whole-body and brain metabolic change due to DNP in a series of swine in order to establish DNP as a model of oxidative metabolic change. We show this increase in oxygen metabolism to be reliable and stable over the course of an imaging experiment by exhaled gas analysis. Respiratory measurements are compared to the brain oxidative metabolic change by the indirect and direct 17O MRI techniques to demonstrate the ability of these techniques to quantify metabolism.
Comparison with Other DNP Studies.
Due to the paucity of DNP literature on whole-body and brain metabolism, comparison of the results from the current study to those in the literature is not straightforward. The measured values for cerebral metabolic stimulation are comparable to goat brain measurements (28). However, in that study the brain metabolism was not compared to whole-body O2 consumption measurements. Direct comparison of our results with the goat results is obscured by uncertain dosage in the goat study as well as by cross-species differences in the DNP effect. For example, one study in dogs found whole-body stimulation of approximately 2.5-fold with a dose of 3 mg/kg (31) in comparison with the approximate twofold stimulation resulting from 9 mg/kg administered in our swine study. A canine study also found relative differences in the amount of stimulation between muscle (∼4.5×), gut (∼1.3×), and whole body (∼2.5×), demonstrating that the relative effects on various tissues are not consistent. To the best of our knowledge, we are unaware of any study comparing whole-body and brain metabolic stimulation by DNP in any species.
DNP Effects on Recirculation Delay and Temperature.
The metabolic modeling used in this study assumes minimal recirculation during the first 60 s of  inhalation. It is expected that this will not change with DNP stimulation for the following reasons. The blood convective delay portion of the recirculation delay is estimated at 10–15 s by iris fluorescein studies (32). The delay for
  to reach the brain is estimated at 10 s, based on 2.4 s for
  inhalation (33) and 7 s for
  transport to the brain (34). This leaves at least a 35 s delay for all other intervals of recirculation time:
  diffusion into the mitochondria and metabolism, followed by H217O diffusion through two mitochondrial membranes, diffusion out of the cell, and then diffusion to local capillaries. The only factor that would be expected to change with DNP stimulation is the convective delay, which is a minor temporal factor in the recirculation. The precise analysis of this delay would require very invasive blood sampling and analysis from brain venous sinuses before the blood mixes with venous blood from other sources, such as other structures of the head in the jugular vein.
A concern in the use of DNP is animal temperature increase; however, we observed systemic temperature changes after DNP administration of 1 °C or less in all but one pig. In piglets the rate of high energy phosphate equivalent flux changed only 5.3% per 1 °C (35). This implies that the small temperature increases measured in this study contribute a very minor contribution to the large CMRO2 increase after DNP administration. In the swine receiving the highest dose of DNP (Pig 1), the body temperature increased 2 °C within 30 min after 15 mg/kg DNP cumulative dose, and an additional 1 °C in 10 min after an additional 5 mg/kg (20 mg/kg cumulative dose). At this point, the animal was euthanized. By contrast, at the working dose of 9 mg/kg we observed a stable metabolic increase (∼100% whole-body) with stable vital signs.
Comparison of Localized and Unlocalized Data.
The unlocalized spectroscopy measurements include nonmetabolic tissue such as ventricle and weakly metabolic tissue such as surrounding skin and temporalis muscle. This may account for lower absolute pre- and post-DNP metabolism measured by the direct technique. According to dog data (31), and because muscle is mitochondrially rich, muscle stimulation by DNP should be higher for muscle relative to brain. However, these data indicate that the direct unlocalized technique measures relative metabolic stimulation comparable to the more specifically localized indirect data. This is likely because the coil size for direct spectroscopy is small relative to the swine head, and based on transmitter voltage calibrations and imaging, the regions of highest received signal are concentrated in the brain center. Segmentation analysis of direct 17O imaging signal overlaid upon 1H anatomical images indicates that less than 10% of the coil sensitivity occurs over muscle (for visualization see figure 5 a–c of ref. 17). Thus, muscle influence on the final metabolic measurement is minimal.
Signal-to-Noise Optimization for CMRO2 Measurements.
An analysis of SNR on CMRO2 measurements was previously published (see ref. 36, section 5.6, pp. 148–154). Those results are summarized as follows. The calculated CMRO2 is based upon the slope of the declining signal over time due to H217O production (Eq. 2). Given the large voxel size used in this imaging, the static SNR for each voxel is very high to minimize SNR contribution to measurement error. Despite that, temporal noise causes signal changes for a voxel or group of voxels (ROI) throughout a series of images. This temporal noise, including physiological noise, is the limiting factor in these experiments. Thus, the CMRO2 calculation error is primarily due to sources of temporal noise.
A method to mitigate physiological noise is to average the signal change over time over numerous pixels, because the physiological noise over an area is only somewhat correlated (37). Because H217O is produced over the entire brain, the H217O signal change should be highly correlated spatially. This explains our finding that averaging the signal change due to H217O over time of an increasing number of pixels decreases the effects of temporal noise on the CMRO2 measurement. That averaging over an area allows for the regional quantitative measurements shown in this work.
Considerations for Measurements in Cerebral Ischemia.
Measurements of metabolism during cerebral ischemia represent a future goal of CMRO2 measurements by 17O. As discussed in the introduction, this was not attempted due to severe difficulties in producing focal ischemia in large animal models. Measurements using 15O PET have become common in the research literature for cerebral ischemia measurements in humans (38). Methods for 17O tracer delivery and metabolic analysis are in some ways analogous to 15O PET but are simplified by the fact that  is invisible on MRI while the
  PET signal is inseparable from that of H215O . In contrast, modeling of 17O metabolism does not require flow measurements because the rate of metabolism is directly proportional to the rate of appearance of H217O in the first minute of measurement in this study. If desired, MR flow measures could readily be obtained for other purposes by MRI flow measures such as gadolinium perfusion, arterial spin labeling, or H217O perfusion (39) studies.
Considerations for Human Measurements.
It is important to note that these studies have been performed using a large animal model while human approval for  is awaited. Yet the indirect measurements in this manuscript were performed using clinical equipment. The only scanner modification required was a sequence upload, the same as required for implementation of other recent indirect imaging techniques not utilizing 17O transmission for decoupling listed in the introduction (such as ref. 5). Thus, these indirect techniques can be directly translated to human use in the near future.
One of the issues in using  for CMRO2 mapping is its cost. However, as demonstrated in this study, using approximately the volume of a single breath, the amount of
  used by these techniques in humans costs on the order of an MRI scan (∼$2,000). This cost is expected to decrease as more enriched 17O is produced. Because 17O is a stable isotope, the logistics of preparing, distributing, and performing scans based on 17O would be much easier than for the radioactive 15O PET and [1-18F] fluorodeoxyglucose PET. This ease of distribution partially mitigates the higher isotope cost of the 17O enriched products. The lack of radioactivity and chemical safety of 17O containing tracers presents a safer alternative to radioactive PET compounds.
The metabolic map generated here is comparable to the metabolic maps obtained by 15O PET (17), which due to similar modeling and signal issues also report data hemispherically. However, 17O measurements represent a technical improvement because they are much easier to obtain. This is because an onsite cyclotron is required to generate the 3 min half-life 15O isotope for human use (40).
This study and other recent developments in direct 17O MRI pave the way for using 17O-labeled compounds for detection of physiologic processes in humans. Specifically, in the case of direct 17O imaging and spectroscopy, higher fields provide many benefits (41). In addition, the direct imaging techniques have become mature and robust enough to undergo methodological studies with humans (42). Similarly, proton-detected 17O MRI approaches have recently undergone increasing development (13, 43, 44). While regulatory approval for human studies has hindered previous human 17O administration, at least one Institutional Review Board (IRB) has recently given permission for preliminary human studies using inhaled  (14). This is likely to continue, because one commercial provider of 17O products has become certified for current good manufacturing practices (Nukem Gmbh, Aschaffenburg, Germany).
In summary, we have demonstrated the ability of T1ρ based indirect 17O MRI using about a single breath of  to detect stimulation of cerebral metabolism by DNP in swine. This was performed with clinical hardware and methods that would be easily adapted to human studies on standard clinical MRI scanners. This work serves as a starting point for utilization of indirect 17O imaging to measure oxidative metabolism for a host of disease applications in humans.
Materials and Methods
Animal Preparation.
All experiments were approved by our Institutional Animal Care and Use Committee. Thirteen swine of 25–40 kg were anesthetized with ketamine 25 mg/kg, medetomadine 0.1 mg/kg, and glycopyrrolate 0.02 mg/kg intramuscularly. Anesthesia was maintained with ketamine 20–80 mg/kg/hr by continuous IV infusion. Swine were ventilated through an endotracheal tube with the custom precision delivery breathing circuit (33). Settings included a respiratory rate (RR) of eight breaths per minute and a tidal volume of approximately 25 mL/kg to keep arterial blood saturation measured by pulse oximetry stable and close to 100% at all times. All animals were euthanized after the experiment with pentobarbital administered under anesthesia.
Whole-Body Metabolic Measurements.
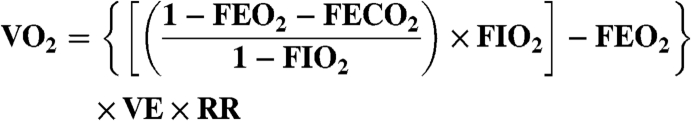
Whole-body metabolism was measured periodically during the experiment by capture of exhaled gas over three breaths in a Tedlar gas sampling bag (Jensen Inert Products, Coral Springs, FL). The concentrations of oxygen and carbon dioxide in the sampling bag were measured with a respiratory monitor (Gemini Analyzer, CWE Inc., Ardmore, PA). Measurements were converted to whole-body oxygen consumption rate, VO2 (mL/ min), by Eq. 1,
 |
[1] |
where FEO2 is the expired fraction of O2, FECO2 is the expired fraction of CO2, FIO2 is the inspired fraction of O2 (room air, 0.208), VE is the volume of expired gas per breath (tidal volume), and RR is the respiratory rate per minute metabolism (45). Values are reported as oxygen consumption per weight per minute by dividing Eq. 1 by the weight of the animal (kg).
2,4-Dinitrophenol Preparation and Preliminary Dosage Experiments.
The highest commercially available grade (> 99.5% purity by certificate of analysis) of DNP was used (Sigma-Aldrich D198501), and the powder exhibited its characteristic bright yellow color. As suggested previously (46), solutions were prepared within 1 d of use by adding 2.5 mg/mL of DNP and 5 mg/mL sodium bicarbonate (Sigma-Aldrich 13433) to 0.9% saline. The suspension was then brought to a near boil with constant stirring to dissolve, returned to room temperature, and filtered through a .1 μm filter (Millipore SCVPU02RE).
In swine, whole-body metabolic stimulation and vital signs under anesthesia were monitored while various levels of DNP were administered. The composite results of metabolic stimulation with various doses of DNP are displayed in Table 1. For these metabolic measurements as well as for whole-body measurements shown in Table 2, three separate respiratory measurements were obtained every 10 min beginning at least 10 min after the DNP injection. These measurements were averaged and compared relative to three measurements before administration of the DNP.
To measure the stability of the DNP metabolic stimulation effect, two swine were each given two 6 mg/kg DNP boluses a half hour apart, and the whole-body metabolic rate was measured every 10 min for 3 h. An additional swine was given a 9 mg/kg DNP bolus and followed for 50 min. These results are shown in Fig. 1 and are representative of the stability of other DNP doses.
Indirect 17O Imaging
Indirect 17O imaging was performed as described previously (43) on a 1.5 T Siemens clinical MRI scanner. In summary, low amplitude T1ρ prepared, single shot, single slice turbo spin-echo (TSE) images were acquired in a 15 min series at 3 s per image. The other imaging parameters were as follows: T1ρ amplitude = 100 Hz, spin-lock duration = 75 ms, TR = 3 s, TE = 5 ms, BW = 130 Hz/Px, FoV = 256 × 256, Matrix = 128 × 128, slice thickness = 5 mm.
After 5 min of room air inhalation, a mixture of 80% N2/20% O2 (70% 17O enriched) was inhaled for 1 min. A center weighted average of nine images just before the start of 1 min of  inhalation was used as the baseline metabolic reference. For conversion to 17O concentration and metabolism, image pixel intensities were averaged from hemispheric regions of interest (ROI). For each animal, these ROIs were manually segmented as bounded medially by the midline and otherwise by the brain cortex while excluding the lateral ventricles. The signal drop over the final 51 s of
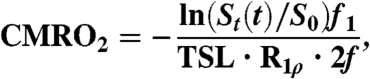
  inhalation was converted to metabolic rate of oxygen consumption by Eq. 2 (as derived in ref. 17).
 |
[2] |
where St(t) is the rate of signal change per minute, S0 is the baseline signal, R1ρ is the relaxation enhancement of tissue due to H217O [5.91 ∗ 10-6 (μmol/g water)-1 ms-1, based on measurements made on tissue phantoms (47), which closely approximates R2 (3)]. Other factors include the total relaxation time (75 ms of TSL plus the echo time of 5 ms), f1, the weight fraction of water in whole brain [0.77 g water/g tissue (48)], and f is a unitless adjustment for isotopic enrichment during the imaging period (see Tissue Isotopic Enrichment below). The reported standard errors are representative of CMRO2 measurement errors and are calculated from the standard error of the linear fit in Eq. 2 (indirect method) and Eq. 3 below (direct method). Measurements were performed twice—once before DNP administration and once 30 min after 9 mg/kg DNP administration.
Direct 17O Measurements.
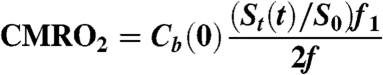
To verify the indirect method, one animal underwent two direct measurements before and after DNP administration. These experiments were performed on a Siemens 3 T MRI scanner equipped with multinuclear capability. Custom built transmit-receive switch and surface coils tuned to the 17O frequency were employed. Experiments were performed by placing a 9 cm surface coil tuned to 17O frequency over the head of the animal. A series of free induction decays (FID) were acquired before DNP administration and 30 min after 9 mg/kg DNP was injected. During the FID acquisition series, after 5 min of resting spectroscopy, a mixture of 80% N2/20% O2 (70% 17O enriched) was delivered for 1 min. Spectroscopy parameters were as follows: TR = 100 ms, 256 points, BW = 40 kHz, two step phase cycling, repeated 9,000 times over 15 min. Data were binned into 30 averages per point (3 s) and processed according to Eq. 3:
 |
[3] |
The integrals of the H217O peaks over time increased during metabolism; these data were converted to units of signal change per minute, St(t), and normalized by the baseline integral S0. The fractional signal, visualized in Fig. 4, is directly proportional to H217O concentration normalized by the same constants (f, f1) as in Eq. 2. Eq. 3 was converted to units of H217O concentration by scaling with Cb(0), the natural abundance concentration of H217O (20.35 μmol H217O/g water).
Fig. 4.

Direct H217O spectroscopy changes with  delivery. (A) The natural abundance concentration of H217O visualized by pulse-acquire 17O spectroscopy. (B) After 60 seconds of
  delivery, the integral is approximately 10% larger in the swine given DNP. The change in the size of this peak is due to the conversion of
  to H217O. Metabolic rate is proportional to the magnitude of the change.
Tissue Isotopic Enrichment.
The estimated average enrichment of  reaching tissue over the measurement time, f = .55, was based on the model presented in ref. 17 recalculated for a tidal volume of 25 mL/kg, inhaled oxygen fraction of 0.2, 17O fractional enrichment of gas of 0.7, functional residual capacity of 50 mL/kg, VO2 of 5 mL/kg/ min (baseline measured in this study as 4.9 + /-1.19 s.d., N = 7 swine), and a respiratory rate of 8 breaths/ min.
Acknowledgments.
The authors wish to acknowledge technical assistance by Ashwini R. Anumandla and Santosh R. Gaddam, as well as manuscript editing assistance by Jerry D. Glickson. We also wish to acknowledge funding support from the National Center for Research Resources (RR02305), the National Institute of Biomedical Imaging and Bioengineering (R01EB004349), and the National Institute of Neurological Disorders and Stroke (F30NS059116).
Footnotes
The authors declare no conflict of interest.
References
- 1.Meiboom S. Nuclear magnetic resonance study of proton transfer in water. J Chem Phys. 1961;34(2):375–388. [Google Scholar]
- 2.de Crespigny AJ, D’Arceuil HE, Engelhorn T, Moseley ME. MRI of focal cerebral ischemia using 17O-labeled water. Magn Reson Med. 2000;43(6):876–883. doi: 10.1002/1522-2594(200006)43:6<876::aid-mrm14>3.0.co;2-y. [DOI] [PubMed] [Google Scholar]
- 3.Reddy R, Stolpen AH, Leigh JS. Detection of 17O by proton T1 rho dispersion imaging. J Magn Reson Ser B. 1995;108(3):276–279. doi: 10.1006/jmrb.1995.1133. [DOI] [PubMed] [Google Scholar]
- 4.Ronen I, Lee JH, Merkle H, Ugurbil K, Navon G. Imaging H217O distribution in a phantom and measurement of metabolically produced H217O in live mice by proton NMR. NMR Biomed. 1997;10(7):333–340. doi: 10.1002/(sici)1099-1492(199710)10:7<333::aid-nbm465>3.0.co;2-e. [DOI] [PubMed] [Google Scholar]
- 5.Sood R. Off-resonance binomial preparatory pulse technique for high sensitivity MRI of H2O17. Magn Reson Imaging. 2004;22(2):181–195. doi: 10.1016/j.mri.2003.09.005. [DOI] [PubMed] [Google Scholar]
- 6.Pekar J, et al. In vivo measurement of cerebral oxygen consumption and blood flow using 17O magnetic resonance imaging. Magn Reson Med. 1991;21(2):313–319. doi: 10.1002/mrm.1910210217. [DOI] [PubMed] [Google Scholar]
- 7.Mateescu GD, Cabrera ME. In vivo 17O magnetic resonance spectroscopy. Determination of temperature effects on metabolic rates (Q10 factor) Adv Exp Med Biol. 1997;411:585–590. [PubMed] [Google Scholar]
- 8.Arai T, et al. Cerebral oxygen utilization analyzed by the use of oxygen-17 and its nuclear magnetic resonance. Biochem Biophys Res Commun. 1990;169(1):153–158. doi: 10.1016/0006-291x(90)91447-z. [DOI] [PubMed] [Google Scholar]
-
9.Fiat D, et al. In vivo 17O NMR study of rat brain during
 inhalation. Magn Reson Med. 1992;24(2):370–374. doi: 10.1002/mrm.1910240218. [DOI] [PubMed] [Google Scholar]
 -
10.Zhang N, Zhu XH, Lei H, Ugurbil K, Chen W. Simplified methods for calculating cerebral metabolic rate of oxygen based on 17O magnetic resonance spectroscopic imaging measurement during a short
 inhalation. J Cereb Blood Flow Metab. 2004;24(8):840–848. doi: 10.1097/01.WCB.0000125885.54676.82. [DOI] [PubMed] [Google Scholar]
 - 11.Fiat D, Kang S. Determination of the rate of cerebral oxygen consumption and regional cerebral blood flow by non-invasive 17O in vivo NMR spectroscopy and magnetic resonance imaging. Part 2. Determination of CMRO2 for the rat by 17O NMR, and CMRO2, rCBF and the partition coefficient for the cat by 17O MRI. Neurol Res. 1993;15(1):7–22. doi: 10.1080/01616412.1993.11740100. [DOI] [PubMed] [Google Scholar]
- 12.Zhu XH, et al. Development of 17O NMR approach for fast imaging of cerebral metabolic rate of oxygen in rat brain at high field. Proc Natl Acad Sci USA. 2002;99(20):13194–13199. doi: 10.1073/pnas.202471399. [DOI] [PMC free article] [PubMed] [Google Scholar]
-
13.Tailor DR, Baumgardner JE, Regatte RR, Leigh JS, Reddy R. Proton MRI of metabolically produced H2 17O using an efficient
 delivery system. Neuroimage. 2004;22(2):611–618. doi: 10.1016/j.neuroimage.2004.02.024. [DOI] [PubMed] [Google Scholar]
 - 14.Zhu X, et al. High-field 17O Study of 3D CMRO2 imaging in human visual cortex; 14th Scientific Meeting, International Society for Magnetic Resonance in Medicine; Berkeley, CA: International Society for Magnetic Resonance in Medicine; 2006. p. 409. [Google Scholar]
- 15.Atkinson IC, Thulborn KR. Non-invasive, whole-brain CMRO2 mapping of the human brain; 17th Scientific Meeting, International Society for Magnetic Resonance in Medicine; 2009. p. 609. [Google Scholar]
- 16.Fox PT, Mintun MA, Raichle ME, Herscovitch P. A noninvasive approach to quantitative functional brain mapping with H2 15O and positron emission tomography. J Cereb Blood Flow Metab. 1984;4(3):329–333. doi: 10.1038/jcbfm.1984.49. [DOI] [PubMed] [Google Scholar]
-
17.Mellon EA, et al. Estimation of the regional cerebral metabolic rate of oxygen consumption with proton detected 17O MRI during precision
 inhalation in swine. J Neurosci Methods. 2009;179(1):29–39. doi: 10.1016/j.jneumeth.2009.01.008. [DOI] [PMC free article] [PubMed] [Google Scholar]
 - 18.Zhang X, et al. Measurement of arterial input function of 17O water tracer in rat carotid artery by using a region-defined (REDE) implanted vascular RF coil. MAGMA. 2003;16(2):77–85. doi: 10.1007/s10334-003-0013-9. [DOI] [PubMed] [Google Scholar]
- 19.Mintun MA, Raichle ME, Martin WR, Herscovitch P. Brain oxygen utilization measured with O-15 radiotracers and positron emission tomography. J Nucl Med. 1984;25(2):177–187. [PubMed] [Google Scholar]
- 20.Ohta S, Meyer E, Thompson CJ, Gjedde A. Oxygen consumption of the living human brain measured after a single inhalation of positron emitting oxygen. J Cereb Blood Flow Metab. 1992;12(2):179–192. doi: 10.1038/jcbfm.1992.28. [DOI] [PubMed] [Google Scholar]
- 21.Traystman RJ. Animal models of focal and global cerebral ischemia. Ilar J. 2003;44(2):85–95. doi: 10.1093/ilar.44.2.85. [DOI] [PubMed] [Google Scholar]
- 22.Zhang L, Cheng H, Shi J, Chen J. Focal epidural cooling reduces the infarction volume of permanent middle cerebral artery occlusion in swine. Surg Neurol. 2007;67(2):117–121. doi: 10.1016/j.surneu.2006.05.064. discussion 121. [DOI] [PubMed] [Google Scholar]
- 23.Andrews RJ, Muto RP. Retraction brain ischaemia: Cerebral blood flow, evoked potentials, hypotension and hyperventilation in a new animal model. Neurol Res. 1992;14(1):12–18. doi: 10.1080/01616412.1992.11740004. [DOI] [PubMed] [Google Scholar]
- 24.Haaland K, Orderud WJ, Thoresen M. The piglet as a model for cerebral circulation: An angiographic study. Biol Neonate. 1995;68(1):75–80. doi: 10.1159/000244220. [DOI] [PubMed] [Google Scholar]
- 25.Burbridge B, Matte G, Remedios A. Complex intracranial arterial anatomy in swine is unsuitable for cerebral infarction projects. Can Assoc Radiol J. 2004;55(5):326–329. [PubMed] [Google Scholar]
- 26.Zhu XH, Zhang Y, Zhang N, Ugurbil K, Chen W. Noninvasive and three-dimensional imaging of CMRO2 in rats at 9.4 T: Reproducibility test and normothermia/hypothermia comparison study. J Cereb Blood Flow Metab. 2007;27(6):1225–1234. doi: 10.1038/sj.jcbfm.9600421. [DOI] [PubMed] [Google Scholar]
- 27.Ehrlich MP, et al. Effect of hypothermia on cerebral blood flow and metabolism in the pig. Ann Thorac Surg. 2002;73(1):191–197. doi: 10.1016/s0003-4975(01)03273-8. [DOI] [PubMed] [Google Scholar]
- 28.Flood S, Aukland K. In vivo measurements of local metabolic rate in the goat brain. J Appl Physiol. 1971;30(2):238–247. doi: 10.1152/jappl.1971.30.2.238. [DOI] [PubMed] [Google Scholar]
- 29.Harris MO, Cocoran JJ. Toxicological Profile for Dinitrophenols. Atlanta: US Department of Health and Human Services, Public Health Service; 1995. [Google Scholar]
- 30.Clark WG, Clark YL. Changes in body temperature after administration of antipyretics, LSD, delta 9-THC, CNS depressants and stimulants, hormones, inorganic ions, gases, 2,4-DNP and miscellaneous agents. Neurosci Biobehav Rev. 1981;5(1):1–136. doi: 10.1016/0149-7634(81)90039-7. [DOI] [PubMed] [Google Scholar]
- 31.King CE, Cain SM. Regional O2 uptake during hypoxia and recovery in hypermetabolic dogs. J Appl Physiol. 1987;63(1):381–386. doi: 10.1152/jappl.1987.63.1.381. [DOI] [PubMed] [Google Scholar]
- 32.Brancato R, Bandello F, Lattanzio R. Iris fluorescein angiography in clinical practice. Surv Ophthalmol. 1997;42(1):41–70. doi: 10.1016/s0039-6257(97)84042-8. [DOI] [PubMed] [Google Scholar]
-
33.Baumgardner JE, et al. Mechanical ventilator for delivery of
 in brief pulses. Open Biomed Eng J. 2008;2(1):57–63. doi: 10.2174/1874120700802010057. [DOI] [PMC free article] [PubMed] [Google Scholar]
 - 34.Leggett RW, Williams LR. A proposed blood circulation model for reference man. Health Phys. 1995;69(2):187–201. doi: 10.1097/00004032-199508000-00003. [DOI] [PubMed] [Google Scholar]
- 35.Laptook AR, Corbett RJ, Sterett R, Garcia D, Tollefsbol G. Quantitative relationship between brain temperature and energy utilization rate measured in vivo using 31P and 1H magnetic resonance spectroscopy. Pediatr Res. 1995;38(6):919–925. doi: 10.1203/00006450-199512000-00015. [DOI] [PubMed] [Google Scholar]
- 36.Mellon EA. Philadelphia: Univ of Pennsylvania; 2008. PhD dissertation. [Google Scholar]
- 37.Triantafyllou C, Hoge RD, Wald LL. Effect of spatial smoothing on physiological noise in high-resolution fMRI. Neuroimage. 2006;32(2):551–557. doi: 10.1016/j.neuroimage.2006.04.182. [DOI] [PubMed] [Google Scholar]
- 38.Sobesky J, et al. Does the mismatch match the penumbra? Magnetic resonance imaging and positron emission tomography in early ischemic stroke. Stroke. 2005;36(5):980–985. doi: 10.1161/01.STR.0000160751.79241.a3. [DOI] [PubMed] [Google Scholar]
- 39.Tailor DR, et al. Indirect 17O-magnetic resonance imaging of cerebral blood flow in the rat. Magn Reson Med. 2003;49(3):479–487. doi: 10.1002/mrm.10403. [DOI] [PubMed] [Google Scholar]
- 40.Ibaraki M, et al. Quantification of cerebral blood flow and oxygen metabolism with 3-dimensional PET and 15O: Validation by comparison with 2-dimensional PET. J Nucl Med. 2008;49(1):50–59. doi: 10.2967/jnumed.107.044008. [DOI] [PubMed] [Google Scholar]
- 41.Zhu XH, et al. In vivo 17O NMR approaches for brain study at high field. NMR Biomed. 2008;18(2):83–103. doi: 10.1002/nbm.930. [DOI] [PubMed] [Google Scholar]
- 42.Fiat D, Hankiewicz J, Liu S, Trbovic S, Brint S. 17O magnetic resonance imaging of the human brain. Neurol Res. 2004;26(8):803–808. doi: 10.1179/016164104X5156. [DOI] [PubMed] [Google Scholar]
- 43.Mellon EA, et al. Single shot T1(rho) magnetic resonance imaging of metabolically generated water in vivo. Adv Exp Med Biol. 2009;645:279–286. doi: 10.1007/978-0-387-85998-9_42. [DOI] [PubMed] [Google Scholar]
- 44.Tailor DR, Poptani H, Glickson JD, Leigh JS, Reddy R. High-resolution assessment of blood flow in murine RIF-1 tumors by monitoring uptake of H(2)17O with proton T(1rho)-weighted imaging. Magn Reson Med. 2003;49(1):1–6. doi: 10.1002/mrm.10375. [DOI] [PubMed] [Google Scholar]
- 45.Madama VC. Pulmonary function testing and cardiopulmonary stress testing. 2nd Ed. Albany, NY: Delmar Publishers; 1998. p. 350. [Google Scholar]
- 46.Williams TF, Winters RW, Clapp JR, Hollander W, Jr, Welt LG. Effects of 2,4-dinitrophenol on respiration in the dog. Am J Physiol. 1958;193(1):181–188. doi: 10.1152/ajplegacy.1958.193.1.181. [DOI] [PubMed] [Google Scholar]
- 47.Stolpen AH, Reddy R, Leigh JS. 17O-decoupled proton MR spectroscopy and imaging in a tissue model. J Magn Reson. 1997;125(1):1–7. doi: 10.1006/jmre.1996.1071. [DOI] [PubMed] [Google Scholar]
- 48.Herscovitch P, Raichle ME. What is the correct value for the brain–blood partition coefficient for water? J Cereb Blood Flow Metab. 1985;5(1):65–69. doi: 10.1038/jcbfm.1985.9. [DOI] [PubMed] [Google Scholar]