

Abstract
Objective
To compare the Cone-Beam Computerized Tomography (CBCT) scan measurements between patients with Obstructive Sleep Apnea (OSA) and snorers to develop a prediction model for OSA based on CBCT imaging and the Berlin Questionnaire.
Materials and methods
80 subjects (46 OSA patients with Apnea-Hypoapnea Index [AHI]≥ 10 and 34 snorers AHI<10 based on ambulatory somnographic assessment) were recruited through flyers and mail at USC School of Dentistry and at a private practice. Each patient answered the Berlin Questionnaire, and was imaged with CBCT in supine position. Linear and volumetric measurements of the upper airway were performed by one blinded operator and multivariate logistic regression analysis was used to identify risk factors for OSA.
Results
OSA patients were predominantly male, older, had a larger neck size and larger Body Mass index than the snorers. The minimum cross-sectional area of the upper airway and its lateral dimension were significantly smaller in the cases. Airway uniformity defined as the minimum cross-sectional area divided by the average area was significantly smaller in the OSA patients.
Conclusions
Age>57 years, male gender, a “high risk” Berlin Questionnaire and narrow upper airway lateral dimension (<17mm) were identified as significant risk factors for OSA. The results of this study indicate that 3-dimensional CBCT airway analysis could be used as a tool to assess the presence and severity of OSA. The presence and severity (as measured by the RDI) of OSA is associated with a narrow lateral dimension of the airway, increasing age, male gender, and the Berlin questionnaire.
Keywords: Cone-Beam Computerized Tomography, Obstructive sleep apnea, Upper airway, Volume
1. Introduction
Sleep apnea is a disorder of interrupted breathing during sleep due to collapse of the airway during breathing when the pharyngeal and tongue muscles relax during sleep causing an obstructive event. A study released in 1993 by Young et al.1 estimated that 2% to 4% of the middle-aged adult population in North America suffers from Obstructive Sleep Apnea (OSA) and this prevalence increases dramatically with aging. Data generated by Young’s team suggest at least 75% percent of severe sleep apnea cases still go undetected2 People with severe apnea who went untreated were four times as likely to die as those without the disorder. Identifying at-risk individuals as early as possible improves intervention and might reduce morbidity.
Sleep apnea is more prevalent among the obese, in males, and in older individuals. Risk factors include also adenotonsillar hypertrophy (particularly in children and young adults) and craniofacial skeletal abnormalities (particularly in non-obese adults and children). Two-dimensionsal cephalometric imaging has been used to look for anatomic differences in OSA patients for over 15 years.3 Schwab reviewed the cephalometric literature and reported that the most common skeletal abnormalities were (1) mandibular and maxillary deficiency, (2) reduced dimension of the posterior airway space (measured at the base of the tongue), (3) enlarged tongue, (4) enlarged soft palate, and a (5) caudally displaced hyoid. Miles et al. 4 performed a detailed meta-analysis of the literature that compare OSA and control groups and they concluded that the studies varied widely in quality. Finally, a major disadvantage of cephalometric measurements is that the imaging is usually performed in an upright posture (which is not a natural sleeping position compared to supine position) and a lateral cephalometric view of the airway does not appreciate its 3-dimensional form since it cannot capture the width of the airway. Recently Aboudara et al.5 confirmed this view. The authors studied a group of adolescents to compare imaging information about nasopharyngeal airway size between a lateral cephalometric headfilm and a 3-dimensional cone-beam computed tomography scan. They concluded that accurate volumetric nasopharyngeal airway estimates from the lateral headfilm are questionable because there could be a small volume that is not detected in a patient.
When the actual caliber of the airway has been assessed, clear cut differences between individuals with and without OSA have been reported by multiple authors.6, 7 A significant association between airway collapsibility and both soft palate length and hyoid bone position has been reported.8 Schwab et al, 9 found in awake subjects at the minimum airway area, that the thickness of the lateral pharyngeal muscular walls rather than enlargement of the parapharyngeal fat pads was the predominant anatomic factor causing airway narrowing in apneic subjects. In a following study 10 the researchers found using MRI significantly increased risk of sleep apnea the larger the volume of the tongue, lateral pharyngeal walls, and total soft tissue. Trudo et al.11 found a narrowing in the retropalatal (RP) region of the airway due to posterior movement of the soft palate, thickening of the lateral pharyngeal walls and an increase in tongue oblique distance. Chen et al. 12 found that the anteroposterior and the lateral diameters of the RP region, as well as the smallest area of the RP region, are significantly smaller in subjects with OSA. Ogawa et al. 13 reported smaller anteroposterior dimension of the minimum cross-section segment and smaller minimum cross-section area positioned below the occlusal plane in 70% of the cases and always retropalatal.
These data suggest that 3-dimensional airway assessment collected in supine position has promise. The objective of this study is to compare the upper airway characteristics of OSA patients with a control group of snorers, using CBCT 3-D imaging for future prediction of OSA based on imaging. The study will quantify the lateral and antero-posterior dimensions of the smallest cross-sectional area of the upper airway, as well as minimum caliber, volumetric measurements, airway and soft palate dimensions.
2. Methods and Materials
Study design
This is a prospective case-control study since the outcome is relatively rare (sleep apnea) and there is a second group of controls (snorers). The data (CBCT measurements and Berlin Questionnaire) was assessed on all the subjects at recruiting time.
Subjects
This prospective study included 80 patients: snorers with Apnea-Hypoapnea Index [AHI]<10 events/hr (21 male and 13 female, mean age: 50.8± 13.5 years/old), and OSA patients with AHI≥10 (42 male and 4 female, mean 57.5 ± 10.3 years/old) enrolled between June 2006 and May 2009 through mail and flyers among Dr Clark’s patients and Faculty and staff at USC School of Dentistry. Our “control” group were patients who participated in the study and had AHI<10, and were recruited by the same means. All patients had been referred for a CBCT scan at the Redmond Imaging Center, School of Dentistry, University of Southern California. Data such as age, gender, BMI, race/ethnicity and blood pressure was recorded. Each participant answered the Berlin Questionnaire.14 The answers to the Berlin Qestionnaire were based only in participant’s self-assessment.
After signing informed consent all subjects had a 2-night baseline ambulatory sleep study (ARES Unicorder, ABM, San Diego, CA) to assess the outcome (AHI). Of the 81 patients who signed the informed consent only one had an unusable CBCT, leaving us with 80 subjects with CBCT plus sleep study data. Table 1 presents descriptive statistics of our groups. This prospective study was approved by the Institutional Review Board of the University of Southern California HSC-051050.
Table 1.
Descriptive statistics for OSAs (AHI≥10) and snorers (AHI<10).
| OSAs | Snorers | T-Test | |
|---|---|---|---|
| Mean ± SD (N=46) | Mean ± SD (N=34) | p-value | |
| Gender | 42M : 4F | 21M : 13F | 0.001† |
| Age (yrs) | 57.5 ± 10.25 | 50.8 ± 13.46 | 0.014 |
| Neck Circumference (inch) | 16.4 ± 1.40 | 14.8 ± 1.29 | <.0001 |
| Body Mass Index (kg/m2) | 27.7 ± 3.83 Range:[21.5–36.0] |
25.13 ± 3.33 Range:[18.2–33.5] |
0.0026 |
| AHI (events/hour) | 27.6 ± 17.13 Range:[10–79] |
4.3 ± 2.85 Range:[0–9] |
<.0001‡ |
| Apnea Index (events/hour) | 14.7 ± 16.03 Range:[0–68] |
1.2 ± 1.42 Range:[0–5] |
<.0001‡ |
Chi-square
Wilcoxon Rank Sum test for non-parametric variables
CBCT Scan
All subjects were radiographically evaluated in supine position with Frankfort plane perpendicular to the floor during their awake periods. This study evaluated the 3D images obtained by a cone-beam CT (Newtom QR 3G; QA sri, Via Silvestrini 20, 37135 Verona, Italy). The Newtom is the only commercially available CBCT which images the patient in supine position. Therefore is ideally suited to study OSA patients and snorers as OSA typically occurs while the patient is asleep in the supine position.15 A recent study based on the 2007 ICRP guidelines suggests that the effective dose of the Newtom 3G is approximately 68 Sv. 16 DICOM (Digital Imaging and Communications in Medicine) images were imported in the vWorks 5.0™ software (Cybermed, Seoul, Korea).
OSA assessment
In this study two-night in-home studies for assessment of OSA were performed with the Apnea Risk Evaluation System (ARES) Unicorder (Advanced Brain Monitoring, Carlsbad, CA, USA) for all subjects. The ARES Unicorder measured oxygen saturation, pulse rate, airflow, respiratory effort, snoring levels, head movement, and head position from a wireless recorder self applied with a single strap to the forehead. The reliability of ARES system has been evaluated in two studies and compared to polysomnography in the lab. The diagnostic sensitivity of in-lab ARES for diagnosing OSA using an AHI cut-off of 15 per hour is 95% and specificity is 94%, with a positive likelihood ratio (LR+) =17.04, and negative likelihood ratio (LR−) = 0.06, according to a prior study with 80 OSA patients and 22 volunteers. For in-home ARES data the sensitivity was 85% and specificity 91% (LR+ = 9.34, LR− = 0.17).17 In a second study, the concurrent in-laboratory comparison yielded a sensitivity of 97.4, a specificity of 85.6, a positive predictive value of 93.6, and a negative predictive value of 93.9 with 284 subjects; in-home comparison sensitivity, specificity, positive predictive value, and negative predictive value were 91.5, 85.7, 91.5, and 85.7, respectively.18
Questionnaire
Cases and controls answered the same questionnaire including personal demographics and the Berlin Questionnaire itself. 14,19 In the demographics section we collected for each subject: gender (female/male), age in years and months, weight in pounds, height in feet and inches, systolic and diastolic blood pressure. The Berlin Questionnaire contains 11 questions divided in three categories of questions related to snoring/sleeping patterns. One introductory question and four follow-up questions (q1-q5) concerned snoring, witnessed apneas, and the frequency of such events. Two questions addressed daytime sleepiness, with two questions about drowsy driving and frequency (q6-q9). One question asked for a history of high blood pressure (BP). The exposure assessment was not verified in any way by the researcher and was based only in participant’s self-assessment. The answers to the questions were converted to dichotomous or categorical variables for the analysis. A subject will have a “high risk” score if two or three of the following categories are scored at risk:
Category 1 (Questions 1–5): In category 1, a positive score for risk is defined as frequent symptoms (ie, “more than three to four times per week” or “almost every day”) in the questions about snoring (q3) and witnessed apneas (q5).
Category 2 (Questions 6–9): In category 2, a positive score for risk was frequent symptoms in two or more questions about awakening sleepy (q6), waketime sleepiness (q7), and/or drowsy driving (q8–9).
Category 3 (Questions 10–11): In category 3, a positive score for risk was defined as a self-report of high blood pressure and/or a BMI of > 30 kg/m2.
For each subject we obtain a “high risk” or “no risk” score for OSA.
Methods
DICOM images were imported into software Vworks 5.0 (Cybermed, Seoul, Korea) by one blinded operator. To define the volumetric region of interest (VOI), the user first selected a midsagittal image of the airway and used the following planes as upper and lower VOI borders: The upper border was defined by a plane drawn parallel to the Frankfort plane and going through the most distal point of the bony hard palate; the lower border was set by a plane drawn parallel to the Frankfort plane and going through the most anterior-inferior point of the second cervical vertebrae (see Figure 1). To define the anterior-posterior and lateral borders of our VOI we used the following convention: as shown in Figure 2, we selected in an axial view of the airway a large enough square area that will always contain the airway within its borders (the software allows the user to display up and down the axial images to check that the airway is always contained in the square area). Between the upper and lower borders and within the limiting axial square borders the airway VOI was determined. The actual limits of the segmented airway involved one blinded operator tracing the soft tissue-air interface for each axial slice using the Vworks software segmentation tools: thresholding, region growing, dilation and erosion. From the segmented airway images, the software automatically computed the surface mesh shown in Figure 3 and the volume of the oropharyngeal region in mm3. The program also automatically reports the cross-sectional area in mm2 for each axial slice, so to find the slice with the minimum airway locus the operator has to visualize all the slices in the upper airway region and select the smallest. Once we identified the slice with the smallest computed cross-section area, we measured its anteroposterior (AP) and lateral (L) dimensions (Figure 2). Total airway length from PNS to the most anterior-inferior point of the second cervical vertebrae was measured. Horizontal (HSP) and vertical soft palate (VSP) lengths were measured in mid-sagittal image (Figure 4). HSP is the distance from the posterior nasal spine to the vertical line going through the most posterior contour of soft palate (in the mid-sagittal plane). VSP is the distance from the horizontal line going through the posterior nasal spine to the tip of soft palate. Uniformity of volume was defined as the minimum area divided by the average area. Reader is referred to section about reliability of the measurements below for our error analysis.
Figure 1.
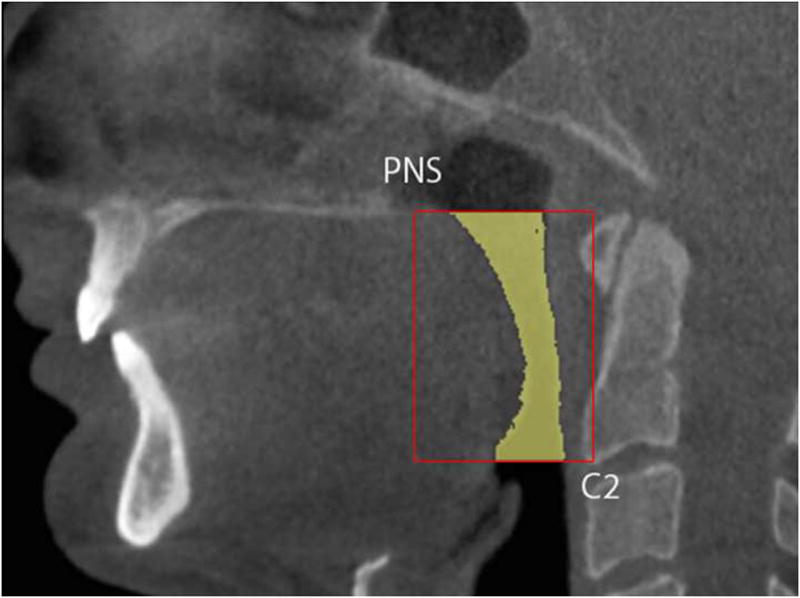
Borders of region of interest in sagittal view.
Figure 2.
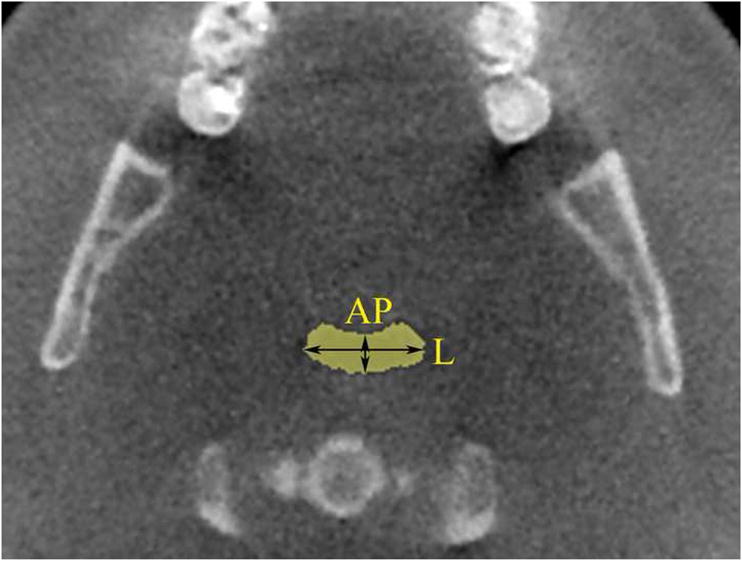
Borders of region of interest in axial view (yellow square). AP and lateral measurements of smallest cross-sectional area are shown.
Figure 3.
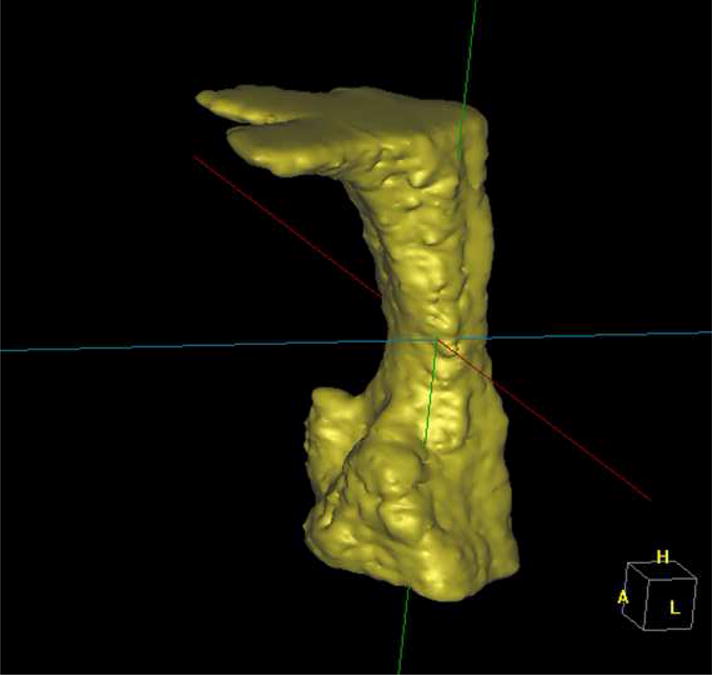
3D airway
Figure 4.
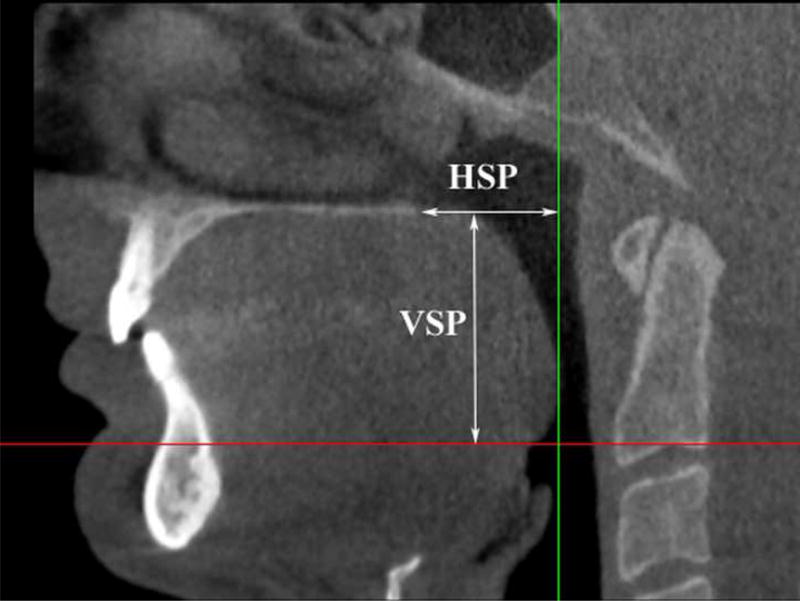
Vertical (VSP) and horizontal (HSP) soft palate dimensions.
Statistical analyses
Descriptive statistics were obtained for each measurement. The answers to the Berlin Questionnaire were converted to dichotomous variables for the analyses (“high risk” or “no risk” score for OSA). Histograms and Kolmorogov-Smirnov tests were used to check for normality of all variables. The independent t-test, and the Wilcoxon Signed Ranks test were used to compare continuous variables. Chi-square test was used to compare race, ethnicity and gender. Since overall AHI values failed to pass the test for normality, the AHI values were log-transformed. The transformed data was then used for multiple linear regression analyses. We assessed the correlations between continuous variables and AHI using the nonparametric Spearman rank test. Potential associations between log(AHI) and individual risk factors were assessed for significance with a χ2 test and standard regression techniques. The linear regression assumptions of the residuals were successfully evaluated. Multiple linear regression with stepwise selection of variables was performed to evaluate the relation of log(AHI) and those variables, which showed a significant association in the univariate model or for comparison with prior work. Median data was used to categorize the continuous variables selected in the final model, and stepwise logistic regression analysis was carried out. Regression analyses were repeated with stepwise regression and minimum Mallow’s Cp. Statistical analyses were performed using SAS System for Windows (Version 9.0 or later, SAS Institute, Cary, NC). A p-value less than 0.05 was used to determine statistical significance.
Reliability of measurements
To test the reliability of the CBCT measurements, 20 patients were randomly selected and their images re-measured by the same examiner after a 60-day interval. Statistical analysis of the difference between the duplicate measurements was conducted by deriving the Intraclass Correlation Coefficient. Linear measurements were highly reproducible with mean Intraclass Correlation Coefficient of 0.977±0.01 for airway length, AP, lateral dimension, VSP and HSP. The ICCC was 0.965 for volumetric measurements and 0.979 for computing the minimum cross-sectional airway. These are highly reproducible results.
Sample size calculations
Using the pilot data in (Ogawa et al, 2007),13 we calculated the equal number of cases and snorers necessary for 80% power to find a statistically significant (two-sided alpha=.05) difference between the measurements of each of the CT variables: AP, L, volume, and minimum area. The a priori required sample size for 80% power was N1=N2=10 subjects for minimum area and AP, N1=N2=25 subjects for L, and N1=N2= 37 for volume comparison.
Assuming that 32.3% of subjects will be classified as high-risk by the Berlin questionnaire, and using Netzer’s data19 showing that the unadjusted odds ratio for an RDI>30 given high-risk status is 5.39, we calculate a p2=.72, and a sample size of 24 cases and 24 snorers to provide 80% power with a 5% two-sided significance level. Our final sample size would provide us with 95.5% power for the Berlin questionnaire.
3. Results
Descriptive statistics
Table 1 presents the subjects’ gender and mean age, Body Mass Index (BMI), neck circumference and somnographic variables (Apnea-Hypoapnea Index and Apnea Index). The two groups were statistically significantly different in mean age, BMI and neck circumference, with the cases older, heavier and with thicker necks than snorers as expected. The snorers’ mean age was 7 years lower than the mean age of the cases.
Cases were mostly males (42/46), and gender distribution was statistically significantly different from snorers (p=.001). Snorers’ mean neck circumference was 1.6 inches narrower than cases. At baseline the two groups were statistically significantly different in apnea severity as measured by apnea events per hour (p<.0001) and apnea-hypoapnea index (p<.0001). This is to be expected as OSA cases were patients with an AHI≥10/hr and otherwise the subject was deemed a control. There were no statistically significant differences in race (Table 2) or ethnicity distribution (Table 3) between the two groups.
Table 2.
Comparison of race distribution between OSA and control groups.
| Race | OSAs (N=46) | Snorers (N=34) | Chi-square p-value |
|---|---|---|---|
| 1=American Indian or Alaska native | 0 | 1 | 0.162 |
| 2=Asian | 11 | 3 | |
| 3=Native Hawaiian or other Pacific islander | 0 | 0 | |
| 4=Black or African American | 1 | 0 | |
| 5=White | 34 | 30 |
Table 3.
Comparison of ethnicity distribution between OSAs and snorers.
| Ethnicity | OSA patients (N=46) | Snorers (N=34) | Chi-square p-value |
|---|---|---|---|
| 1=Hispanic | 7 | 1 | 0.070 |
| 2=Non Hispanic | 39 | 33 |
CBCT measurements comparison by OSA status
Table 4 presents the results of the independent t-tests (or Wilcoxon test for non-parametric variables) comparing cases and snorers. The smallest cross-section area (p=0.012), the lateral dimension (p=0.035) and the airway uniformity (p=0.008) showed statistically significant group differences. There were no statistically significant group differences in median AP, mean airway length, vertical and horizontal soft palate, average cross-sectional airway and total volume (p>0.05). Considering the AP and L relationship of the narrowest slice of the airway, the OSA patients presented a slightly less elliptical shape (AP/L=0.38±0.19; median=0.347) than the non-OSA subjects (AP/L=0.33±0.16; median=0.306), but no significant differences were found between groups.
Table 4.
Comparison of CBCT measurements between OSA and snorer groups.
| Parameter | OSA | Snorers | T-TEST |
|---|---|---|---|
| Mean ± SD (N=46) | Mean ± SD (N=34) | P-value | |
| Minimum Area (mm2) | 3.3 ± 42.7 Median=64.7 |
95.2 ± 42.3 Median=86.1 |
0.012‡ |
| AP (mm) | 5.5 ± 2.14 Median=5.04 |
5.9 ± 2.47 Median=5.45 |
0.586‡ |
| Lateral (mm) | 6.3 ± 5.61 | 18.9 ± 5.02 | 0.035 |
| Airway Length (mm) | 45.6 ± 4.97 | 44.9 ± 5.03 | 0.520 |
| Vertical Soft Palate (mm) | 35.2 ± 6.97 | 33.9± 5.96 | 0.377 |
| Horizontal Soft Palate (mm) | 23.0 ± 4.41 | 21.7 ± 4.41 | 0.183 |
| Volume (cm3) | 8.3 ± 3.59 | 8.9 ± 2.76 | 0.427 |
| Uniformity | 0.39 ± 0.14 | 0.48 ± 0.14 | 0.008 |
| Average Area (mm2) | 180.5 ± 74.0 | 195.5 ± 51.0 | 0.118 |
Wilcoxon Rank Sums test
The location of the smallest cross-section area was retropalatal in all subjects (above the tip of the uvula).
Berlin questionnaire as a screening tool for OSA
The Sensitivity, Specificity, Positive and Negative Predictive Values for the Berlin Questionnaire against ambulatory somnographic data (AHI ≥10) was 67.4%, 52.9%, 66.0% and 54.5%.
Predicting OSA with CBCT measurements and Berlin questionnaire
Stepwise linear regression analyses were performed with log(AHI) as the dependent variable. Explanatory variables included age, gender, BMI, neck circumference (common confounders for OSA and significantly different at baseline between groups), plus the CBCT variables (airway volume, min. area, airway length, AP, L, VSP, HSP, average cross-section, uniformity) and the Berlin Questionnaire. We performed a stepwise regression analysis and minimum Mallow’s “Cp” criteria. All variables left in the model were significant at the 0.10 level. Both regression analyses converged to a 4-variable model (Table 5). No other variable met the 0.15 significance criteria to enter the model. The R-square of this model was 0.57 and Cp = −0.72 [adjusted R-square was 0.54]. For comparison, the adjusted R-square of a simple model with age, gender and BMI was 0.33 [adjusted R-square=0.30]. Stepwise logistic regression analysis was carried out to assess the adjusted odds-ratios of all risk factors in the final model (Table 6) on OSA status. Age was categorized using median age (57 years old), as well as the lateral dimension (17 mm). Male gender, age ≥57 years, a positive Berlin Questionnaire and a lateral dimension < 17mm were predictive of OSA (Table 6).
Table 5.
Multiple linear regression analysis of the risk factors on the log(AHI).
| Risk factors | STEPWISE LINEAR REGRESSION MODEL § | |
|---|---|---|
| β | P-value | |
| Gender (female) | −1.32 | <.0001 |
| Age | 0.04 | <.0001 |
| BERLIN Questionnaire | 1.14 | <.0001 |
| Upper Airway Lateral dimension (mm) | −0.08 | <.0001 |
Multivariate ANOVA F-test p<0.0001, adjusted R square= 0.54, R-square=0.57.
Table 6.
Logistic stepwise regression analysis of the risk factors for OSA
| Risk factors | Adjusted OR | Chi-square p-value | [95% C.I.] |
|---|---|---|---|
| Male | 28.2 | .0001 | [5.0, 158] |
| Age ≥ 57 years | 7.5 | .002 | [2.1, 27.0] |
| Berlin Questionnaire (High risk) | 5.8 | .005 | [1.7, 19.8] |
| Upper Airway Lateral dimension < 17 mm | 3.9 | .028 | [1.2, 12.9] |
4. Discussion
Demographics
The goal of this study was to assess the differences in upper airway morphology between Obstructive Sleep Apnea adult patients and snorers. The imaging device chosen for this research is a low radiation dental cone-beam CT which is becoming very popular in dental offices for dental implant assessment, orthodontic treatment and planning, and temporomandibular joint diagnosis. The two groups of subjects were recruited in the same fashion by mail, flyers and oral communication at a private dental office and the University of Southern California School of Dentistry. Every subject who qualified was recruited regardless of their race, gender, age or BMI. The final classification of their OSA status was based on a standard medical classification (AHI≥ 10/hr) based on ambulatory somnographic assessment independent of the investigator by a blinded sleep expert, so we do not expect any investigator bias. The imaging data are quantitative measurements performed by one blinded operator so no bias is anticipated except measurement bias. Because the Intraclass Correlation Coefficient was high, the measurement bias is expected to be low. Cases and snorers were unmatched by age, gender and BMI as in most of prior studies.20,21 The only large case-control study had patients matched by gender and race, but not age or BMI.9 Cases were mostly males as expected with prevalence of OSA at least double in males than females.1 Cases were 7 years older than snorers which is not ideal but consistent with prior studies by Mayer et al. 21 (cases 5 years older than snorers) and Okubo et al.20 (12 years older). Cases had a larger BMI than snorers by 2.57 kg/m2 similar to Mayer et al. (3 kg/m2). That is much better than the study by Schwab who had a BMI difference of 10 kg/m2. Sample size was relatively large compared to prior studies except Mayer’s and Schwab’s but those used MRI as the imaging modality. In this study there were no significant differences in race or ethnicity between the two groups with a large majority of our subjects White and non Hispanic.
CBCT Imaging
This is to our knowledge the first study with a large sample size comparing OSA upper airway morphology and snorers with CBCT. Snoring and obstructive sleep apnoea (OSA) are usually worse or may only occur in the supine position. The Newtom which is the only commercially available CBCT that images patients in supine position is ideal for this study, as airway in supine position indeed is different from standing or seated positions,22,23,24 and studying snorers and OSA patients in supine position is much preferred than standing or seated positions that are used in most CBCT machines. CBCT has the double advantage compared to MRI that it is accessible and cheap, however there is radiation involved though lower than medical CT.25 CT and CBCT provide better bony tissues delineation compared to MRI, and the latter provides better soft tissue contrast.
In preliminary results with only 10 cases and 10 snorers we had found a negative significant correlation between BMI and the minimum cross-section area, and BMI and lateral dimension. This result has been corroborated in this larger sample with a significant correlation between BMI and lateral dimension of the airway (r= −.57, p=<.0001). This is consistent with Welch’s study, where after following a weight loss program the lateral dimension increased significantly from 6.8mm to 10.4mm.26 We also found a significant correlation between BMI and minimum cross-section (r= −.32, p=.038) in OSA cases but not in snorers which is consistent with Schwab’s study (r= −0.53; p=.06), and Cosentini’s study (r= −.36; P=.05). 9,27
In this study the cases had a slightly more spherical airway shape than snorers (AP/L=0.38 in cases compared to 0.33 in snorers), which follows the trend in Mayer’s study with 0.41 in cases and 0.39 in snorers for subjects with BMI<27 kg/m2. Cases also had a narrower lateral dimension compared to snorers. This is consistent with Hora et al. 28 who found in awake patients using MRI that the transversal (lateral) dimension of the airway at the retroglossal level was an independent predictor of OSAs, and this lateral narrowing of the airway was not associated with increased fat pad thickness. The authors conclude that the narrowing of the lateral airway is due to parapharyngeal muscular hypertrophy not the accumulation of fat. Concerning the smaller cross-sectional area found in cases compared to snorers, this is consistent with Schwab’s study were cases had two times smaller cross-sectional area than non-apneic patients.29 Finally, the airway was significantly less uniform in OSA patients (defined as the minimum cross-sectional area divided by the average area).
Predicting OSA
One of our goals is to predict OSA based on imaging and the Berlin Questionnaire. In conclusion, the final model included age, gender, the Berlin questionnaire score and the lateral dimension of the airway. This model explained 57% of the variability of the severity of OSA [log(AHI)]. After dichotomization of the 4 variables in the final model using the median as the cut-off point we conclude that in this study a male was 28 times more likely to have OSA than a female; subjects older than 57 years old were 7.5 times more likely to have the disease than younger subjects; a subject having a “high risk” score at the Berlin questionnaire was 5.8 times more likely to have OSA than a subject with low risk, and a subject with an upper airway lateral dimension of the cross-sectional airway less than 17 mm was 3.9 times more likely to have OSA. Epidemiological evidence shows that middle-aged men are more likely than middle-aged women to develop sleep apnea. In most population-based studies that have estimated sex-specific prevalence, a 2- to 3-fold greater risk for men compared with women has been reported.30 Epidemiological clinic-based studies do often show a large difference in the prevalence of OSA between genders, compared to community-based studies.1,31 This might be due to the limitations of clinic-based studies discussed below and might explain the large odds-ratio found in this study. Therefore our results have to be confirmed in a large community-based study. On the other hand, Bixler’s large study shows that the prevalence of sleep apnea tends to increase with age and that confirms our findings.32 The adjusted odds-ratio for a “high risk” subject to develop OSA is 5.8 time which is similar to Netzer’s data14 showing that the unadjusted odds ratio for an RDI>30 given high-risk status is 5.37. The fact that a subject with a narrow lateral dimension was 3.9 times more likely to have OSA makes sense as prior studies have found a narrowing of the airway due to thickening of the lateral pharyngeal walls during sleep in normal subjects,11 as well as a significant increased risk of sleep apnea the larger the lateral pharyngeal walls.10 Lateral narrowing of the airway is also associated with lateral hypertrophy of the lateral tonsils.
Prediction for OSA based on this 4-variable model could be implemented in a large community-based prospective study to confirm these findings. The reader is referred to the limitations section for a discussion on possible biases affecting this study, and the conclusion section for a final summary of the findings.
Limitations
Though there were no significant differences in race or ethnicity between the two groups and all races and ethnicities were welcomed, most of the subjects enrolled were White non-hispanic, so the results in this paper might not be generalized to other races or ethnicities, or to patients younger than 32 or older than 80 year’s old.
Only Dr Clark’s patients or faculty/staff/students at USC participated in this study as opposed to the general population for OSA cases and snorers.
Measurement bias: Because the results are based on self-report and this is a case-control study, there is a potential for recall bias of the exposure (Berlin Questionnaire). Cases may be more likely to recall and report snoring loudness, apneas or high-blood pressure than snorers, because they might think more about their sleep quality and sleep patterns. This could result in positive bias. Because only one blinded interviewer conducted all interviews we do not expect observer bias for the Berlin questionnaire. The operator performing the CBCT measurements and the sleep expert creating the sleep report were blinded to outcome status, so we do not expect observer bias in those measurements.
Selection bias. This study may suffer of selection bias as the subjects were recruited through mail and flyers. Persons with a specific combination of exposure (family history or craniofacial anomalies) and outcome (sleep apnea) may self-select themselves to participate in a case-control study. It could create bias if those who participated were different from those that did not in terms of exposures analyzed in the study.
Conclusions
The goal of this study was to compare the Cone-Beam Computerized Tomography (CBCT) scan measurements between patients with OSA and snorers to predict OSA in the future based on imaging and the Berlin Questionnaire. Age>57 years, male gender, a “high risk” Berlin Questionnaire and narrow upper airway lateral dimension (<17mm) were identified as significant risk factors for OSA. The results of this study indicate that 3-dimensional CBCT airway analysis could be used as a tool to assess the presence and severity of OSA. The presence and severity (as measured by the AHI) of OSA is associated with a narrow lateral dimension of the airway, increasing age, male gender, and the Berlin questionnaire.
Acknowledgments
Source of funding: This research was partially funded by the University of Southern California and the NIDCR grant # K25 DE016391.
Footnotes
Publisher's Disclaimer: This is a PDF file of an unedited manuscript that has been accepted for publication. As a service to our customers we are providing this early version of the manuscript. The manuscript will undergo copyediting, typesetting, and review of the resulting proof before it is published in its final citable form. Please note that during the production process errors may be discovered which could affect the content, and all legal disclaimers that apply to the journal pertain.
References
- 1.Young T, Palta M, Dempsey J, Skatrud J, Weber S, Badr S. The occurrence of sleep-disordered breathing among middle-aged adults. N Engl J Med. 1993;328:1230–5. doi: 10.1056/NEJM199304293281704. [DOI] [PubMed] [Google Scholar]
- 2.Young T, Finn L, Peppard PE, Szklo-Coxe M, Austin D, Nieto FJ, Stubbs R, Hla KM. Sleep disordered breathing and mortality: eighteen-year follow-up of the Wisconsin sleep cohort. Sleep. 2008 Aug 1;31(8):1071–8. [PMC free article] [PubMed] [Google Scholar]
- 3.Schwab RJ. Upper airway imaging. Clin Chest Med. 1998;19:33–54. doi: 10.1016/s0272-5231(05)70430-5. [DOI] [PubMed] [Google Scholar]
- 4.Miles PG, Vig PS, Weyant RJ, Forrest TD, Rockette HE., Jr Craniofacial structure and obstructive sleep apnea syndrome: a qualitative analysis and meta-analysis of the literature. Am J Orthod Dentofacial Orthop. 1996;109:163–172. doi: 10.1016/s0889-5406(96)70177-4. [DOI] [PubMed] [Google Scholar]
- 5.Aboudara C, Nielsen I, Huang JC, Maki K, Miller AJ, Hatcher D. Comparison of airway space with conventional lateral headfilms and 3-dimensional reconstruction from cone-beam computed tomography. Am J Orthod Dentofacial Orthop. 2009;135(4):468–479. doi: 10.1016/j.ajodo.2007.04.043. [DOI] [PubMed] [Google Scholar]
- 6.Bradley TD, Brown IG, Grossman RF, Zamel N, Martinez D, Phillipson EA, Hoffstein V. Pharyngeal size in snorers, nonsnorers, and patients with obstructive sleep apnea. N Engl J Med. 1986;315:1327–1331. doi: 10.1056/NEJM198611203152105. [DOI] [PubMed] [Google Scholar]
- 7.Haponik EF, Smith PL, Bohlman ME, Allen RP, Goldman SM, Bleecker ER. Computerized tomography in obstructive sleep apnea: correlation of airway size with physiology during sleep and wakefulness. Am Rev Respir Dis. 1983;127:221–226. doi: 10.1164/arrd.1983.127.2.221. [DOI] [PubMed] [Google Scholar]
- 8.Sforza E, Bacon W, Weiss T, Thibault A, Petiau C, Krieger J. Upper airway collapsibility and cephalometric variables in patients with obstructive sleep apnea. Am J Respir Crit Care Med. 2000;161:347–352. doi: 10.1164/ajrccm.161.2.9810091. [DOI] [PubMed] [Google Scholar]
- 9.Schwab RJ, Gupta KB, Gefter WB, Metzger LJ, Hoffman EA, Pack AI. Upper airway and soft tissue anatomy in normal subjects and patients with sleep-disordered breathing. Significance of the lateral pharyngeal walls. Am J Respir Crit Care Med. 1995;152(5):1673–89. doi: 10.1164/ajrccm.152.5.7582313. [DOI] [PubMed] [Google Scholar]
- 10.Schwab RJ, Pasirstein M, Pierson R, Mackley A, Hachadoorian R, Arens R, Maislin G, Pack AI. Identification of Upper Airway Anatomic Risk Factors for Obstructive Sleep Apnea with Volumetric Magnetic Resonance Imaging. Am J Respir Crit Care Med. 2003;168:522–530. doi: 10.1164/rccm.200208-866OC. [DOI] [PubMed] [Google Scholar]
- 11.Trudo FJ, Gefter WB, Welch KC, Gupta KB, Maislin G, Schwab RJ. State-related changes in upper airway caliber ans surrounding soft-tissue structures in normal subjects. Am J respire Care Med. 1998;158:1259–1270. doi: 10.1164/ajrccm.158.4.9712063. [DOI] [PubMed] [Google Scholar]
- 12.Chen NH, Li KK, Li S-Y, Wong C-R, Chuang M-L, Hwang C-C, Wu Y-K. Airway Assessment by Volumetric Computed Tomography in Snorers and Subjects With Obstructive Sleep Apnea in a Far-East Asian Population (Chinese) The Laryngoscope. 2002;112:721–726. doi: 10.1097/00005537-200204000-00023. [DOI] [PubMed] [Google Scholar]
- 13.Ogawa T, Enciso R, Shintaku WH, Clark GT. Evaluation of cross-section airway configuration of obstructive sleep apnea. Oral Surg Oral Med Oral Pathol Oral Radiol Endod. 2007 Jan;103(1):102–8. doi: 10.1016/j.tripleo.2006.06.008. [DOI] [PMC free article] [PubMed] [Google Scholar]
- 14.Netzer NC, Hoegel JJ, Loube DD, Netzer CM, Hay B, Alvarez-Sala R, Strohl KP. Prevalence of Symptoms and Risk of Sleep Apnea in Primary Care. Chest. 2003 October 1;124(4):1406–1414. doi: 10.1378/chest.124.4.1406. [DOI] [PubMed] [Google Scholar]
- 15.Fleetham JA. Upper airway imaging in relation to obstructive sleep apnea. Clin Chest Med. 1992 Sep;13(3):399–416. [PubMed] [Google Scholar]
- 16.Ludlow JB, Ivanovic M. Comparative Dosimetry of Dental CBCT Devices and 4 row CT for Oral and Maxillofacial Radiology. Oral Surg Oral Med Oral Pathol Oral Radiol Endodont. 2008;106:930–938. doi: 10.1016/j.tripleo.2008.03.018. [DOI] [PubMed] [Google Scholar]
- 17.Ayappa I, Norman RG, Seelall V, Rapoport DM. Validation of a self-applied unattended monitor for sleep disordered breathing. J Clin Sleep Med. 2008;4:26–37. [PMC free article] [PubMed] [Google Scholar]
- 18.Westbrook PR, Levendowski DJ, Cvetinovic M, Zavora T, Velimirovic V, Henninger D, Nicholson D. Description and validation of the Apnea Risk Evaluation System: A novel method to diagnose sleep apnea-hypopnea in the home. Chest. 2005;128:2166–2175. doi: 10.1378/chest.128.4.2166. [DOI] [PubMed] [Google Scholar]
- 19.Netzer NC, Stoohs RA, Netzer CM, et al. Using the Berlin Questionnaire to identify patients at risk for the sleep apnea syndrome. Ann Intern Med. 1999;131:485–491. doi: 10.7326/0003-4819-131-7-199910050-00002. [DOI] [PubMed] [Google Scholar]
- 20.Okubo M, Suzuki M, Horiuchi A, Okabe S, Ikeda K, Higano S, Mitani H, Hida W, Kobayashi T, Sugawara J. Morphologic analyses of mandible and upper airway soft tissue by MRI of patients with obstructive sleep apnea hypopnea syndrome. Sleep. 2006;29(7):909–15. doi: 10.1093/sleep/29.7.909. [DOI] [PubMed] [Google Scholar]
- 21.Mayer P, Pepin JL, Bettega G, Veale D, Ferretti G, Deschaux C, Levy P. Relationship between body mass index, age and upper airway measurements in snorers and sleep apnoea patients. Eur Respir J. 1996 Sep;9:1801–1809. doi: 10.1183/09031936.96.09091801. [DOI] [PubMed] [Google Scholar]
- 22.Tsuiki S, Almeida FR, Lowe AA, Su J, Fleetham JA. The interaction between changes in upright mandibular position and supine airway size in patients with obstructive sleep apnea. Am J Orthod Dentofacial Orthop. 2005;128(4):504–512. doi: 10.1016/j.ajodo.2004.03.040. [DOI] [PubMed] [Google Scholar]
- 23.Tsuiki S, Almeida FR, Bhalla PS, Lowe AA, Fleetham JA. Supine-dependent changes in upper airway size in awake obstructive sleep apnea patients. Sleep Breath. 2003 Mar;7(1):43–50. doi: 10.1007/s11325-003-0043-6. [DOI] [PubMed] [Google Scholar]
- 24.Pae EK, Lowe AA, Sasaki K, Price C, Tsuchiya M, Fleetham JA. A cephalometric and electromyographic study of upper airway structures in the upright and supine positions. Am J Orthod Dentofacial Orthop. 1994 Jul;106(1):52–9. doi: 10.1016/S0889-5406(94)70021-4. [DOI] [PubMed] [Google Scholar]
- 25.Mah J, Danforth RA, Bumann A, Hatcher DA. Radiation absorbed in maxillofacial imaging with a new dental CT. Oral Surg Oral Med Oral Pathol Oral Radiol Endod. 2003;96(4):508–513. doi: 10.1016/s1079-2104(03)00350-0. [DOI] [PubMed] [Google Scholar]
- 26.Welch KC, Foster GD, Ritter CT, Wadden TA, Arens R, Maislin G, Schwab RJ. A novel volumetric magnetic resonance imaging paradigm to study upper airway anatomy. Sleep. 2002;25(5):532–42. [PubMed] [Google Scholar]
- 27.Consentini T, Le Donne R, Mancini D, Colavita N. Magnetic Resonance Imaging of the upper airway in obstructive sleep apnea. Radiol Med. 2004;108:404–416. [PubMed] [Google Scholar]
- 28.Hora F, Napolis LM, Daltro C, Kodaira SK, Tufik S, Togeiro AM, Nery LE. Clinical, Anthropometric and Upper Airway Anatomic Characteristics of Obese Patients with Obstructive Sleep Apnea Syndrome. Respiration. 2007;74:517–524. doi: 10.1159/000097790. [DOI] [PubMed] [Google Scholar]
- 29.Schwab RJ, Gefter WB, Hoffman EA, Gupta KB, Pack AI. Dynamic upper airway imaging during awake respiration in normal subjects and patients with sleep disordered breathing. Am Rev Respir Dis. 1993 Nov;148(5):1385–400. doi: 10.1164/ajrccm/148.5.1385. [DOI] [PubMed] [Google Scholar]
- 30.Strohl K, Redline S. Recognition of obstructive sleep apnea. Am J Respir Crit Care Med. 1996;154:274–289. doi: 10.1164/ajrccm.154.2.8756795. [DOI] [PubMed] [Google Scholar]
- 31.Bixler EO, Vgontzas AN, Lin HM, Have TT, Rein J, Vela-Bueno A, Kales A. Prevalence of sleep-disordered breathing in women: effects of gender. Am J Respir Crit Care Med. 2001;163(3 Pt 1):608–13. doi: 10.1164/ajrccm.163.3.9911064. [DOI] [PubMed] [Google Scholar]
- 32.Bixler EO, Vgontzas AN, Have TT, Thyson K, Kales A. Effects of Age on Sleep Apnea in Men. I. Prevalence and Severity. Am J Respir Crit Care Med. 157:144–148. doi: 10.1164/ajrccm.157.1.9706079. [DOI] [PubMed] [Google Scholar]