Abstract
The small size, high heart rate, and small tissue displacement of a mouse require small sensors that are capable of high spatial and temporal tissue displacement resolutions and multichannel data acquisition systems with high sampling rates for simultaneous measurement of high fidelity signals. We developed and evaluated an ultrasound-based mouse vascular research system (MVRS) that can be used to characterize vascular physiology in normal, transgenic, surgically altered, and disease models of mice. The system consists of multiple 10/20MHz ultrasound transducers, analog electronics for Doppler displacement and velocity measurement, signal acquisition and processing electronics, and personal computer based software for real-time and offline analysis. In-vitro testing of the system showed that it is capable of measuring tissue displacement as low as 0.1 µm and tissue velocity (µm/s) starting from 0. The system can measure blood velocities up to 9 m/s (with 10 MHz Doppler at a PRF of 125 kHz) and has a temporal resolution of 0.1 milliseconds. Ex-vivo tracking of an excised mouse carotid artery wall using our Doppler technique and a video pixel tracking technique showed high correlation (R2=0.99). The system can be used to measure diameter changes, augmentation index, impedance spectra, pulse wave velocity, characteristic impedance, forward and backward waves, reflection coefficients, coronary flow reserve, and cardiac motion in murine models. The system will facilitate the study of mouse vascular mechanics and arterial abnormalities resulting in significant impact on the evaluation and screening of vascular disease in mice.
Keywords: Multi-channel high-frequency pulsed Doppler, Doppler displacement, Mouse vascular mechanics, Pulse wave velocity, Arterial wall motion
INTRODUCTION
Many cardiovascular diseases, such as hypertension and atherosclerosis, or aging cause alterations in vascular impedance, producing changes in the magnitude and shape of pressure and flow waveforms (Nichols and O'Rourke 1998). In man and other mammals, the changes in peripheral vascular resistance and compliance cause measurable alterations in arterial pulse wave velocity (PWV) and pulse pressure (Lakatta et al. 1987), arterial diameter pulsations (Jeremy et al. 1994), and flow pulsatility and resistance indices (Skidmore et al. 1980). Others have reported changes in velocity profiles (Tortoli et al. 2003), flow disturbances (Talukder et al. 1986), turbulence (Giddens and Khalifa 1982), impedance spectra and vorticity (Nichols and O'Rourke 1998), and the magnitude and timing of peripheral wave reflections (Latham et al. 1985, Pythoud et al. 1996). Often the extent of these changes correlates with the extent of the disease. Many of these vascular indices such as PWV and impedance spectra have been used in the evaluation of vascular disease in man (Avolio et al. 1985Arnet et al. 1994, Nichols and O'Rourke 1998) and also in the study of disease models in animals (Kingwell 2002). In evaluating stroke, renal failure, and heart disease in patients, factors like pulse pressure (Domanski et al. 2001), PWV (Laurent et al. 2001) and augmentation index (Hayashi et al. 2002) have greater predictive value on undesirable outcomes than mean blood pressure alone. This relationship is not modified by age, diabetes, etc (Avolio et al. 1985). Genetic models of mice manifest abnormalities that resemble human vascular diseases and have the potential to contribute greatly to the understanding of these diseases and to the development of methods for both diagnosis and treatment with drugs or gene therapy. Therefore the ability to accurately and non-invasively measure large artery stiffness and impedance will be important in characterizing and utilizing mouse models of human cardiovascular diseases.
Traditionally, in physiologic studies involving large animals, investigators have relied on invasive and chronically implanted sensors to evaluate vascular pressure, flow, and dimensions in intact animals (Hartley et al. 1978). Despite size limitations, some of these methods have been adapted and are being used in mice. The devices used include telemetry of ECG, body temperature, and arterial pressure (Data Sciences International; Mitchell et al. 1998, Butz and Davisson 2001), fluid-filled and micromanometer-tipped catheters for pressure sensing (Millar Instruments; Lorenz and Robbins 1996), cardiac pressure-volume catheters (Millar Instruments; Georgakopoulos et al. 1998) and implantable blood flow sensors (Transonics Systems; Gao et al. 2001). However these methods are invasive and cause major perturbations to the systems under study and are difficult and expensive to use and maintain in mice (Hartley et al. 2002). Nevertheless, these small sensors provide calibrated waveforms with which to validate the newer and less invasive methods such as those we describe here, and the telemetry systems provide a baseline with which to judge the effects of activity, restraint, sedation, and anesthesia. While significant improvements have been made in evaluating cardiac function (Collins et al. 2003), little has been done to facilitate vascular measurements in mice. A recent study emphasizes that noninvasive measurement of luminal diameter in a mouse model of abdominal aortic aneurysms is essential to longitudinal monitoring of disease progression (Martin-McNulty et al. 2005).
In the past decade we have developed and used several noninvasive methods to study cardiovascular function in intact anesthetized mice. These include pulsed Doppler methods for measuring arterial blood flow velocity (Hartley et al. 1995, 2002, Taffet et al. 1996, Li et al. 2003, Reddy et al. 2005b), aortic PWV (Hartley et al. 1997, 2000, 2002), and tail cuff methods for measuring systolic and diastolic pressure (Reddy et al. 2003a) in mice. Our existing real-time Doppler signal processing system (DSPW, Indus Instruments Houston, TX; Reddy et al. 2005a) can digitize and process only one set of Doppler audio signals. This limits the accuracy of the measurement of PWV using non-simultaneous R-wave timing especially when PWV is changing during the time required to record waveforms at the two sites (Hartley et al. 1997). Thus calculation of pulse wave velocity requires measurement of velocity signals from 2 arterial sites preferably at the same time. Calculation of impedance spectra requires simultaneous measurement of velocity and pressure (or vessel diameter) signals, and calculation of vessel pulsations requires simultaneous measurement of near and far wall signals. Because DSPW has poor Doppler frequency (velocity) resolution at low frequencies, we cannot measure vessel wall motion and dimensions or acquire flow velocities simultaneously from multiple vessels in mice. In response to these needs, we developed a high-speed high-resolution real-time multi-channel Doppler signal processing system (mouse vascular research system or MVRS) that can do spectral processing of Doppler flow velocity signals and arctangent processing of Doppler arterial wall motion signals measured from multiple sites and can display them along with other physiological signals (blood pressure, respiration and ECG) simultaneously. In this report we discuss validations both in phantoms and in-vivo, calibrations, resolutions achieved, and some examples of potential applications.
METHODS
The multi-channel Doppler signal processing system
The hardware and software components that make up MVRS are the mouse data acquisition system (MDAQ; DSP200, Indus Instruments, Houston, TX) and PC based real-time Doppler signal processing software (DPROC; MVRS-AQ1.1, Indus Instruments, Houston, TX), respectively. The MDAQ is capable of simultaneously acquiring 8 channels of high resolution signals (16 bits) at high speed (up to 200 kiloSamples/second per channel) and transferring it to a personal computer through a Universal Serial Bus (USB) interface in real-time (Fig. 1). Typically, we use a sampling rate of 125 kiloSamples/second (kS/s). Each channel of the MDAQ is configurable under PC software control such that the incoming signals can be AC-coupled or DC-coupled (and can be low-pass filtered with 16 selectable cutoff frequency settings from 10 kHz through 150 kHz in steps of 10 kHz). Typically, a pair of channels would be DC coupled and 10 kHz low-pass filtered for recording inphase and quadrature (I/Q) displacement signals, while another pair would be AC coupled and low-pass filtered for recording blood velocity signals. The MDAQ can handle any combination of I/Q-signal pairs and other hemodynamic signals (ECG, respiration, blood pressure, etc) up to a total of 8 channels.
Fig. 1.
Schematic of USB based data acquisition hardware of the mouse vascular research system (MDAQ).
The DPROC program (written in Visual C++ and run on MS Windows XP/Vista operating systems) controls, processes and analyzes the data acquired by MDAQ hardware in real-time and simultaneously displays multiple processed data streams that include Doppler spectrograms (from the I/Q blood velocity signal pair), Doppler displacement plots (from the I/Q tissue displacement signal pair), and plots (from ECG and other signals). The DPROC performs the spectral analysis of the Doppler I/Q pair and detection of the maximum frequency envelope to determine peak blood flow velocity (Reddy et al. 2005a). Briefly, I and Q samples of the data are selected as per the user’s fast Fourier transform (FFT) sample size (64–1024 samples) setting. The FFT is calculated based upon the pre-set sweep speed (0.1 ms at 10 pixels/ms - 10 ms at 0.1 pixel/ms) to obtain a spectral estimate of each set of I and Q samples. The display of the velocity spectrogram is optimized by adjusting the gain, contrast, and noise levels using the concept of histogram equalization for image enhancement (Gonzalez and Woods 1992) prior to the calculation of the maximum frequency envelope. The maximum frequency envelope of the spectrum is then calculated using the percentile method (Evans and McDicken 2000) by choosing the frequency below which 95% of the total power in each spectrum lies. The envelope is calculated every 0.1 ms and smoothed using a 41-point sinc function (sinθ/θ) thereby having the effect of subjecting the maximum frequency envelope to a non-causal low-pass filter with a cutoff frequency of about 244 Hz. Arctangent processing of Doppler vessel wall displacement signals is described elsewhere (Hartley et al. 2004). The technique for sensing vessel wall motion in mice was adapted from tissue Doppler, and the principle of operation is that the phase of an echo (φ) is related to the target distance (d) by φ=4πd/λ, where φ=arctan(Q/I) and λ is the wavelength (λ = c/fo = 78 µm at an ultrasonic frequency fo = 20MHz with a speed of sound (c) = 1560 m/s). The DPROC also shows a vector plot in the same window along with the displacement plot. The time vector plot is very useful when collecting data since it acts as a quality indicator of displacement signals being acquired. The DPROC software can store and retrieve data files for offline analysis and allows for the export of either raw or analyzed data via text files which can be imported into other data analysis programs (such as MS Excel).
Analog instrumentation
The analog instrumentation used to obtain various signals from mice is described in detail elsewhere (Li et al. 2003, Reddy et al. 2005b). In brief, the 10 and 20 MHz Doppler probes used in this study were custom-built by us. Each probe has 1.0 mm (20 MHz) or 1.5 mm (10 MHz) square of piezoelectric material (PZT-5A) mounted inside and flush with the end of a 2.25 mm diameter 10 cm long piece of stainless steel tubing. The crystal material is air-backed with styrofoam and an epoxy lens is molded to the front face to focus the sound beam at 4 mm (sphere radius 1.6 mm for 20 MHz) or 6 mm (sphere radius 2.4 mm for 10 MHz). The probes are driven by a modular ultrasonic pulsed Doppler instrument which can operate multiple Doppler channels simultaneously at 10 or 20 MHz (Hartley et al. 2002). For these studies, we used a pulse repetition frequency (PRF) of 62.5 kHz when using the 10 MHz probe and a PRF of 125 kHz when using the 20 MHz probe to measure blood flow velocities. Displacement signals were measured using 20 MHz probes. The Doppler I/Q wall motion signals were processed in software using the phase of an echo (arctangent[Q/I]) (Hartley et al. 2004) and also using an analog zero-crossing counter (Hartley et al. 1997). Pressure signals were measured using a modified RADI PressureWire3 (Radi Medical Systems, Uppsala, Sweden) and pressure amplifiers with 2 kHz bandwidth (Reddy et al. 2003b). A custom built differential amplifier with frequency response of 0.1 to 2 kHz and a four-electrode ECG/heater board were used to obtain mouse ECG signals (Hartley et al. 2002).
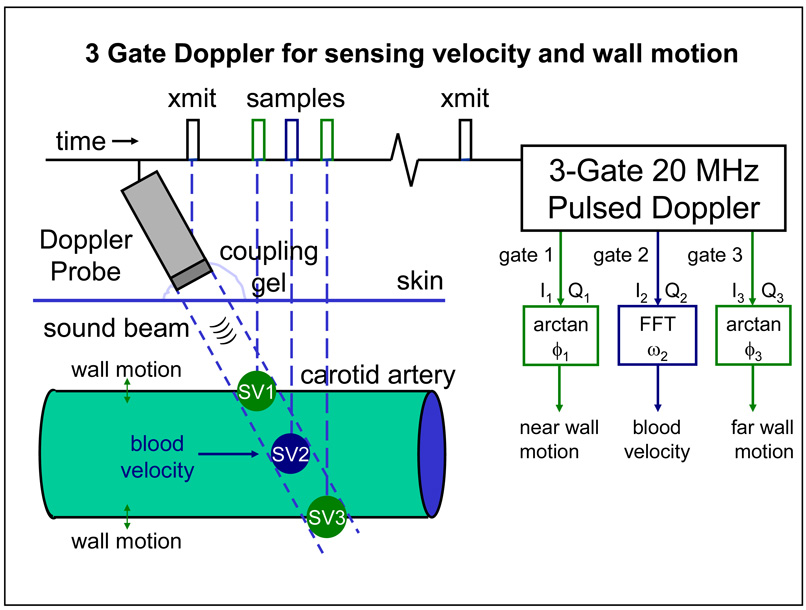
We developed and used a 3-gate module in which we shortened the burst length from 8 to 2 or 4 cycles to shorten the sample volume, and DC coupled the I and Q Doppler signals (removed all wall filters) from each gate. The multi-gate modules were developed by our group for use in large animals (Hartley et al. 1978) and were modified for use in mice (Hartley et al. 2004). The 3-gate module allows us to use 3 probes to track the near and far wall of a given artery along with the blood velocity measurement in the lumen. As shown in Fig. 2, the three gates are in a packet with the overall delay controlled by the center gate and the spacing between the center and the proximal and distal gates each controlled individually. It was envisioned that the center gate would be positioned to sense blood velocity in the center of a vessel and the other two gates would then be positioned earlier and later over the near and far vessel walls. With the probe at 60 degrees to the vessel, qualitative signals can be obtained from the vessel wall(s) and from blood flow using a single probe as shown.
Fig. 2.
Principle of operation of a three-gate 20 MHz pulsed Doppler for sensing blood velocity and wall motion.
In-vitro validation of Doppler displacement resolution using phantom
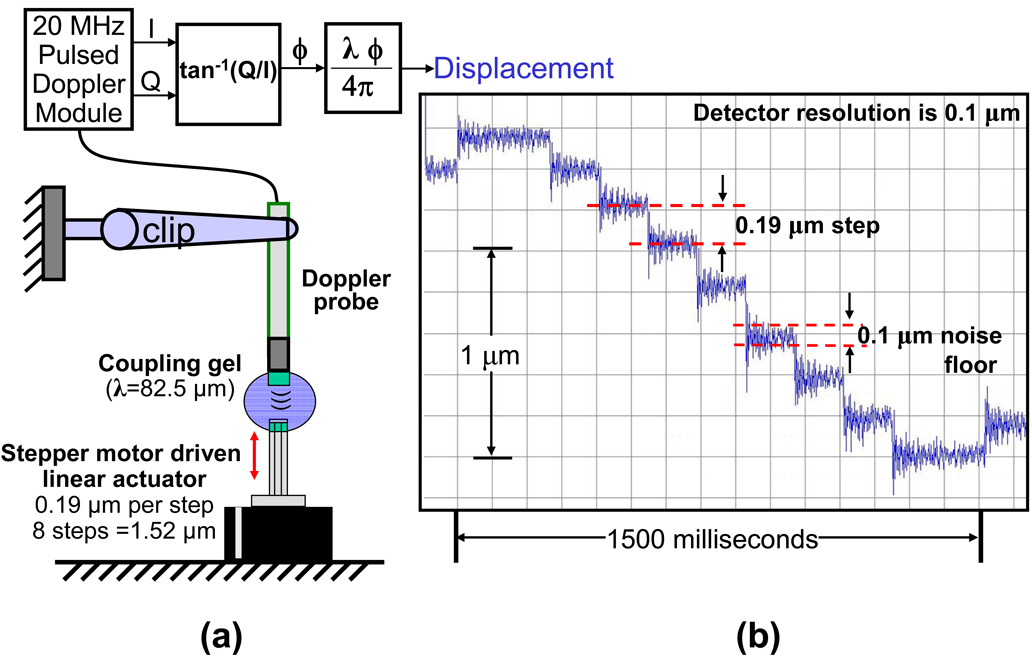
The resolution of the Doppler displacement detector was validated using a stepper motor driven linear actuator (Series 43000 Hybrid Linear Actuator model 43K4U-05-905ENG, Haydon Switch & Instrument Inc. Waterbury, CT) with a resolution of 1.524 microns (0.00006 inches) per step. By operating this actuator in a micro-stepping mode with 8 microsteps per full step it is possible to control the mechanical movement with a resolution of 0.19 microns (1.524/8). The actuator and a 20 MHz ultrasound transducer clamped to a stand were placed on a vibration free platform (Optical Bench Plate, Edmund Optics, Barrington, NJ) such that ultrasound from the transducer would travel along the axis of motion a few mm and reflect back from the flat end of the actuator as shown in Fig. 3a. Ultrasonic coupling gel (Aquasonic 100, Parker Laboratories, Inc., Fairfield, NJ) was suspended between the transducer and actuator. The transducer was operated by a 20 MHz Doppler displacement module and Doppler I and Q signals were acquired by the MDAQ data acquisition system and processed by the DPROC software.
Fig. 3.
In-vitro validation of Doppler displacement resolution using phantom; (a) setup for validation and (b) displacement plot.
In-vitro validation of minimum target distance for dual displacement detection using a phantom
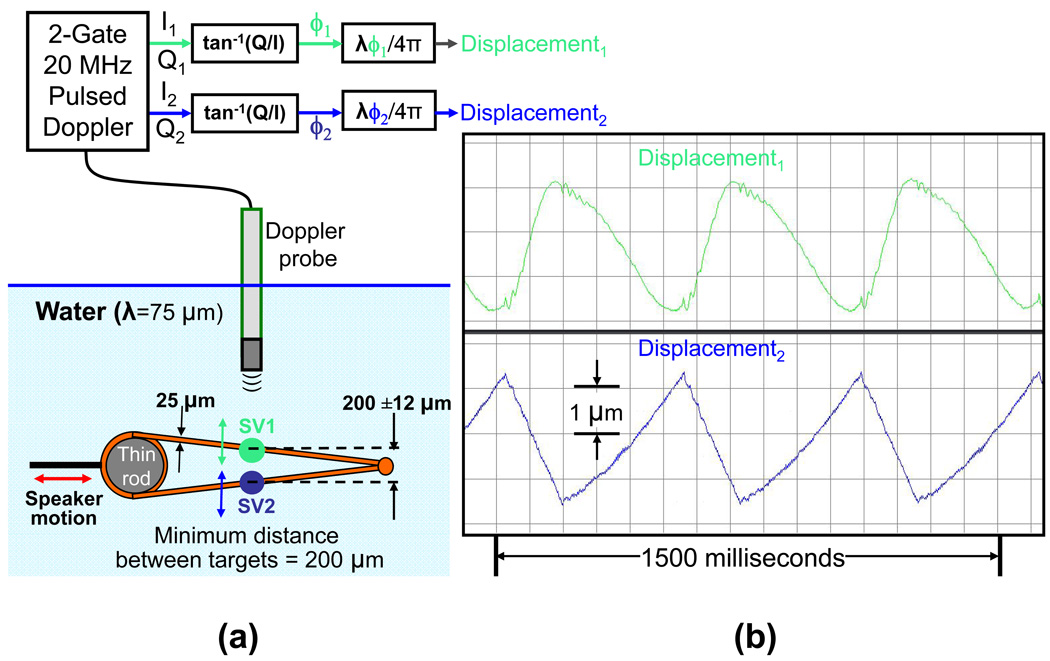
The multi-gate Doppler displacement detection technique is intended to capture the motion of the near and far walls of mouse arteries which are typically only a few hundred microns (µm) in diameter. The ability to detect motion independently from two very closely spaced targets is hence critical. We validated this in-vitro by constructing a speaker driven phantom consisting of two closely spaced metal strings at an incline (Fig. 4a). This phantom was then submerged in water. By choosing an appropriate location on the incline it is possible to have the strings 200 µm apart. By driving the speaker with a triangular wave and aiming the ultrasound probe perpendicular to the speaker motion it is possible to obtain displacement signals from the near string and far string which are moving in opposition. The transducer is driven using a dual gate Doppler displacement module and gate 1 is adjusted such that the corresponding sample volume is positioned over the near string and gate 2 is adjusted such that its sample volume (170 µm at 3 dB down from the peak (½ power point)) (Hartley et al. 2004) is positioned over the far string. The Doppler I/Q signal pairs are acquired and processed to produce the displacement.
Fig. 4.
In-vitro validation of minimum target distance for dual displacement detection using a phantom; (a) setup for validation and (b) Doppler tracking of dual displacement.
Ex-vivo validation using excised mouse carotid artery
Mice used in the ex-vivo validation study done at Texas A&M University were cared for by the Texas A&M University Laboratory Animals Resources and Research program and their use was approved by the University Lab Animal Care Committee. The mouse was anesthetized with 0.07 ml sodium pentobarbital (diluted with 0.25 ml saline) injected intraperitoneally. Aseptic surgery was performed to excise the left carotid artery and clean it of all foreign tissue from the blood vessel’s adventitia while removing trapped blood from the lumen. The vessel was stored overnight in an incubator placed in a solution of Advanced Dulbecco’s Modified Eagle’s Media supplemented with 2% fetal bovine serum (sADMEM), 1% penicillin streptomycin (P/S-Invitrogen, Inc.), and 2% L-glutamine. Then the vessel was firmly mounted to two custom designed L-shaped glass cannula using braided 6-0 suture and placed in the test rig. Using stepper motors (Newport Corp. CMA 12-CCCL) and ESP6000 motion board the test rig adjusted the length of the vessel to a nearly in-vivo stretch, conservatively found to be λz=1.85 (axial stretch = mean loaded axial length / the initial unloaded diameter) for C57 mice (Gleason et al. 2004). Two independent flow loops provided fluid to the vessel while maintaining aseptic conditions. The adventitial loop, filled with saline solution to improve image contrast, was pumped through the test chamber on the outer side of the vessel via a digital roller pump (model# A-07550-50, Cole-Parmer Instrument Company, Vernon Hills, IL) with cartridge head (model# U-07519-20, Cole-Parmer Instrument Company, Vernon Hills, IL) and 125 ml Erlenmeyer flask reservoir. Similarly, the luminal loop provided a constant flow of 1 ml/min of the sADMEM via the roller pump to the inside of the blood vessel at a controlled pressure.
The imaging system used for ex-vivo validation is described by Gleason et al. (2004). Briefly, the mean pressure in the vessel was maintained using an Alicat Scientific pressure controller (Model PC-5PSIG-D/BP, Alicat Scientific, Inc., Tucson, AZ) while a separate variable speed peristaltic pump (model# U-07554-80, Cole-Parmer Instrument Company, Vernon Hills, IL) recirculated the media within the luminal flow loop to generate pulse waves with magnitudes up to 40 mmHg and frequencies as high as 10 Hz. Imaging was done with a monochrome CCD camera (Sony XC-ST50) connected to a Video Microscope (InfiniVar CFM) with resolution of ~1.7 µm/pixel. The images were acquired by an IMAQ Frame Grabber (NI PCI-1407, National Instruments) with 30 Hz frame rate and processed using LabView IMAQ imaging software to track the outer diameter.
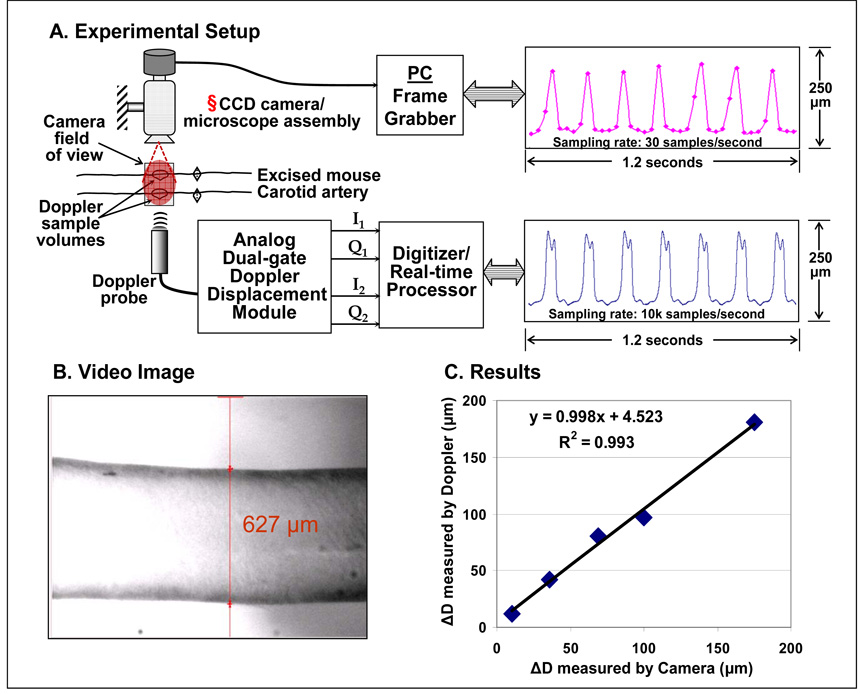
A 20 MHz Doppler probe was placed vertically a few millimeters above the vessel wall with its crystal tip end in the saline. The Doppler probe was positioned such that the sound beam was parallel to the plane of the camera’s field of view. Therefore both the devices were essentially tracking the same portion of the walls (Fig. 5 a–b). The Doppler data were sampled at 125 kHz and processed to obtain near and far wall displacement signals. These displacement signals were extracted at a sampling rate of 10 kHz and were further processed to obtain change (ΔD) in outer diameter.
Fig. 5.
Experimental setup for ex-vivo measurement of wall motion of excised mouse carotid artery using Doppler/MVRS system and CCD camera imaging system. § Please note that the camera is placed such that its field of view is parallel to the sound beam of the Doppler probe.
Animals
We made measurements in 7 wild-type mice mainly to demonstrate the system performance and capabilities and did not generate any data for statistics. All animal experiments were approved by the Animal Care and Use Committee of Baylor College of Medicine. We measured (a) PWV in three mice, (b) simultaneous Doppler flow velocities from multiple arterial sites in one mouse, (c) carotid wall displacement and flow velocity in one mouse, (d) left carotid, right carotid and stenotic jet velocity in one banded mouse, and (e) mitral blood velocity, annular displacement and annular velocity in one mouse. Mice were anesthetized with 1.0–1.5% isoflurane and placed supine on the ECG/heater board. The board temperature was adjusted to maintain body temperature at 37±1 °C. The limbs of the mouse were taped to the four electrodes with a tiny amount of ECG paste to optimize the contact. The overall experimental setup is shown in Fig. 6.
Fig. 6.
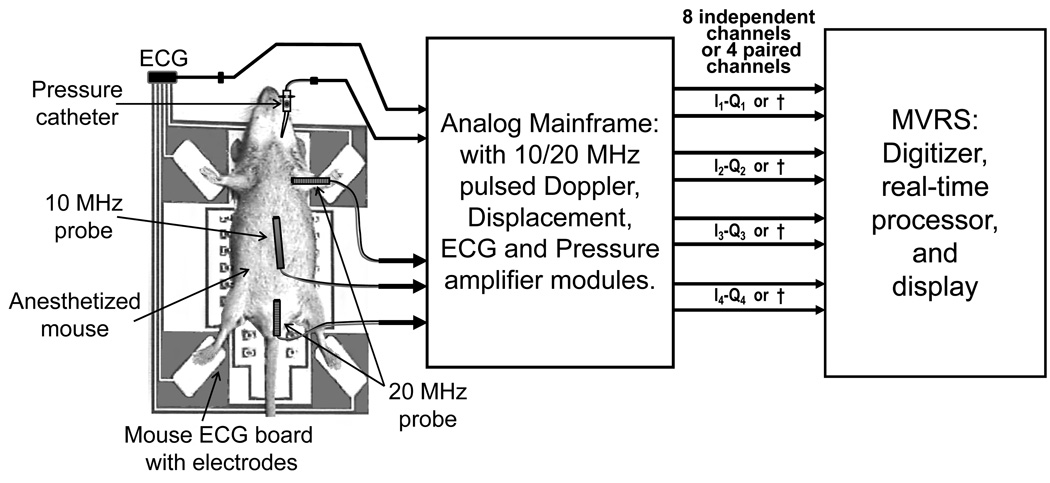
Experimental setup for the measurement of Doppler flow velocity signals along with ECG and blood pressure signals in mice. Several possible configurations are shown in this setup. For example 3 Doppler probes are shown along with a pressure catheter and ECG. MVRS (Mouse Vascular Research System) can digitize, process, and display the signals measured by these sensors, simultaneously. † - If an I–Q pair is not used then 2 channels will be available for other signals such as ECG, blood pressure, etc..
Noninvasive Doppler velocity and wall motion measurements
Using the general procedure described above, cardiac Doppler signals were obtained from the aortic root and the left ventricular inflow tract using a 10 or 20-MHz probe (Reddy et al. 2005b). Doppler flow velocity signals from peripheral vessels (carotid, coronary, aortic arch, abdominal aorta) (Reddy 2005b, Hartley 2007) and wall motion signals from carotid and abdominal arteries (Hartley 2004) were obtained using a 20-MHz probe. Typically we use separate Doppler probes to measure velocity and wall motion so that their respective orientations can be optimized to measure maximum blood velocity and maximum wall motion without the need for angle correction. Here we used a 3-gate Doppler and a single probe to measure velocity or displacement from 3 sites in the path of the sound beam. It should be noted that when making measurements of near wall motion, lumen blood velocity, and far wall motion using a single probe, the probe can be optimally positioned to measure wall motion but not blood velocity and vice versa. Such measurements are made only when timing becomes important. For simultaneous measurement of Doppler signals, probes were placed in holders and each was connected to a single-gate 10/20 MHz Doppler module. The measurement of mitral annular tissue displacement (tissue Doppler) was done simultaneously along with mitral flow velocity signal using two 20 MHz Doppler probes placed side-by-side at the cardiac apex and pointed toward the left ventricular inflow tract. The probes were operated at the same frequency in close proximity without interference, the Doppler I/Q signals were acquired, recorded, their FFT's or wall/tissue displacement signals were calculated and displayed in real-time.
Aortic PWV was determined from the aortic arch and abdominal aorta flow velocity as described elsewhere (Hartley 1997). We measured these signals simultaneously with two 20 MHz probes at native heart rate and at a paced rate that is a combination of two pulse times (one above and one below the native heart rate). Typically 2-second-long segments of the signals from each mouse were acquired, processed, and stored.
RESULTS
The results from in-vitro, ex-vivo and in-vivo evaluations are presented here. In-vitro validations of displacement resolution and minimum target distance were performed using phantoms. The displacement plot in Fig. 3b shows the 0.19 µm movements of the actuator. The plot also shows that the noise floor of the entire system (which includes external electronic noise pickup, mechanical vibrations, jitter in Doppler demodulation and digitization, errors in phase angle computation and conversion to µm) is around 0.1 µm. The Doppler I/Q signals were acquired and processed to produce the displacement plots shown in Fig. 4b. Based on the geometry of the dual string phantom and the excursion of the speaker the estimated motion is about 3 µm. The displacement plots show 3 µm triangular motion in opposite directions. The rounded shape of displacement1 waveform is not due to any filtering, but may be due to non-rigid mounting of the wire with SV1 (see Fig. 4a).
Ex-vivo validation of wall displacement measurement was performed using an excised mouse carotid artery (Fig. 5a). A representative video image with the software-superimposed arterial wall markers is shown in Fig. 5b. The ΔD change in diameter measured by our Doppler technique plotted against that measured by the independent video technique is shown in Fig. 5c. The correlation between the two measurements was very high (R2 = 0.99).
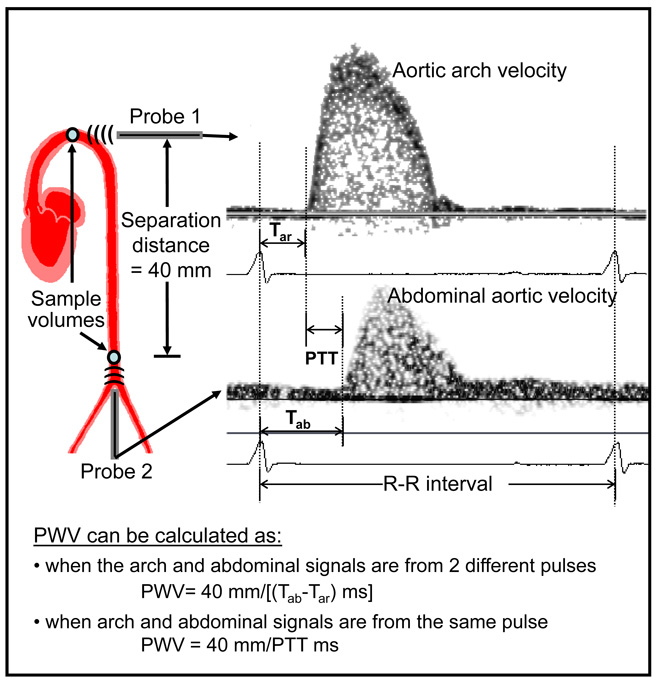
We calculated PWV using aortic arch and abdominal aorta flow velocity signals from a mouse (Fig. 7). The PWV data from the three mice is shown in table 1. For each mouse PWV was calculated using simultaneous pulses at native heart rate and the two paced heart rates (HR1 and HR2) and non-simultaneous pulses (Tab1-Tar2 and Tab2-Tar1). While PWV calculated from simultaneous pulses did not vary much, PWV calculated from non-simultaneous pulses were far apart.
Fig. 7.
Illustrative example of PWV calculated using pulse transit time (PTT) of the same pulse (simultaneous) or from different pulses (non-simultaneous) from flow velocity signals measured at 2 sites (aortic arch and abdominal aorta) in the same mouse.
Table 1.
Heart rate and pulse wave velocity data in 3 mice. Tar and Tab are the transit times from R-peak to the foot of the velocity pulse at aortic arch and abdominal aorta, respectively (see Fig. 7). The numbers 1 and 2 represent the signals at HR1 and HR2.
| Simultaneous Pulses | Non-Simultaneous Pulses | ||||
|---|---|---|---|---|---|
| Mice | Native HR | Paced HR1 | Paced HR2 | Tab1-Tar2 | Tab2-Tar1 |
| Mouse A | |||||
| HR (bpm) | 285 | 257 | 308 | 257–308 | 308-257 |
| PWV (cm/s) | 378 | 388 | 373 | 277 | 603 |
| Mouse B | |||||
| HR (bpm) | 375 | 334 | 399 | 334–399 | 399-334 |
| PWV (cm/s) | 383 | 367 | 377 | 241 | 816 |
| Mouse C | |||||
| HR (bpm) | 429 | 451 | 504 | 451–504 | 504–541 |
| PWV (cm/s) | 319 | 339 | 315 | 235 | 533 |
DISCUSSION
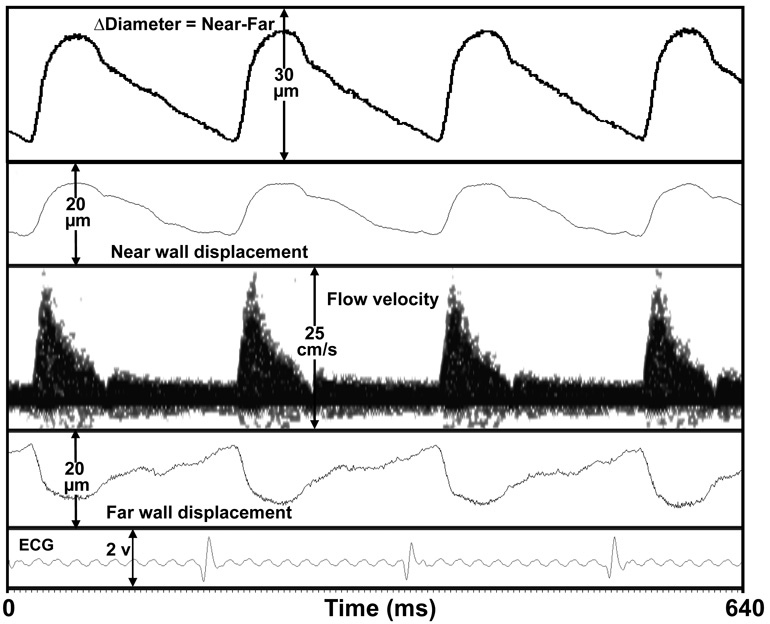
A high-speed high-resolution real-time multi-channel Doppler signal processing system (MVRS) capable of spectral processing of Doppler flow velocity signals and arctangent processing of Doppler arterial wall motion signals was developed and evaluated. The system can simultaneously acquire Doppler flow velocity from multiple arterial sites and other physiological signals such as blood pressure, respiration, and ECG in a mouse and process and display them in real-time. In-vitro evaluations demonstrated that MVRS is capable of achieving 0.1 µm resolution (Fig. 3b) for the Doppler displacement detector. This is also evident from the high fidelity carotid artery wall motion signal (Fig. 8) which shows a clear discernible dichrotic notch. Typical in-vivo signals we have recorded show motion excursions ranging from about 10 µm to 100 µm. The dual-gate Doppler displacement detector successfully detected motion from two targets separated by 200 µm as was demonstrated in our ex-vivo testing where we measured wall motion of an excised mouse carotid artery simultaneously using our Doppler technique and a video pixel tracking technique. The high correlation between the two measurements (Fig. 5c) validates the Doppler technique and also indicates that the ex-vivo (Fig. 5a) and the mechanical phantom motion plots (Fig. 4b) are indeed realistic representations of performance. The removal of wall filters enables the system to measure tissue velocity starting from 0 µm/s. The system can measure blood flow velocity as high as 9.6 m/s (based on a 10 MHz Doppler at a maximum PRF of 125 kHz) with 0.1 ms temporal resolution starting at sweep speeds of 100 ms.
Fig. 8.
Simultaneous measurement of near wall and far wall displacement, and flow velocity signal of right carotid artery in a mouse.
Advantages of the MVRS system
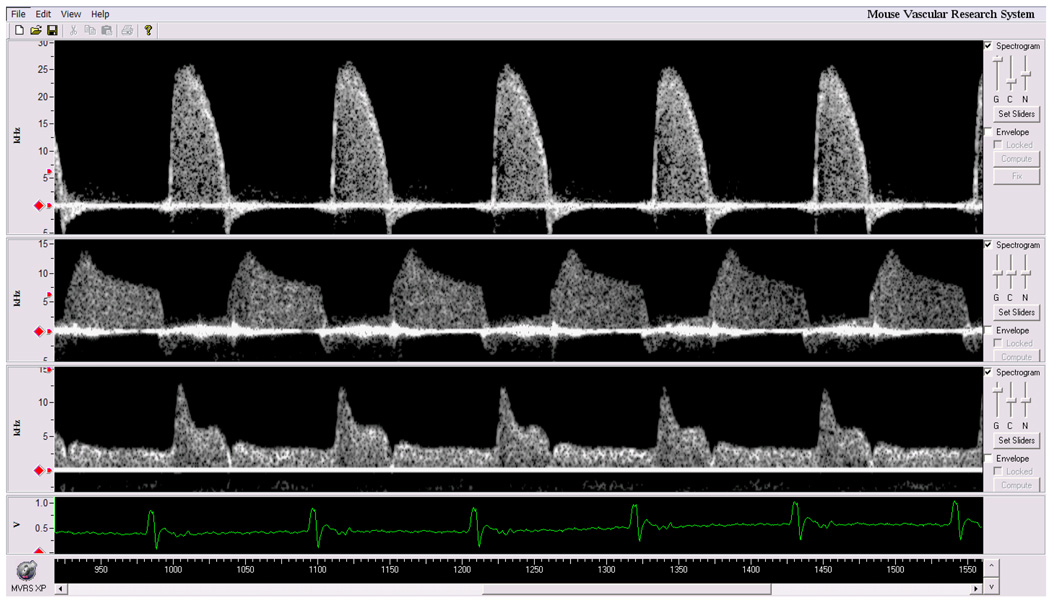
The main advantage of MVRS over DSPW is that it can acquire and process Doppler signals from more than one arterial site. The user interface window of the MVRS system is shown in Fig. 9 containing spectrograms of ascending aortic velocity, left main coronary artery velocity, and left common carotid artery velocity measured simultaneously with three 20 MHz Doppler probes. This is useful in the measurement of timing in cardiovascular signals. To our knowledge, no other "clinical" Doppler system can record or display more than one spectral Doppler signal at a time. One application is the determination of wave velocity of a pulse as it travels from the aortic arch to the abdominal aorta (about 4 cm in a mouse). Aortic PWV is often used as an indicator of stiffness of the wall segment between two aortic sites (Avolio et al. 1985, Arnet et al. 1994, Hartley et al. 1997, 2000). Pressure and velocity pulses travel faster in stiffer vessels than in compliant vessels. Therefore proper timing can be critical to the accuracy of the PWV measurement especially during interventions where responses may be associated with rapid transients causing the timing of the cardiac cycle to change within a few cycles. In the past we calculated PWV using pulse transit time obtained from non-simultaneous pulses (from different cardiac cycles) and have shown previously that PWV remains unchanged at different heart rates as long as pulse transit time is estimated from pulses with similar R-R intervals (Hartley et al. 1997, Reddy et al. 2005b). However, R-R interval in normal mice can vary as much as 3.5 ms (Zuberi et al. 2008) and this variability can be much larger with disease or during pharmacological interventions. With MVRS we demonstrated that PWV obtained from the transit time of the same pulse (simultaneous) is largely unaffected by varying heart rates while the PWV calculated from different (non-simultaneous) pulses varied widely (see Table 1).
Fig. 9.
Simultaneous measurement of aortic flow velocity (top), coronary flow velocity (center), and carotid flow velocity (bottom) along with ECG in a mouse.
Another advantage of MVRS is that we can measure and view the arterial wall motion in real-time. Several groups have developed ultrasonic methods to measure vessel wall motion noninvasively (Hoeks et al. 1990, Hokanson et al. 1972) in humans to assess vessel compliance. Previously, we obtained arterial wall displacement by calculating (offline in a spreadsheet) the phase of the Doppler echo (arctan(Q/I)) using Doppler I and Q signals measured in real-time from artery walls in mice (Hartley et al. 2004). The main drawback of this method was that we were not sure if the recorded signals represented the correct wall motion signals until after offline processing thus limiting optimization of probe position to measure the signal. With MVRS we can now measure near and far wall motion signals directly from an artery (right carotid) in a mouse using a 3-gate pulsed Doppler probe along with ECG signal (Fig. 8). The probe was at a non-optimal angle of about 75° to the direction of flow velocity and thus the peak value is very low. From the wall motion signals we can calculate %diameter change, augmentation index, and wave reflections (Hartley et al. 2004).
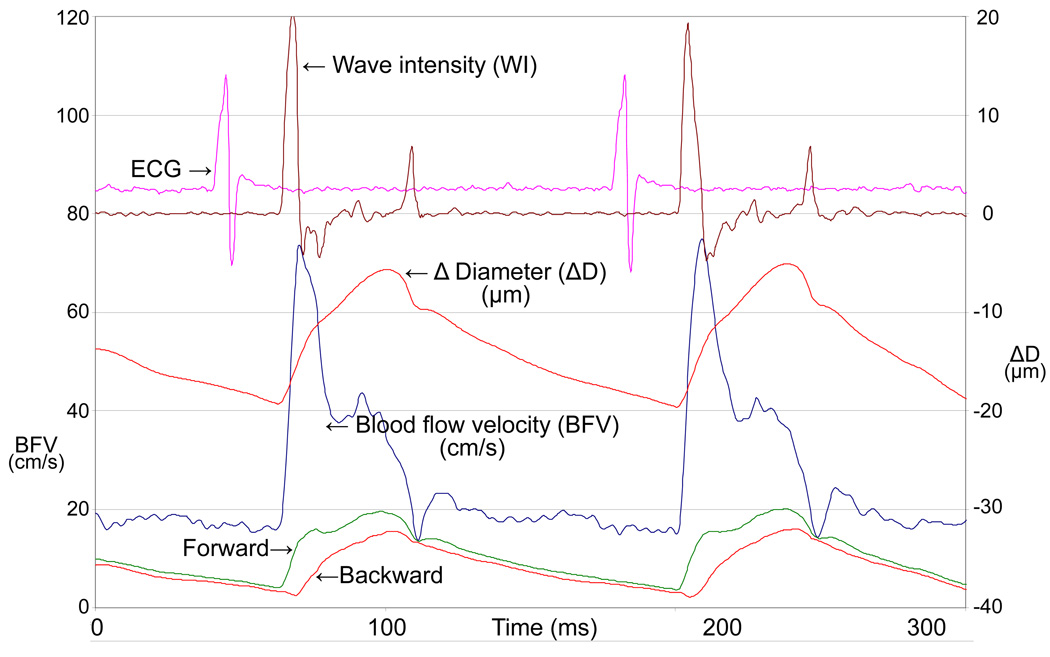
Wall motion signals can also be utilized in applications such as aortic input impedance and wave intensity analysis. Aortic impedance is used to characterize the pulsatile and the steady state components of the hydraulic load presented by the arterial system on the left ventricle. Determination of aortic input impedance requires the measurement of aortic flow and pressure signals. In mice however, both these measurements are invasive and terminal. We solved the problem partly by using noninvasively measured flow velocity (Reddy et al. 2003b) instead of flow, but still used an intravascular pressure catheter to measure pressure. To determine noninvasive indices of impedance and make serial studies possible in mice, we are currently pursuing studies to validate tail-cuff pressure calibrated aortic wall motion signals with simultaneously measured intravascular aortic pressure signals. The calibrated wall motion signal which is basically a realistic looking pressure waveform can also be used in wave intensity analysis which is defined as (dP/dt)×(dU/dt) where P is pressure and U is flow velocity waveform (Parker and Jones 1990). Since wave intensity requires derivatives of pressure and velocity it is important that these signals be of high fidelity and virtually noise free. In a mouse we can measure high fidelity signals of blood flow velocity and wall motion (%diameter change waveform) from the carotid artery (Fig. 10), and thereby calculate a wave intensity waveform of high quality. Wave intensity waveform has 2 major peaks where the amplitude of the first peak represents the forward travelling systolic compression wave (LV contractility) and the amplitude of the second peak represents the forward travelling expansion wave (LV relaxation) (Ohte et al. 2003, Penny et al. 2008). A dip in the waveform after the first peak is caused by the return of the backward compression wave which represents the sum of waves returning from all the reflections sites distal to the site of measurement. A mid-systolic forward expansion wave is represented by a much smaller peak between the 2 major peaks (Penny et al. 2008).
Fig. 10.
Carotid flow velocity, Δ diameter (ΔD=near-far wall displacement), wave intensity (WI), forward and backward waves, along with ECG in an ApoE−/− mouse from a previous study but using the multi-gate Doppler system. The units of WI are arbitrary.
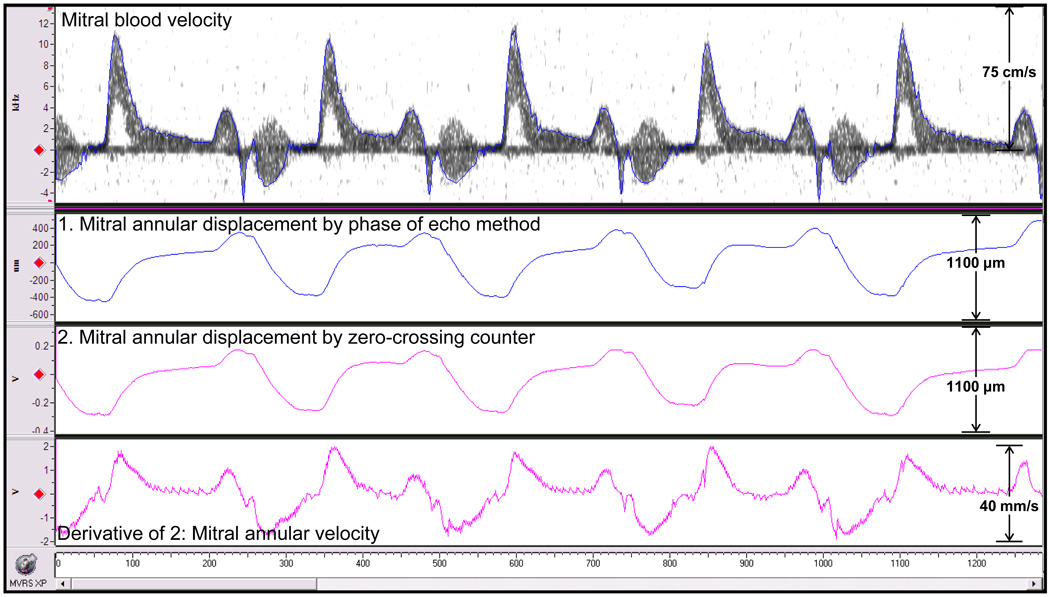
The MVRS also allows for other measurements such as mitral annular displacement signal with one probe while using mitral inflow velocity signal measured with a second probe as a guide (both Doppler probes were held side-by-side). The Doppler I and Q annulus motion signals were processed by two methods; one by using a zero-crossing counter module (analog) and the other by the phase of echo method (digital) to produce wall motion signals. The velocity of annulus wall motion was obtained by taking the derivative of the output from the zero-crossing counter using an analog differentiator. All signals are shown in Fig. 11. Note that the Doppler tissue and flow velocity signals can be measured simultaneously and are of much higher quality than those typically obtained from patients using tissue Doppler methods. Clinically the tissue Doppler imaging method is used to measure mitral annular velocity, which is used along with mitral blood velocity to evaluate diastolic ventricular function (Kato et al. 2003, Nagueh et al. 1997). Although this method has been applied to mice (Schaefer et al. 2005), the large footprint of echo probes does not allow for proper orientation and may need angle correction.
Fig. 11.
Mitral blood velocity, mitral annular displacement obtained by digitally processed phase of echo method (1), by analog zero-crossing counter processing (2) of Doppler I and Q wall motion signals, and mitral annular velocity obtained by analog differentiation of (2).
One of the vascular beds of major interest to cardiovascular researchers is the coronary circulation. Coronary flow velocity reserve (CFVR) can be obtained by the measurement of coronary flow velocity signals in a mouse at low (1.0%) and high (2.5%) levels of isoflurane gas. While we found that CFVR is about 3.2 in normal adult mice (Hartley et al. 2007), CFVR decreased to 2.0 at 1 day and to 0.9 after 3 weeks in a mouse model of pressure overload created by transverse aortic banding (Hartley et al. 2008). While we showed that coronary flow increases with the increase in isoflurane, we do not know its effect on other arterial flow velocities. Using MVRS we can now measure other flow velocity signals simultaneously with coronary flow to determine the effects of isoflurane on systemic as well as coronary circulation.
Limitations and Recommendations
As with any Doppler the MVRS has some limitations. The first is the lack of imaging for guidance for placing the sample volume. In most of the cases our knowledge of mouse anatomy and the shape and timing of the signals with respect to ECG helps us to overcome this limitation. In cases where we encounter shape or timing differences that may have been caused by anatomical abnormalities we use the VEVO770 system (Visualsonics, Toronto, Canada) for image guidance.
Doppler angle correction is used when it is known that the sound beam is not parallel to direction of flow. Even image guidance does not help in completely eliminating the errors caused by using estimated angle. Doppler velocity (ν) is inversely proportional to cosine(θ), where θ is angle between directions of target movement and sound beam. The caveat in using angle correction at larger angles can be seen in Table 2. For angles from 0–10° between target movement and direction of sound beam the error can be limited to 1.5%. However, for angle correction at angles 10–90° the %error can be larger. Since it is difficult to know the true angle avoiding angle correction altogether is the best choice. Our Doppler probes are substantially smaller (by a factor of 10 or more) than conventional clinical dual purpose imaging/Doppler probes (Li et al. 2003, Hartley et al. 2002) and allow us to obtain a fairly parallel orientation to the direction of blood flow and minimize angle corrections. Yet, angle corrections can be made in MVRS when necessary.
Table 2.
Percentage error in estimating Doppler velocity based on angle correction at some probable examples of true angles between target direction and ultrasound beam.
| True | True angle | Used | Used angle | Difference | ||
|---|---|---|---|---|---|---|
| angle (deg) | factor | angle (deg) | factor | in angle (deg) | % Error | Estimation |
| 5 | 1.0038 | 0 | 1.0000 | −5 | −0.3805 | under |
| 10 | 1.0154 | 5 | 1.0038 | −5 | −1.1430 | under |
| 20 | 1.0642 | 25 | 1.1034 | 5 | 3.6836 | over |
| 40 | 1.3054 | 45 | 1.4142 | 5 | 8.3350 | over |
| 50 | 1.5557 | 45 | 1.4142 | −5 | −9.0961 | under |
| 70 | 2.9238 | 75 | 3.8637 | 5 | 32.1464 | over |
| 85 | 11.4737 | 80 | 5.7588 | −5 | −49.8090 | over |
Other limitations include alterations in time and frequency resolutions caused by FFT processing. In MVRS complex FFT (cFFT) is performed on n-samples of quadrature Doppler signals every tenth of a millisecond to obtain the velocity spectrogram. This sliding window calculation causes the temporal width of the velocity spectrogram to be 0.1 (n−1) millisecond more than the temporal width of the actual velocity signal. For a given sampling rate this width increases with larger cFFT sample size. Since this additional width depends upon the sampling rate and cFFT sample size, it can be determined and corrected for if necessary. An important aspect of cFFT calculation is that time and frequency resolutions are inversely related; that is, improvement of time resolution causes the frequency resolution to diminish, and vice-versa. Since the sampling rate and FFT sample window can be changed, it is recommended that the user be knowledgeable about what combinations are appropriate for a given application. As a good compromise we consistently use a 256-sample segment to calculate cFFTs on data acquired at 125 kS/s.
CONCLUSIONS
We developed a high-speed high-resolution real-time multi-channel Doppler signal processing system (MVRS) specifically targeted for vascular measurements in mice. This system provides a significant improvement over the previously used Doppler signal processing workstation with respect to number of channels and frequency range, and is capable of spectral processing of Doppler flow velocity signal and arctangent processing of Doppler arterial wall motion signals measured from multiple sites and of displaying them simultaneously along with other physiological signals (blood pressure, respiration, and ECG). The MVRS is capable of measuring tissue displacement with 0.1 µm resolution, tissue velocity starting from 0 µm/s, blood flow velocity as high as 9 m/s, and simultaneous measurement of displacement of two targets 200 µm apart all with a temporal resolution of 0.1 milliseconds starting at sweep speeds of 100 ms. These specifications combined with the ability to measure multiple Doppler signals simultaneously allow MVRS to provide a significant improvement over DSPW and perform several-fold better than the best clinical Doppler systems used in mice.
Acknowledgements
We thank Drs. Humphrey, Wilson, and Gleason for allowing us to use their laboratory and equipment at Texas A&M University. Our thanks to Dr. Wehrens at the Dept. of Molecular Biology, Baylor College of Medicine for allowing us to use his laboratory and equipment and Dr. Chelu for helping with pacing experiments. We acknowledge Chidi Uzoki, Jennifer S. Pocius, Poornima Yechoor, Deepak Acharya, and Ross Hartley for their technical contributions and Jim Brooks for his editorial review. This work was supported in part by National Institute of Health Grants R01-HL22512, R01-AG17899, R41-HL76928, and K-HL73041.
Footnotes
Publisher's Disclaimer: This is a PDF file of an unedited manuscript that has been accepted for publication. As a service to our customers we are providing this early version of the manuscript. The manuscript will undergo copyediting, typesetting, and review of the resulting proof before it is published in its final citable form. Please note that during the production process errors may be discovered which could affect the content, and all legal disclaimers that apply to the journal pertain.
REFERENCES
- Arnett DK, Evans GW, Riley WA. Arterial stiffness: A new cardiovascular risk factor? Am J Epidem. 1994;140:669–682. doi: 10.1093/oxfordjournals.aje.a117315. [DOI] [PubMed] [Google Scholar]
- Avolio AP, Fa-Quan D, Wei-Qiang L, Yao-Fei L, Zhen-Dong H, Lian-Fen X, O'Rourke MF. Effects of aging on arterial distensibility in populations with high and low prevalence of hypertension: comparison between urban and rural communities in China. Circulation. 1985;71:202–210. doi: 10.1161/01.cir.71.2.202. [DOI] [PubMed] [Google Scholar]
- Butz GM, Davisson RL. Long-term telemetric measurement of cardiovascular parameters in awake mice: A physiological genomics tool. Physiol Genomics. 2001;5:89–97. doi: 10.1152/physiolgenomics.2001.5.2.89. [DOI] [PubMed] [Google Scholar]
- Collins KA, Korcarz CE, Lang RM. Use of echocardiography for the phenotypic assessment of genetically altered mice. Physiol Genomics. 2003;13:227–239. doi: 10.1152/physiolgenomics.00005.2003. [DOI] [PubMed] [Google Scholar]
- Domanski M, Norman J, Wolz M, Mitchell GF, Pfeffer MA. Cardiovascular risk assessment using pulse pressure in the first national health and nutrition examination survey (NHANES I) Hypertension. 2001;38:793–797. doi: 10.1161/hy1001.092966. [DOI] [PubMed] [Google Scholar]
- Evans DH, McDicken WN. Doppler ultrasound: Physics, instrumentation, and signal processing. 2nd ed. New York: Wiley; 2000. [Google Scholar]
- Gao XM, Lambert E, Dart AM, Du XJ. Cardiac output in mice overexpressing beta2-adrenoceptors or with myocardial infarct. Clin Exp Pharmacol Physiol. 2001;28(5–6):364–370. doi: 10.1046/j.1440-1681.2001.03453.x. [DOI] [PubMed] [Google Scholar]
- Georgakopoulos D, Mitzner WA, Chen CH, Byrne BJ, Millar HD, Hare JM, Kass DA. In vivo murine left ventricular pressure-volume relations by miniaturized conductance micromanometry. Am J Physiol Heart Circ Physiol. 1998;274:H1414–H1422. doi: 10.1152/ajpheart.1998.274.4.H1416. [DOI] [PubMed] [Google Scholar]
- Giddens DP, Khalifa AM. Turbulence measurements with pulsed Doppler ultrasound employing a frequency tracking method. Ultrasound Med Biol. 1982;8:427–437. doi: 10.1016/s0301-5629(82)80011-2. [DOI] [PubMed] [Google Scholar]
- Gleason RL, Gray SP, Wilson E, Humphrey JD. A multiaxial computer-controlled organ culture and biomechanical device for mouse carotid arteries. J Biomech Eng. 2004;126:787–795. doi: 10.1115/1.1824130. [DOI] [PubMed] [Google Scholar]
- Gonzalez RC, Woods RE. Digital image processing. 2nd ed. Reading, MA: Addison-Wesley; 1992. [Google Scholar]
- Hartley CJ, Hanley HG, Lewis RM, Cole JS. Synchronized pulsed Doppler blood flow and ultrasonic dimension measurement in conscious dogs. Ultrasound Med Biol. 1978;4:99–110. doi: 10.1016/0301-5629(78)90035-2. [DOI] [PubMed] [Google Scholar]
- Hartley CJ, Michael LH, Entman ML. Noninvasive measurement of ascending aortic blood velocity in mice. Am J Physiol Heart Circ Physiol. 1995;37:H499–H505. doi: 10.1152/ajpheart.1995.268.1.H499. [DOI] [PubMed] [Google Scholar]
- Hartley CJ, Taffet GE, Michael LH, Pham TT, Entman ML. Noninvasive determination of pulse-wave velocity in mice. Am J Physiol Heart Circ Physiol. 1997;273:H494–H500. doi: 10.1152/ajpheart.1997.273.1.H494. [DOI] [PubMed] [Google Scholar]
- Hartley CJ, Reddy AK, Madala S, Martin-McNulty B, Vergona R, Sullivan ME, Halks-Miller M, Taffet GE, Michael LH, Entman ML, Wang YX. Hemodynamic changes in apolipoprotein E-knockout mice. Am J Physiol Heart Circ Physiol. (279) 2000:H2326–H2334. doi: 10.1152/ajpheart.2000.279.5.H2326. [DOI] [PubMed] [Google Scholar]
- Hartley CJ, Taffet GE, Reddy AK, Entman ML, Michael LH. Noninvasive cardiovascular phenotyping in mice. ILAR J. 2002;43:147–158. doi: 10.1093/ilar.43.3.147. [DOI] [PubMed] [Google Scholar]
- Hartley CJ, Reddy AK, Madala S, Entman ML, Michael LH, Taffet GE. Noninvasive ultrasonic measurement of arterial wall motion in mice - Innovative Methodology. Am J Physiol Heart Circ Physiol. 2004;287:H1426–H1432. doi: 10.1152/ajpheart.01185.2003. [DOI] [PubMed] [Google Scholar]
- Hartley CJ, Reddy AK, Madala S, Michael LH, Entman ML, Taffet GE. Effects of isoflurane on coronary blood flow velocity in young, old, and ApoE−/ − mice measured by Doppler ultrasound. Ultrasound Med Biol. 2007;33:512–521. doi: 10.1016/j.ultrasmedbio.2006.11.002. [DOI] [PMC free article] [PubMed] [Google Scholar]
- Hartley CJ, Reddy AK, Madala S, Michael LH, Entman ML, Taffet GE. Doppler estimation of reduced coronary flow reserve in mice with pressure overload cardiac hyptertrophy. Ultrasound Med Biol. 2008;34:892–901. doi: 10.1016/j.ultrasmedbio.2007.11.019. [DOI] [PMC free article] [PubMed] [Google Scholar]
- Hayashi T, Nakayama Y, Tsumura K, Yoshimaru K, Ueda H. Reflection in the arterial system and the risk of coronary heart disease. Am J Hypertens. 2002;15:405–409. doi: 10.1016/s0895-7061(02)02260-4. [DOI] [PubMed] [Google Scholar]
- Hoeks APG, Brands PJ, Smeets FAM, Reneman RS. Assessment of the distensibility of superficial arteries. Ultrasound Med Biol. 1990;16:121–128. doi: 10.1016/0301-5629(90)90139-4. [DOI] [PubMed] [Google Scholar]
- Hokanson DE, Mozersky DJ, Sumner DS, Strandness DE., Jr A phase-locked echo tracking system for recording arterial diameter changes in vivo. J Appl Physiol. 1972;32:728–733. doi: 10.1152/jappl.1972.32.5.728. [DOI] [PubMed] [Google Scholar]
- Jeremy RW, Huang H, Hwa J, McCarron H, Hughes CF, Richards JG. Relation between age, arterial distensibility, and aortic dilitation in the Marfan syndrome. Am J Cardiol. 1994;74:369–373. doi: 10.1016/0002-9149(94)90405-7. [DOI] [PubMed] [Google Scholar]
- Kato T, Noda A, Izawa H, Nishizawa T, Somura F, Yamada A, Nagata K, Iwase M, Nakao A, Yokota M. Myocardial velocity gradient as a noninvasively determined index of left ventricular diastolic dysfunction in patients with hypertrophic cardiomyopathy. J Am Coll Cardiol. 2003;42:278–285. doi: 10.1016/s0735-1097(03)00573-4. [DOI] [PubMed] [Google Scholar]
- Kingwell BA. Large artery stiffness: implications for exercise capacity and cardiovascular risk. Clin Exp Pharmacol Physiol. 2002;29:214–217. doi: 10.1046/j.1440-1681.2002.03622.x. [DOI] [PubMed] [Google Scholar]
- Lakatta EG, Mitchell JH, Pomerance A, Rowe GG. Human aging: changes in structure and function. J Am Coll Cardiol. 1987;10:42A–47A. doi: 10.1016/s0735-1097(87)80447-3. [DOI] [PubMed] [Google Scholar]
- Latham RD, Westerhof N, Sipkema P, Rubal BJ, Reuderink P, Murgo JP. Regional wave travel and reflections along the human aorta: a study with six simultaneous micromanonetric pressures. Circulation. 1985;72:1257–1269. doi: 10.1161/01.cir.72.6.1257. [DOI] [PubMed] [Google Scholar]
- Laurent S, Boutouyrie P, Asmar R, Gautier I, Laloux B, Guize L, Ducimetiere P, Benetos A. Aortic stiffness is an independent predictor of all-cause and cardiovascular mortality in hypertensive patients. Hypertension. 2001;37:1236–1241. doi: 10.1161/01.hyp.37.5.1236. [DOI] [PubMed] [Google Scholar]
- Li Y-H, Reddy AK, Taffet GE, Michael LH, Entman ML, Hartley CJ. Peripheral vascular adaptations to transverse aortic banding in mice. Ultrasound Med Biol. 2003;29(9):1281–1289. doi: 10.1016/s0301-5629(03)00986-4. [DOI] [PubMed] [Google Scholar]
- Lorenz JN, Robbins J. Measurement of intraventricular pressure and cardiac performance in the intact closed-chest anesthetized mouse. Am J Physiol Heart Circ Physiol. 1996;272:H1137–H1146. doi: 10.1152/ajpheart.1997.272.3.H1137. [DOI] [PubMed] [Google Scholar]
- Martin-McNulty B, Vincelette J, Vergona R, Sullivan ME, Wang YX. Noninvasive measurement of abdominal aortic aneurysms in intact mice by a high-frequency ultrasound imaging system. Ultrasound Med. Biol. 2005;31(6):745–749. doi: 10.1016/j.ultrasmedbio.2005.02.012. [DOI] [PubMed] [Google Scholar]
- Mitchell GF, Jeron A, Koren G. Measurement of heart rate and Q–T interval in the conscious mouse. Am J Physiol Heart Circ Physiol. 1998;274:H747–H751. doi: 10.1152/ajpheart.1998.274.3.H747. [DOI] [PubMed] [Google Scholar]
- Nagueh SF, Middleton KJ, Kopelen HA, Zoghbi WA, Quinones MA. Doppler tissue imaging: a noninvasive technique for evaluation of left ventricular relaxation and estimation of filling pressures. J Am Coll Cardiol. 1997;30:1527–1533. doi: 10.1016/s0735-1097(97)00344-6. [DOI] [PubMed] [Google Scholar]
- Nichols WW, O'Rourke MF. McDonald's blood flow in arteries: Theoretical, experimental, and clinical principles. London: Edward Arnold; 1998. [Google Scholar]
- Ohte N, Narita H, Sugawara M, Niki K, Okada T, Harada A, Hayano J, Kimura G. Clinical usefulness of carotid arterial wave intensity in assessing left ventricular systolic and early diastolic performance. Heart Vessels. 2003;18(3):107–111. doi: 10.1007/s00380-003-0700-5. [DOI] [PubMed] [Google Scholar]
- Parker KH, Jones CJ. Forward and backward running waves in the arteries: analysis using the method of characteristics. J Biomech Eng. 1990;112(3):322–326. doi: 10.1115/1.2891191. [DOI] [PubMed] [Google Scholar]
- Pythoud F, Stergiopulos N, Westerhof N, Meister JJ. Method for determining distribution of reflection sites in the arterial system. Am J Physiol Heart Circ Physiol. 1996;271:H1807–H1813. doi: 10.1152/ajpheart.1996.271.5.H1807. [DOI] [PubMed] [Google Scholar]
- Penny DJ, Mynard JP, Smolich JJ. Aortic wave intensity analysis of ventricular-vascular interaction during incremental dobutamine infusion in adult sheep. Am J Physiol Heart Circ Physiol. 2008;294(1):H481–H489. doi: 10.1152/ajpheart.00962.2006. [DOI] [PubMed] [Google Scholar]
- Reddy AK, Taffet GE, Madala S, et al. Noninvasive blood pressure measurement in mice using pulsed Doppler ultrasound. Ultrasound Med Biol. 2003a;29:379–385. doi: 10.1016/s0301-5629(02)00746-9. [DOI] [PubMed] [Google Scholar]
- Reddy AK, Li Y-H, Pham TT, Ochoa LN, Treviño MT, Hartley CJ, Michael LH, Entman ML, Taffet GE. Measurement of aortic input impedance in mice: Effect of age on aortic stiffness. Am J Physiol Heart Circ Physiol. 2003b;285:H1464–H1470. doi: 10.1152/ajpheart.00004.2003. [DOI] [PubMed] [Google Scholar]
- Reddy AK, Jones AD, Martono C, Caro WA, Madala S, Hartley CJ. Pulsed Doppler signal processing for use in mice: Design and evaluation. IEEE Trans Biomed Eng. 2005a;52(10):1764–1770. doi: 10.1109/tbme.2005.855710. [DOI] [PubMed] [Google Scholar]
- Reddy AK, Taffet GE, Li Y-H, Lim S-W, Pham TT, Pocius JS, Entman ML, Michael LH, Hartley CJ. Pulsed Doppler signal processing for use in mice: Applications. IEEE Trans Biomed Eng. 2005b;52(10):1771–1783. doi: 10.1109/TBME.2005.855709. [DOI] [PubMed] [Google Scholar]
- Schaefer A, Meyer GP, Brand B, Hilfiker-Kleiner D, Drexler H, Klein G. Effects of anesthesia on diastolic function in mice assessed by echocardiography. Echocardiography. 2005;22(8):665–670. doi: 10.1111/j.1540-8175.2005.40096.x. [DOI] [PubMed] [Google Scholar]
- Skidmore R, Woodcock JP, Wells PNT, Bird D, Baird RN. Physiological interpretation of Doppler-shift waveforms-III. Clinical results. Ultrasound Med Biol. 1980;6(3):227–231. doi: 10.1016/0301-5629(80)90017-4. [DOI] [PubMed] [Google Scholar]
- Taffet GE, Hartley CJ, Wen X, Pham TT, Michael LH, Entman ML. Noninvasive indexes of cardiac systolic and diastolic function in hyperthyroid and senescent mouse. Am J Physiol Heart Circ Physiol. 1996;270:H2204–H2209. doi: 10.1152/ajpheart.1996.270.6.H2204. [DOI] [PubMed] [Google Scholar]
- Talukder N, Fulenwider JT, Mabon RF, Giddens DP. Poststenotic flow disturbance in the dog aorta as measured with pulsed Doppler ultrasound. J Vasc Surg. 1986;108:259–265. doi: 10.1115/1.3138612. [DOI] [PubMed] [Google Scholar]
- Tortoli P, Michelassi V, Bambi G, Guidi F, Righi D. Interaction between secondary velocities, flow pulsation, and vessel morphology in the common carotid artery. Ultrasound Med Biol. 2003;29:407–415. doi: 10.1016/s0301-5629(02)00705-6. [DOI] [PubMed] [Google Scholar]
- Zuberi Z, Birnbaumer L, Tinker A. The role of inhibitory heterotrimeric G proteins in the control of in vivo heart rate dynamics. Am J Physiol Regul Integr Comp Physiol. 2008;295:R1822–R1830. doi: 10.1152/ajpregu.90625.2008. [DOI] [PMC free article] [PubMed] [Google Scholar]


