Abstract
Two Monte Carlo systems, EGSnrc and Geant4, the latter with two different “physics lists,” were used to calculate dose distributions in large electron fields used in radiotherapy. Source and geometry parameters were adjusted to match calculated results to measurement. Both codes were capable of accurately reproducing the measured dose distributions of the 6 electron beams available on the accelerator. Depth penetration matched the average measured with a diode and parallel-plate chamber to 0.04 cm or better. Calculated depth dose curves agreed to 2% with diode measurements in the buildup region, although for the lower beam energies there was a discrepancy of up to 5% in this region when calculated results are compared to parallel-plate measurements. Dose profiles at the depth of maximum dose matched to 2-3% in the central 25 cm of the field, corresponding to the field size of the largest applicator. A 4% match was obtained outside the central region. The discrepancy observed in the bremsstrahlung tail in published results that used EGS4 is no longer evident. Simulations with the different codes and physics lists used different source energies, incident beam angles, thicknesses of the primary foils, and distance between the primary and secondary foil. The true source and geometry parameters were not known with sufficient accuracy to determine which parameter set, including the energy of the source, was closest to the truth. These results underscore the requirement for experimental benchmarks of depth penetration and electron scatter for beam energies and foils relevant to radiotherapy.
Keywords: Monte Carlo, electrons, treatment head simulation, beam modeling
1. Introduction
Monte Carlo simulation is a technique that provides both accurate and detailed calculation of particle fluence from the treatment head of a radiotherapy linear accelerator (see, for example, Chetty et al, 2007). Ma and Jiang (1999) reviewed the approach, applied to electron beams, Verhaegen and Seuntjens (2003) for x-ray beams. Faddegon et al (2005) used Monte Carlo simulation of the treatment head to calculate dose distributions in water for the largest electron field available on commercial linear accelerators used in radiotherapy, the 40×40 cm field with no applicator. The passage of the electron source particles and the resulting electromagnetic cascade were simulated from the exit window through the scattering foils, collimators, and monitor chamber, out past the adjustable collimators (jaws and MLC) and into a water phantom (Figure 1).
Figure 1.
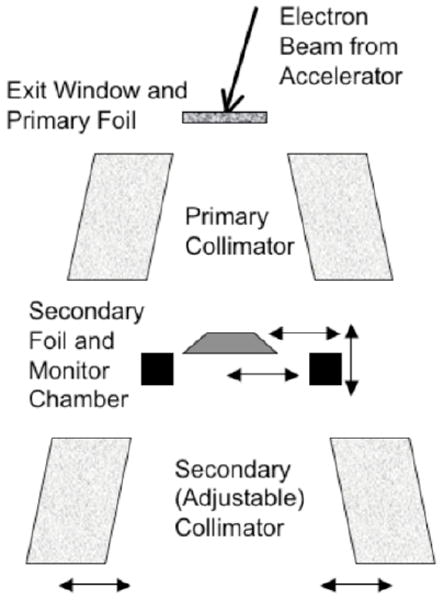
Linear accelerator treatment head showing the key components. Adjustments made to source and geometry parameters in the simulation included the incident beam angle and lateral and vertical shifts of the different components.
The dose distributions were sensitive to details of the source at the exit window of the accelerator and were also sensitive to the geometry of the treatment head (Schreiber and Faddegon 2005). This included significant sensitivity to asymmetry in the source and geometry: Non-normal incidence of the source particles at the exit window and off-axis shifts of the secondary scattering foil, monitor chamber and jaws. Calculated and measured dose distributions were generally in excellent agreement within the part of the field used for treatment; however, there was a significant discrepancy in the dose in the bremsstrahlung region beyond the practical range of the primary electrons, relative to the maximum dose on the central axis.
The objective of this work was to determine how well large electron fields are simulated with contemporary Monte Carlo codes. EGS and Geant4 were selected as both of these codes are widely used in the field of radiotherapy.
Simulation in the earlier publications was done using the BEAM user code with the EGS4 Monte Carlo system (Rogers el al, 1995). The EGSnrc system, a revision of EGS4, has a variety of improvements to electron transport (Kawrakow, 2000). In particular, multiple scattering is simulated more accurately. The improvements make it relevant to revisit this problem.
Geant4 is an all particle code with applications covering a variety of fields (Agostinelli et al, 2003; Allison et al, 2006). A primary application in medical physics is particle therapy. Multiple scattering was originally based on the Lewis formalism using the main term of the Lewis expansion formula. Results from Poon and Verhaegen (2005) showed that the accuracy of the approach should be improved. Beginning at Geant4 release 8.0, with further modifications in subsequent releases, changes were made to the model based on ideas from Penelope (Sempau et al, 1997) and EGSnrc (Kawrakow, 2000), including correlating lateral displacement and scattering angle and limiting the particle step size near detector boundaries. It is relevant to establish the capability of a recent release of Geant4 in matching the measured dose distributions in large electron fields.
2. Materials and Method
2.1 Measurement
The measurements reported here are the same measurements used in the previous study (Faddegon et al, 2005). Measurements were made on a Siemens Primus linear accelerator. The field size was set at the maximum, 40×40 cm, with no applicator. Measurements were done in water at 100 cm SSD. The central axis depth dose curve was measured for each beam along with a set of orthogonal profiles taken at the depth of maximum dose, dmax, and a few centimeters beyond the practical range, Rp+, where dose is from bremsstrahlung produced in the treatment head and water.
Depth dose curves were measured with both a diode (Scanditronix EFD “blue” diode) and a parallel plate ion chamber (PTW-Freiberg Roos N-34001). The effective point of measurement for both chambers was taken as the upstream surface of the sensitive volume. In the current study, the parallel-plate measurements were corrected with the stopping-power ratio (SPR) calculated as part of the Monte Carlo simulation of the electron beams using standard methods (see, for example, Ding et al, 1995).
The measured depth dose curves are shown in Figure 2, normalized so the curves for the different energies are clearly visible on the same plot. The depth of 50% of the maximum dose on the central axis of the beam, d50, was 2.43, 3.63, 4.78, 6.11, 7.39 and 8.61 cm, measured using the parallel-plate chamber and 2.51, 3.74, 4.87, 6.26, 7.58 and 8.81 cm, measured using the diode. The diode measurement has a lower dose near the surface with the dose difference reaching 6% for the 6 MeV beam and decreasing with energy. Preliminary work of an ongoing investigation has not clearly identified the reason for these differences (McEwen et al, 2007). Although parallel-plate measurements are used to test the reliability of diodes (Khan et al, 1991), it is not clear which detector provides the most accurate result. Therefore, depth dose curves measured with both detectors were used to tune the simulation parameters, including the average d50.
Figure 2.
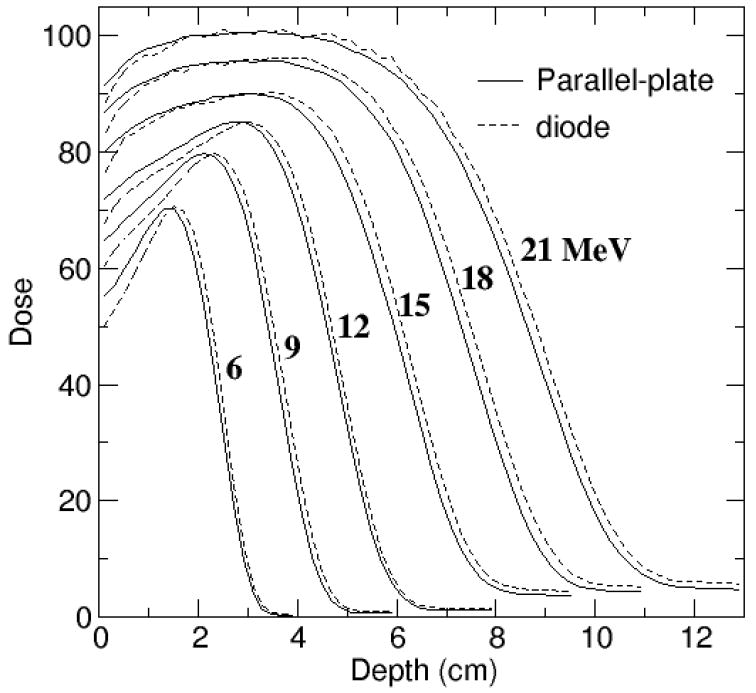
Measurements with parallel-plate chamber converted to dose to water (solid line) compared to diode measurements (dashed line). Dose averaged over 2 mm depth bins and normalized at the depth of maximum dose.
Profiles at dmax were measured with the diode oriented with its axis parallel to the beam, profiles in the bremsstrahlung tail with a thimble ion chamber (PTW CC13) with its axis perpendicular to the beam. The AAPM dosimetry protocol (Almond et al 1999) was used to measure the dose from x-rays at Rp+, using a Farmer type chamber, and the dose from electrons at dmax, using a parallel-plate chamber. The diode over-responds in the bremsstrahlung tail (Figure 2). Measured profiles in the bremsstrahlung region were normalized to the ratio of these doses, Dx/De, then multiplied by a factor, kV, which depended on the beam energy, to correct to the average dose over the 0.8 cm depth of the calculated profiles at dmax. A sharp increase in the dose in the bremsstrahlung tail was seen at energies above 12 MeV, due to a change to a thicker primary scattering foil at 15 MeV. The 15, 18 and 21 MeV beams share the same foil.
2.2 Monte Carlo Simulation
The simulations were done using the methodology employed in the previous study. A parallel beam of electrons with energy distribution calculated with the Parmela code (Koltenbah et al, 2002) was incident at a non-normal beam angle, in a radially symmetric, Gaussian-shaped focal spot. The beam exited the accelerator through a water-cooled titanium window of the treatment head, then through a set of two scattering foils, the second a shaped foil attached to the monitor chamber. Jaws and MLC were set to the maximum field size setting, corresponding to a field of 40×40 cm at the isocenter of the machine, 100 cm from the source. There was no electron applicator.
Dose distributions were calculated in a 60×60×15 cm water phantom, with the beam directed in the z-direction. The 60×60 cm square surface was centered on the central axis of collimator rotation. The phantom was positioned with the water surface at the machine isocenter. Energy deposited in the phantom was accumulated in 0.3×0.3×0.2 cm voxels.
To improve statistics, depth dose distributions were re-binned prior to plotting to 1.8×1.8×0.2 cm voxels for depth dose curves, with the 0.2 cm bin width preserved in the depth direction. Profiles were re-binned, depending on the orientation of the scan (inplane or crossplane), to either 0.3×3.6×0.8 cm or 3.6×0.3×0.8 cm at dmax, and to either 0.3×3.6×1.6 cm or 3.6×0.3×1.6 cm at Rp+.
For the purposes of comparison of the depth dose curves and profiles, the measured data was averaged to the same bin size used in the simulation. The measured and calculated depth dose curves were normalized to 100% in 2-3 depth bins about dmax. Several points were used in the normalization to reduce the influence of noise in the measured depth dose curves and statistical fluctuations in the calculated depth dose curves.
There were 50,000,000 source particles for each beam simulated. The statistical precision of the calculation, one standard deviation, was 0.3-0.5% for the depth dose curves near dmax and for the profiles at dmax at points in the treatment field (well inside the penumbra) for 9-21 MeV. The precision was smallest for the highest energy and largest for 15 MeV. Precision was smaller for the 9 and 12 MeV beams as fewer electrons were scattered out of the beam by the thinner, lower atomic number scattering foils in place. The precision of 0.7% for 6 MeV simulations was the largest due to the high scattering power at this energy. The statistical precision was 1-2% for the profiles at Rp+ at points near the central axis for 9-21 MeV. Higher precision was obtained at higher energy, as more bremsstrahlung was present in the beam per unit beam current at these energies. With no primary foil in place for the 6 MeV beam, there was very little bremsstrahlung in the beam, and the precision of the calculation was 7%. The statistical precision is a lower limit on the accuracy of the calculated dose.
Parameter adjustment was done iteratively until a good match with measurement was achieved. Improved agreement may be possible with further adjustment of the parameters. Energy was chosen to match the average d50 of the diode and parallel-plate chamber measurements to better than 0.05 cm, corresponding to energy adjustment of less than 0.1 MeV (Schreiber and Faddegon, 2005). The energy distribution of the source was the same as used previously (Faddegon et al, 2005). The mean energy was adjusted by shifting the spectrum.
With the dose normalized to 100% at dmax, adjustments were done to reduce the dose difference and/or the distance between points with the same dose on the measured and calculated curves. Adjustments included both cross-plane and in-plane beam angle, thickness of materials that scatter the beam and produce bremsstrahlung, and lateral and vertical shifts of the different components that scatter and collimate the beam, as depicted in Figure 1. The match sought for the dmax profiles was 3% in the high dose region well within the penumbra, defined as the inner 25 cm (the field width of the largest applicator), and at least one of 5% dose difference or 0.5 cm curve separation (5%/0.5 cm) outside of this region. A 5% match was sought in the dose ratio Dx/De and in the ratio of the measured and calculated profiles measured near the beam axis just beyond the practical range.
2.3 EGSnrc
The treatment head was simulated with the user code BEAM of (Rogers et al, 1995), version BEAMnrcMP 2007, with beamnrc.mortran version 1.77 of October 4, 2006. The EGS user code MCRTP (Faddegon et al, 1998), version 2.0 of May 31, 2007, was used to simulate the water phantom, including the SPR calculation. Both user codes utilized EGSnrc version 1.41 of February 13, 2007. Transport parameters included electron lower energy cut-offs ECUT and AE of 0.7 MeV, and photon lower energy cut-offs PCUT and AP of 1 keV. The boundary-crossing algorithm was EXACT (single scattering) for the treatment head simulation with BEAMnrc and PRESTA-I for the phantom simulation with MCRTP. The electron-step algorithm was PRESTA-II. Other parameters included a maximum step size SMAX of 5 cm, ESTEPE of 0.25, XIMAX of 0.5, skin depth for BCA defaulted, spin effect on, bremsstrahlung angular sampling Koch and Motz (KM), pair angular sampling “Simple,” and bremsstrahlung cross section Bethe-Heitler. Bound Compton scattering, Rayleigh scattering, atomic relaxations, and photoelectron angular sampling were all turned off. EGSnrc radiation transport parameters are discussed by Kawrakow (2000).
The 6 MeV simulation with MCRTP using EXACT took 35 times longer than simulation of the same source and geometry with PRESTA-I. Walters and Kawrakow (2007) reported a maximum 0.5% overestimate on the central axis of a 6 MeV beam irradiating a 10×10 cm field when using PRESTA-I, compared to runs using EXACT, with closer agreement at higher energy. PRESTA-I was used with MCRTP to take advantage of much faster simulations with an acceptable error.
2.4 Geant4
The Geant4 Simulation Toolkit, version 9.0.p01 of August 28, 2007, was used to simulate the treatment head and water phantom. All material definitions were taken from the NIST material definitions built into Geant4, with the exception of the stainless steel and the beam vacuum, which were defined as compositions of appropriate NIST elements.
Simulation was done for two different sets of radiation transport parameters. The list of processes to simulate (“physics list” in Geant4 terminology) in the first set, the “standard” physics list, was taken from one of the standard examples distributed with Geant4, example TestEM7 (physics list named “PhysListEMStandard”). The second set of simulations used the “low energy” physics list (“PhysListEmLivermore,” taken from the same published Geant4 example TestEM7).
The “Low Energy” processes use completely different algorithms than the “Standard” processes. These are not minor differences in the code. The low energy physics list makes direct use of cross-section data. The standard physics list relies on theoretical models.
A value of 0.1 mm was chosen for the Range Cut parameter. A change in range cut from 0.01 mm to 1 mm had less than a 2% effect on the calculated dose distributions in the high dose region for either physics list. With the low energy physics list there was no noticeable effect of the range cut on the bremsstrahlung dose outside of statistics. With the standard physics list, there was a 1-3% increase in the bremsstrahlung dose when the range cut was increased from 0.01 mm to 0.1 mm and a further 3-5% increase at 1 mm.
3. Results and Discussion
3.1 Depth dose curves
The measured depth dose curves are plotted in Figure 2. The beam energy chosen in the simulations resulted in a match of the depth penetration, d50, to the average of the parallel-plate and diode measurements to 0.04 cm or better. This resulted in a depth penetration match to 0.10 cm or better to both the parallel-plate and diode measurements for the 6-15 MeV beams, 0.15 cm for the 18 and 21 MeV beams. Differences in dose and distance to agreement between the measured and calculated depth dose curves are plotted in Figure 3 for half of the energies. Dose differences in the fall off region between simulation and measurement with either detector exceed 2% at all energies due to the shift in depth penetration between the measured depth dose curves and the decision to match the average penetration measured by the diode and parallel-plate at d50.
Figure 3.
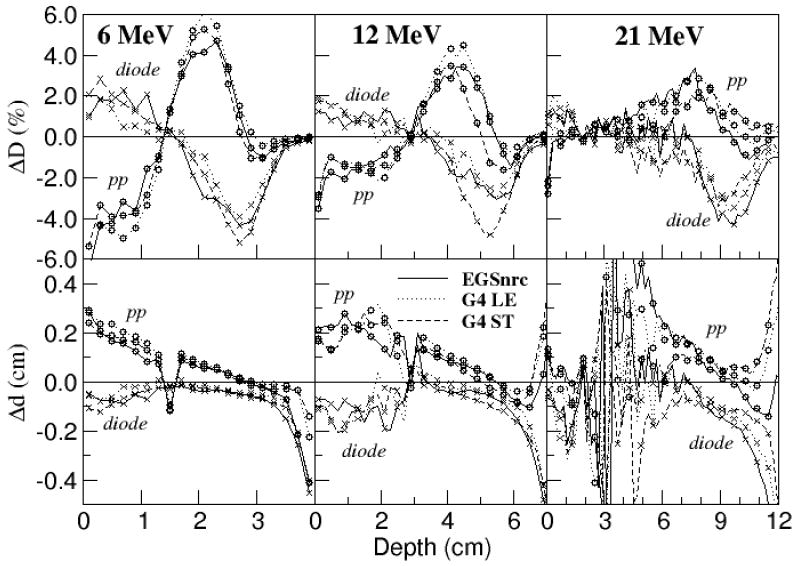
Comparison of depth dose curves measured with parallel-plate chamber (circles) and diode (crosses) to calculated depth dose curves at select energies: ESGnrc (solid line), Geant4 with low energy physics list (dotted line), Geant4 with standard physics list (dashed line). Top row: Calculated dose less measured dose, ΔD. Bottom row: Distance between points with the same dose, Δd. A positive value means the calculated curve is shifted deeper than the measurement. Point spacing is 2 mm with some symbols skipped in the plots at 12 MeV and 21 MeV.
As with EGS4, the calculated depth dose curves compare more favourably with the diode measurements in the build-up region, and with the parallel-plate chamber measurements in the bremsstrahlung tail. Similar agreement was achieved for the other energies.
The diode measurements agree with the calculated results at all depths to either 2% in dose difference or 0.1 cm in curve displacement (2%/0.1 cm) or better at all energies. The over-response of the diode to x-rays compared to electrons can be seen for the higher energy beams as a small dose difference (0.5-1% at 21 MeV) and a large distance-to-agreement (Δd) at points beyond the practical range.
The parallel-plate measurements agree with the calculated results to 2%/0.15 cm or better at all energies from dmax to the practical range and beyond. Discrepancies with the parallel-plate measurements near the surface, at depths greater than the chamber wall thickness of 0.1 cm, are larger at low energy and reach 4-5% for the 6 MeV beam. The reason for this discrepancy is attributed to a combination of experimental error and differences in chamber response and could indicate an error in the simulation such as too few low energy electrons or too narrow an angular distribution at the water surface. The difference observed between the diode and parallel-plate measurements in the build-up and fall-off regions is under further investigation, with preliminary results reported by McEwen et al (2007).
3.2 Dose profiles
Measured and calculated profiles are compared in Figure 4 for EGSnrc and in Figure 5 for Geant4 results calculated with the low-energy physics list. Results are normalized to 100% at dmax on the central axis, with inplane profile doses multiplied by a factor of 1.2 to separate them from the crossplane profiles. The dose in the bremsstrahlung tail just beyond the practical range at Rp+ was multiplied by an additional factor shown on each plot. The inplane profiles in the bremsstrahlung tail for the 6 MeV beam were left off the plots for clarity.
Figure 4.
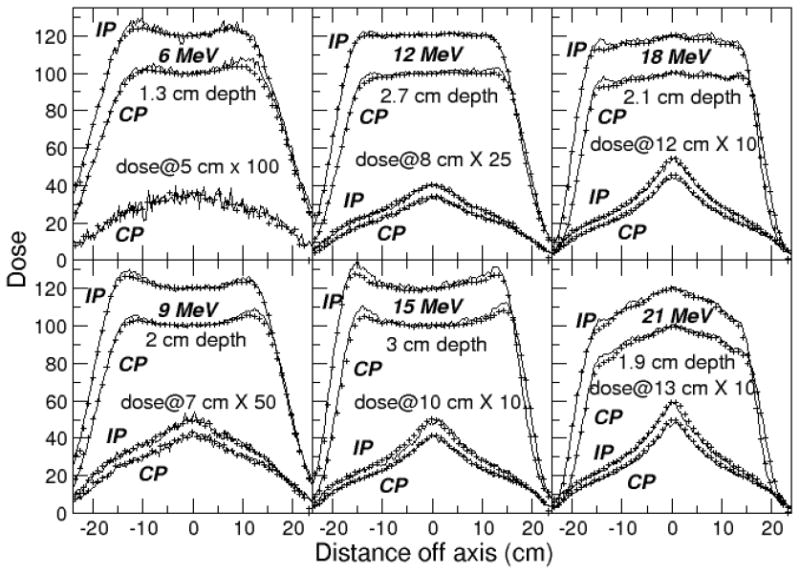
Profiles calculated with EGSnrc (lines) compared to measurements (points), rebinned to match 0.3 cm wide calculation bins, and showing only every third point. Crossplane (CP) dose distributions normalized to 100% on the central axis at dmax, inplane (IP) to 120%. The ratio of dose on the central axis at the 2 profile depths was preserved.
Figure 5.
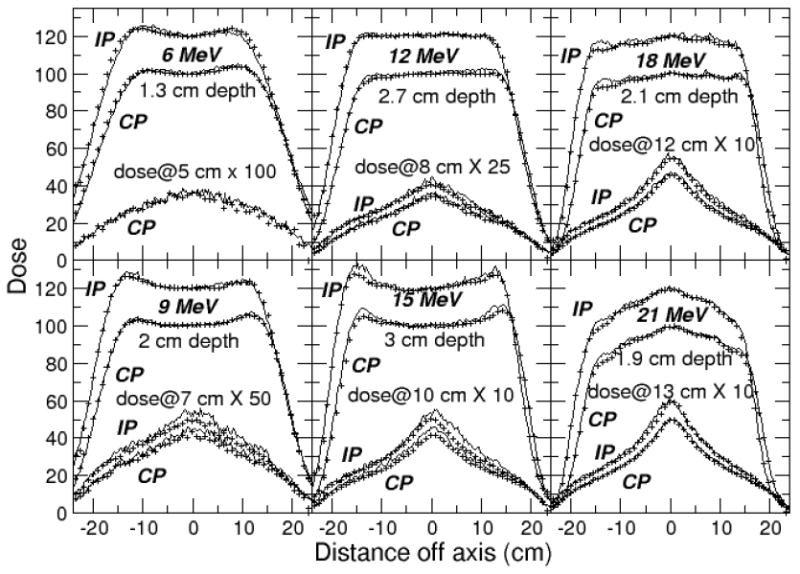
Profiles calculated with Geant4 (lines) compared to measurements (points), rebinned to match 0.3 cm wide calculation bins, and showing only every third point. Crossplane (CP) dose distributions normalized to 100% on the central axis at dmax, inplane (IP) to 120%. The ratio of dose on the central axis at the 2 profile depths was preserved.
A similar match was achieved for the dmax profiles with measurement with the two codes. Difference plots for the inplane profiles measured at dmax are shown in Figures 6 and 7. Measurements agree with calculated results to within 2-3% in the central region of the field out to 12.5 cm. The agreement is within 4% outside this region. The match to measurement could likely be improved to 2% in the inner region and 3%/0.3 cm in the outside region with further source and geometry adjustments using higher precision runs.
Figure 6.
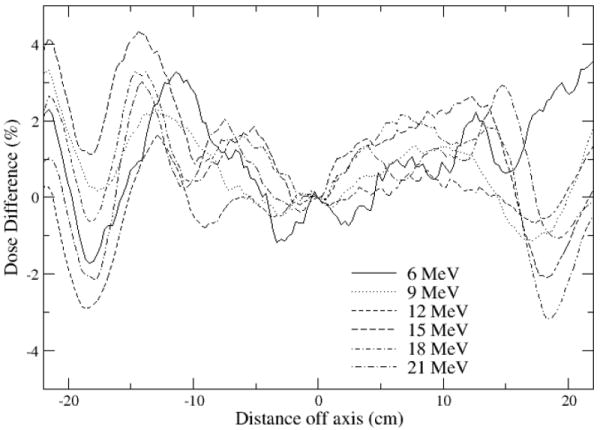
Inplane profiles calculated with EGSnrc less measured profiles, rebinned to match 0.3 cm wide calculation bins. Dose distributions normalized to 100% on the central axis at dmax prior to subtraction.
Figure 7.
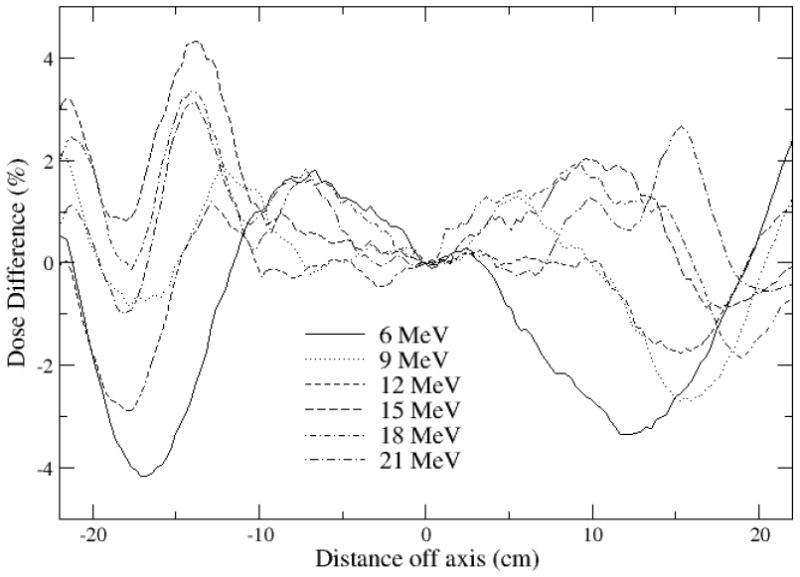
Inplane profiles calculated with Geant4, low energy physics list, less measured profiles, rebinned to match 0.3 cm wide calculation bins. Dose distributions normalized to 100% on the central axis at dmaxprior to subtraction.
Consider the profiles in the bremsstrahlung region, measured just beyond the practical range of each electron beam in the water phantom. EGSnrc and Geant4 with the low energy physics list generally achieved good agreement with measurement in the profile shapes and dose ratio Dx/De within the combined experimental uncertainty and precision of the calculation (combined in quadrature). The EGSnrc results show a significant improvement over EGS4, due to the more accurate multiple-scattering theory employed in EGSnrc. EGS4 and EGSnrc use the same bremsstrahlung cross-sections.
The dose ratio Dx/De calculated with Geant4 at 15 MeV was overestimated on one side of the central axis in the inplane profile by 7%, twice the uncertainty. The same foil thickness was used in simulating the 15, 18 and 21 MeV beams, since they share the same foil. However, the inplane steering is different for these beams. It is possible the beam impinges on a different part of the foil at 15 MeV, and the foil thickness may be thinner at that point with less bremsstrahlung produced. A thinner foil would also help reduce the dose well off axis in the dmax profile. This could improve the match of the measured dose distribution to the EGSnrc result as well.
The dmax profiles calculated with Geant4 using the standard physics list matched the measured profiles just as well as those shown in Figures 5 and 7 for the low energy physics list. In contrast, the dose ratio DX/De was overestimated by 10-15% at all energies, well outside experimental uncertainty. The range cut dependence of bremsstrahlung production when using the standard physics list reduces the overestimate a percentage point or two. The higher energies used with the standard physics list account for an increase of no more than 3% in the dose ratio. Since the same electron transport is used with the different physics lists and the dose ratio is accurately calculated when using the low energy physics list, it is apparent that too much bremsstrahlung is produced when using the standard physics list. This possibility is under investigation, by comparing Geant4 results to benchmarks of 10-30 MV bremsstrahlung from thick-targets measured by Faddegon et al (1990, 1991). In any case the dose difference is less than 1% of the maximum dose on the central axis, of little clinical consequence for electron therapy.
3.2 Source and geometry parameters
Different parameters were required to obtain a good match with measured data for the EGSnrc simulations and the two sets of Geant4 simulations using the different physics lists. The energy-dependent source and geometry parameters used are listed in Table 1. The energy-independent parameters are listed in Table 2.
Table 1.
Energy-dependent source and geometry parameters: Mean energy of Parmela spectra, inplane direction cosine at exit window, and percentage change in primary scattering foil thickness from the manufacturer specification. The crossplane direction cosine was 0.003.
| Monte Carlo System | Mean Energy (MeV) | Inplane Direction Cosine | Foil Thickness Change |
|---|---|---|---|
| EGSnrc | 6.78 | 0.005 | 0% |
| Geant4 Standard | 6.85 | 0.002 | 0% |
| Geant4 Low energy | 6.73 | 0.002 | 0% |
| EGSnrc | 9.80 | 0.003 | 0% |
| Geant4 Standard | 9.91 | 0.002 | 13% |
| Geant4 Low energy | 9.73 | 0.002 | 13% |
| EGSnrc | 12.41 | 0.001 | -6% |
| Geant4 Standard | 12.52 | 0.000 | 4% |
| Geant4 Low energy | 12.26 | 0.000 | 4% |
| EGSnrc | 16.02 | 0.008 | -5% |
| Geant4 Standard | 16.35 | 0.007 | 5% |
| Geant4 Low energy | 15.89 | 0.007 | 5% |
| EGSnrc | 19.22 | 0.003 | -5% |
| Geant4 Standard | 19.54 | 0.002 | 5% |
| Geant4 Low energy | 19.04 | 0.002 | 5% |
| EGSnrc | 22.29 | 0.000 | -5% |
| Geant4 Standard | 22.66 | -0.001 | 5% |
| Geant4 Low energy | 21.98 | -0.001 | 5% |
Table 2.
Source and geometry parameters shared by all beams. Lateral shifts relative to the line perpendicular to the exit window through the center of the focal spot where beam impinges on the exit window. Percentage values are change from the manufacturer specification.
| Gaussian focal spot FWHM | 0.2 cm |
| Exit window thickness | 25% thicker |
| Distance from primary foil to secondary foil | No change for EGSnrc, -0.1 cm for Geant4 |
| Secondary foil thickness at center | 10% thicker |
| Foil and foil ring inplane lateral shift | -0.02 cm |
| Foil and foil ring crossplane lateral shift | 0.006 cm |
| Chamber inplane lateral shift | -0.22 cm |
| Chamber crossplane lateral shift | 0.016 cm |
| Jaw upstream surface inplane shift | -0.075 cm |
The different parameters accommodate the different radiation transport algorithms and different cross-section data, including differences in implementation. Source and geometry differences do help determine which coding differences are significant in large field electron simulation and whether specific differences result in an inaccurate simulation. However, the interpretation of the results is complicated by the redundancy in the choice of parameters to match the measurements and the lack of knowledge of the true source and geometry details. A range of values for a variety of parameters is plausible and a different choice could lead to a different interpretation. It would be more helpful to have benchmarks of depth penetration and scatter from foils for accurately characterized sources and well known geometries.
The energy adjustment resulted in a match with the average depth penetration measured with the diode and parallel-plate chamber to 0.04 cm or better for all simulations. The highest energy was required when using Geant4 with the standard physics list, a lower energy in the EGSnrc simulation, the lowest energy in the Geant4 simulations with the low energy physics list. The difference in energy increased with energy. The maximum difference was 0.7 MeV for the 21 MeV beam. According to the sensitivity analysis of Schreiber and Faddegon (2005), this corresponds to a 0.3 cm shift in the depth of the 50% dose on the central axis, a 3% change in the off axis ratio at a point 12 cm off axis and a 2% change in the dose in the bremsstrahlung tail. Without an independent measurement of the source and geometry, these changes are not large enough to distinguish between the codes to determine which is more accurate.
Since Geant4 uses the same multiple scattering and energy loss theory, independent of physics list, the difference in the depth penetration is attributed to the different implementation of the cross-sections in the physics lists. The difference in depth penetration calculated with EGSnrc and Geant4 with either physics list (given the same source energy) is similar in magnitude to the difference in the measurement with the diode and parallel-plate chamber. Differences in cross-sections and details of the radiation transport could both contribute. An accurate benchmark for radiotherapy beam energies, scattering foil material and thickness is needed to distinguish between the codes. Energy would need to be known to 0.5%, corresponding to a 0.5 mm shift for a 20 MeV beam, and the accuracy of the measurement of depth penetration to 0.5 mm.
The inplane direction cosines of the 6 beams differed by up to 0.003 for simulations with the different codes and physics lists. This corresponds to only a 2% change in the off-axis ratio at a point 12 cm off axis. A steering coil is used on the Siemens linac to adjust the inplane beam angle. The actual beam angle and the relationship of beam angle to energy, spot position and steering coil current are not independently known. Thus the inplane beam angle is a free parameter. This may also be true of the crossplane beam angle, which has no coil for steering the beam, although using the same angle for all beam energies proved to be sufficient. The use of the slightly different inplane direction cosines could well be an artifact of the fitting process rather than an indication of differences in the codes.
Primary foil thickness was adjusted to match the profiles at dmax. The foils used for the higher energy beams were thinner than manufacturer specification in the EGSnrc simulations, thicker in the Geant4 simulations, with the same foil thickness used in both sets of Geant4 simulations. The requirement of a different foil thickness is attributed to the different multiple scattering algorithms used in EGSnrc and Geant4. The differences in foil thicknesses correspond to only a 2% increase in the off-axis-ratio 12 cm off axis. The foils in the clinical machine used for this study are unavailable for measurement and the exit window is inaccessible. Even if the foils were accessible, the determination of thickness is complicated by the uncertainty of where the beam actually hits the foil, with the thickness of the extruded gold foils used for the 12-21 MeV beams varying across the foil.
As with foil thickness, the determination of the actual source and geometry parameters to compare to the values used in the simulation is very difficult on a clinical machine where it is highly undesirable to disassemble the treatment head and risk altering the geometry. Even with a perfectly accurate simulation, different source and geometry parameters could be chosen to match the measurement. However, the range in the parameters used with the different codes and physics lists is small as is the effect on the calculated dose distributions. The requirement of these different parameters does not detract from the fact that both EGSnrc and Geant4 are capable of accurate simulation of dose distributions in large electron fields.
3.2 Fluence
Treatment head simulation is widely used as a means of computing fluence at or near the patient or phantom surface. Errors in calculated fluence may compromise the accuracy of dose calculated in situations very different from the geometry of the large field simulations. This includes small fields, fields incorporating surface shielding, treatment of regions with bone, air and other inhomogeneities, irradiation of devices used to measure fluence and dose, etc.
Fluence calculated at the phantom surface in the large field simulations may be less accurate than the calculated dose distributions. One reason is the details of the radiation transport in the phantom, (the conversion from fluence to dose), has a direct impact on the accuracy of the calculated fluence. For example, a 2% error in the stopping power of water would result in a similar error in the beam energy. Another reason is different source and geometry parameters could result in an excellent match to measured dose distributions with different fluence distributions. For example, surface dose is increased by two very different adjustments to the fluence: adding more low energy electrons or increasing the mean scattering angle of higher energy electrons. Incorrect values of source or geometry details arise from insensitivity of the calculation of the measured quantity, such as dose distributions, to specific source and geometry details. Incorrect values also arise from errors in the measurement or simulation.
A rigorous assessment of the accuracy of the calculated fluence requires an accurate experimental benchmark, such as the data set being measured by McDonald et al (2007): The spatial distribution of dose in air and helium with experimental precision exceeding 0.5% for beam energies known to 0.5% scattered from foils of well-known thickness and material composition relevant to radiotherapy. Measurements sensitive to specific source and geometry details, in addition to measurements used in the current study (dose distributions, photographs to ascertain the position of the monitor chamber and scattering foil, etc), would improve the accuracy of the calculated fluence.
4. Conclusions
Monte Carlo simulation was used successfully to obtain an excellent match to measured large field electron dose distributions, better than previously obtained with EGS4. EGSnrc and Geant4 with either physics list are capable of simulation of the full treatment head of the linear accelerator with an accurate calculation of dose in the water phantom. There was no clear advantage of one code over the other. The low energy physics list with Geant4 gave a better estimate of dose in the bremsstrahlung tail than the standard physics list with Geant4, although the overestimate amounted to only 1% of the maximum dose, of little clinical consequence.
Small differences in source and geometry parameters were required between the two codes and two different physics lists to achieve the excellent match obtained between calculated and measured dose distributions. These differences are due to differences in radiation transport and cross-sections, including differences in implementation. The source and geometry differences are within a reasonable tolerance of manufacturer specification. It is not known which parameter set was closest to the actual parameters. The parameters were chosen to match measured dose distributions, and therefore the accuracy of the calculated dose distributions is comparable when using different parameters with the different codes or different physics lists.
An experimental benchmark such as that being acquired by McDonald et al (2007) would help establish which if any code is the most accurate for simulation of large electron fields for the calculation of dose and fluence. Depth dose curves measured in a simple, well-known geometry with beam energy known to better than 1% would be useful to resolve the discrepancy in depth penetration between the codes.
Acknowledgments
We are grateful to Tsukasa Aso and Jane Tinslay for their help writing the code for the Geant4 simulations and Daren Sawkey for his help in processing the data for the EGSnrc simulations. This work is supported in part by the U.S. Department of Energy under contract number DE-AC02-76SF00515 and the National Institute of Health under R01 CA104777-01A2.
References
- Agostinelli S, et al. Geant4 - A Simulation Toolkit. Nuclear Instruments and Methods in Physics Research A. 2003;506:250–303. [Google Scholar]
- Allison J, et al. Geant4 Developments and Applications. IEEE Transactions on Nuclear Science. 2006;53:270–278. [Google Scholar]
- Almond PR, Biggs PJ, Coursey BM, Hanson WF, Huq MS, Nath R, Rogers DWO. AAPM’s TG-51 protocol for clinical reference dosimetry of high-energy photon and electron beams. Medical Physics. 1999;26:1847–1870. doi: 10.1118/1.598691. [DOI] [PubMed] [Google Scholar]
- Chetty IJ, Curran B, Cygler JE, DeMarco JJ, Ezzell G, Faddegon BA, Kawrakow I, Keall PJ, Liu H, Ma C, Rogers DWO, Seuntjens J, Sheikh-Bagheri D, Siebers JV. Report of the AAPM Task Group No. 105: Issues associated with clinical implementation of Monte Carlo-based photon and electron external beam treatment planning. Med Phys. 2007;34:4818–4853. doi: 10.1118/1.2795842. [DOI] [PubMed] [Google Scholar]
- Ding DX, Rogers DWO, Mackie TR. Calculation of stopping-power ratios using realistic clinical electron beams. Medical Physics. 1995;22:489–501. doi: 10.1118/1.597581. [DOI] [PubMed] [Google Scholar]
- Faddegon BA, Ross CK, Rogers DWO. Forward-Directed Bremsstrahlung of 10-30 MeV Electrons Incident on Thick Targets of Al and Pb. Med Phys. 1990;17(5):773. doi: 10.1118/1.596560. [DOI] [PubMed] [Google Scholar]
- Faddegon BA, Ross CK, Rogers DWO. Angular Distributions of Bremsstrahlung from 15 MeV Electrons Incident on Thick Targets of Be, Al and Pb. Med Phys. 1991;18:727. doi: 10.1118/1.596667. [DOI] [PubMed] [Google Scholar]
- Faddegon BA, Balogh J, Mackenzie R, Scora D. Clinical considerations of Monte Carlo for electron radiotherapy treatment planning. Rad Phys and Chem. 1998;53:217–227. [Google Scholar]
- Faddegon BA, Schreiber E, Ding X. Monte Carlo simulation of large electron fields. Phys Med Biol. 2005;50:741–753. doi: 10.1088/0031-9155/50/5/001. [DOI] [PubMed] [Google Scholar]
- Khan FM, Doppke KP, Hogstrom KR, Kutcher GJ, Nath R, Prasad SC, Purdy JA, Rozenfeld M, Werner BL. Clinical electron-beam dosimetry: Report of AAPM Radiation Therapy Committee Task Group No. 25. Medical Physics. 1991;18:73–109. doi: 10.1118/1.596695. [DOI] [PubMed] [Google Scholar]
- Kawrakow I. Accurate condensed history Monte Carlo simulation of electron transport. I. EGSnrc, the new EGS4 version. Medical Physics. 2000;27:485–98. doi: 10.1118/1.598917. [DOI] [PubMed] [Google Scholar]
- Khan FM, Doppke KP, Hogstrom KR, Kutcher GJ, Nath R, Prasad SC, Purdy JA, Rozenfeld M, Werner BL. Clinical electron-beam dosimetry: Report of AAPM Radiation Therapy Committee Task Group No. 25. Med Phys. 1991;18:73–109. doi: 10.1118/1.596695. [DOI] [PubMed] [Google Scholar]
- Koltenbah BEC, Parazzoli CG, Greegor RB, Dowell DH. PARMELA_B: a new version of PARMELA with coherent synchrotron radiation effects and a finite difference space charge routine. Nuclear Instruments and Methods in Physics Research Section A. 2002;487:249–267. [Google Scholar]
- Ma C-M, Jiang SB. Monte Carlo modelling of electron beams from medical accelerators. Phys Med Biol. 1999;44:R157. doi: 10.1088/0031-9155/44/12/201. [DOI] [PubMed] [Google Scholar]
- McEwen M, McDonald A, Faddegon B. Comparison of detectors for electron depth-dose measurements and investigation of parallel-plate chamber perturbation factors. Med Phys. 2007;34:2428. [Google Scholar]
- McDonald A, McEwen M, Faddegon B, Ross C. High precision data set for benchmarking of electron beam Monte Carlo. Medical Physics. 2007;34:2457. [Google Scholar]
- Poon E, Verhaegen F. Accuracy of the photon and electron physics in GEANT4 for radiotherapy applications. Medical Physics. 2005;32:1696–711. doi: 10.1118/1.1895796. [DOI] [PubMed] [Google Scholar]
- Rogers DWO, Faddegon BA, Ding GX, Ma C-M, We J, Mackie TR. BEAM: A Monte Carlo code to simulate radiotherapy treatment units. Medical Physics. 1995;22:503–524. doi: 10.1118/1.597552. [DOI] [PubMed] [Google Scholar]
- Schreiber E, Faddegon BA. Sensitivity of large-field electron beams to variations in a Monte Carlo accelerator model. Phys Med Biol. 2005;50:769–778. doi: 10.1088/0031-9155/50/5/003. [DOI] [PubMed] [Google Scholar]
- Sempau J, Acostab E, Baroc J, Fernández-Varead JM, Salvat F. An algorithm for Monte Carlo simulation of coupled electron-photon transport. Nucl Instrum Methods Phys Res B. 1997;132:377. [Google Scholar]
- Verhaegen F, Seuntjens J. Monte Carlo modelling of external radiotherapy photon beams. Phys Med Biol. 2003;48:R107–R164. doi: 10.1088/0031-9155/48/21/r01. [DOI] [PubMed] [Google Scholar]
- Walters BRB, Kawrakow I. Technical note: Overprediction of dose with default PRESTA-I boundary crossing in DOSXYZnrc and BEAMnrc. Med Phys. 2007;34:647–650. doi: 10.1118/1.2402342. [DOI] [PubMed] [Google Scholar]


