

Abstract
Obesity is a major public health problem with strong genetic determination; however, the genetic factors underlying obesity are largely unknown. In this study, we performed a genome-wide association scan for obesity by examining approximately 500 000 single-nucleotide polymorphisms (SNPs) in a sample of 1000 unrelated US Caucasians. We identified a novel gene, CTNNBL1, which has multiple SNPs associated with body mass index (BMI) and fat mass. The most significant SNP, rs6013029, achieved experiment-wise P-values of 2.69 × 10⁻⁷ for BMI and of 4.99 × 10⁻⁸ for fat mass, respectively. The SNP rs6013029 minor allele T confers an average increase in BMI and fat mass of 2.67 kg/m2 and 5.96 kg, respectively, compared with the alternative allele G. We further genotyped the five most significant CTNNBL1 SNPs in a French case–control sample comprising 896 class III obese adults (BMI ≥ 40 kg/m2) and 2916 lean adults (BMI < 25 kg/m2). All five SNPs showed consistent associations with obesity (8.83 × 10⁻³ < P < 6.96 × 10⁻⁴). Those subjects who were homozygous for the rs6013029 T allele had 1.42-fold increased odds of obesity compared with those without the T allele. The protein structure of CTNNBL1 is homologous to β-catenin, a family of proteins containing armadillo repeats, suggesting similar biological functions. β-Catenin is involved in the Wnt/β-catenin-signaling pathway which appears to contribute to maintaining the undifferentiated state of pre-adipocytes by inhibiting adipogenic gene expression. Our study hence suggests a novel mechanism for the development of obesity, where CTNNBL1 may play an important role. Our study also provided supportive evidence for previously identified associations between obesity and INSIG2 and PFKP, but not FTO.
INTRODUCTION
Obesity is a serious public health problem associated with an increased risk of type 2 diabetes mellitus, hypertension, coronary heart disease and certain cancers (1). The prevalence of obesity is increasing at an alarming rate; recent data show that ∼65% of the adult population in the USA are overweight, and 31% are obese (2). Body mass index (BMI, weight/height2, kg/m2) is the most widely used phenotype for the assessment of obese status. According to the World Health Organization, individuals with a BMI ≥ 25 kg/m2 are considered overweight, and those with a BMI ≥ 30 kg/m2 are obese.
The strong genetic determination of human obesity has been established by twin, family and adoption studies, which indicate a minimum heritability of 40% for obesity (3). During the past decade, more than 60 genome-wide linkage scan studies and hundreds of candidate gene association studies have been published, but the results are largely inconsistent/inconclusive (4). Until now, none of the candidate genes/genomic regions identified has been found to explain >10% of variation in any obesity phenotypes. This leaves the specific genetic factors underlying obesity largely unknown.
Rapid advancements have made it feasible and timely to pursue powerful genome-wide association (GWA) studies (5). GWA is a hypothesis-free approach that scans the entire human genome to identify novel genes/genome regions with modest effects on human complex diseases/traits. A number of GWA studies have reported novel findings for complex diseases, such as type 2 diabetes (6–9), inflammatory bowel disease (10,11) and prostate cancer (12,13). Several GWA studies have also found novel genes that may underlie obesity risk, such as INSIG2 (14,15), FTO (16–18) and PFKP (16), though their functional importance awaits further validation studies.
In this study, we performed a GWA to search for novel genes for obesity. Using Affymetrix 500K single-nucleotide polymorphism (SNP) arrays, we successfully genotyped and analyzed a total of 379 319 SNPs for 1000 unrelated US Caucasian subjects from whom we obtained both BMI and body fat mass data. We identified a novel gene, CTNNBL1 [catenin (cadherin-associated protein), β-like 1], on chromosomal region 20q11.23, associated with both BMI and fat mass. The significance of CTNNBL1 was further replicated in an independent case–control sample comprising 896 class III obese adults (BMI ≥ 40 kg/m2) and 2916 lean adults (BMI < 25 kg/m2) of French Caucasian origin.
RESULTS
GWA scans in the US Caucasian sample
The top signal of association for BMI was observed for SNP rs7001819 (P = 1.53 × 10⁻⁷), and the nearest gene is FDFT1 (farnesyl-diphosphate farnesyltransferase 1). However, this SNP did not show any association with fat mass. Multiple SNPs within the CTNNBL1 gene were found to be strongly associated with both BMI and fat mass. Given the strong associations observed for CTNNBL1, we focused our subsequent analyses on this gene. We list in Tables 1 and 2 the eight SNPs within the CTNNBL1 gene achieving at least nominally significant associations (P < 0.05). It can be seen that the minor allele frequency (MAF) of the genotyped SNPs is quite comparable between our own data set and the HapMap CEU database (19,20). The three SNPs (s6013029, rs16986921 and rs6020712) achieved experimental-wise P-values of 2.69 × 10⁻⁷, 5.88 × 10⁻⁷ and 7.92 × 10⁻⁷, respectively, for BMI (being the second to fourth most significant SNPs for BMI). Notably, these three SNPs were also the top three most significant SNPs for fat mass, with P-values of 4.99 × 10⁻⁸, 6.54 × 10⁻⁸ and 1.20 × 10⁻⁷, respectively (Tables 1 and 2). To assess potential population stratification, we calculated the overall genomic control (GC) correction factors for BMI and fat mass, which were 1.05 and 1.06, respectively, implying that potential population stratification in this US Caucasian population, if present, should be minimal. The GC-corrected P-values and false discovery rate (FDR) q values (calculated on the basis of GC-corrected P-values) are also shown in Tables 1 and 2. For readers' convenience, we list in Supplementary Material, Table S1 the relevant information for all the genotyped SNPs for CTNNBL1. We also imputed untyped and/or missing SNPs at this region. The imputation algorithm, which uses the LD and haplotype structure from all the markers of HapMap database (19,21) to infer the genotypes at untyped loci in our individuals, was implemented in the program IMPUTE (22). The association data for the imputed SNPs are presented in Supplementary Material, Table S2.
Table 1.
Association results in the US Caucasian sample: information on the SNPs of the CTNNBL1 gene showing associations with BMI and fat mass in US Caucasians
| SNP | Position | Role | Allelea | MAFb | MAFc | Raw P-value | GC-corrected P-value | FDR q value | EIGENSTRAT P-value | ||||
|---|---|---|---|---|---|---|---|---|---|---|---|---|---|
| BMI | Fat mass | BMI | Fat mass | BMI | Fat mass | BMI | Fat mass | ||||||
| rs6013029 | 35832994 | Intron 7 | G/T | 0.06 | 0.05 | 2.69 × 10⁻⁷ | 4.99 × 10⁻⁸ | 5.11 × 10⁻⁷ | 1.11 × 10⁻⁷ | 0.065 | 0.027 | 1.39 × 10⁻⁶ | 4.80 × 10⁻⁷ |
| rs16986921 | 35815935 | Intron 4 | C/T | 0.06 | 0.05 | 5.88 × 10⁻⁷ | 6.54 × 10⁻⁸ | 1.08 × 10⁻⁶ | 1.43 × 10⁻⁷ | 0.102 | 0.028 | 1.73 × 10⁻⁶ | 5.63 × 10⁻⁷ |
| rs6020712 | 35820026 | Intron 5 | G/A | 0.07 | 0.05 | 7.92 × 10⁻⁷ | 1.20 × 10⁻⁷ | 1.43 × 10⁻⁶ | 2.55 × 10⁻⁷ | 0.117 | 0.033 | 5.04 × 10⁻⁶ | 1.44 × 10⁻⁶ |
| rs6020846 | 35839081 | Exon/intron boundary | A/G | 0.08 | 0.07 | 2.45 × 10⁻⁵ | 7.01 × 10⁻⁶ | 3.80 × 10⁻⁵ | 1.21 × 10⁻⁵ | 0.413 | 0.341 | 1.21 × 10⁻⁵ | 9.16 × 10⁻⁵ |
| rs6020395 | 35772738 | Intron 1 | G/C | 0.06 | 0.07 | 3.46 × 10⁻⁵ | 7.71 × 10⁻⁶ | 5.28 × 10⁻⁵ | 1.33 × 10⁻⁵ | 0.494 | 0.345 | 3.13 × 10⁻⁴ | 2.22 × 10⁻⁵ |
| rs16986890 | 35759937 | Intron 1 | A/G | 0.08 | 0.07 | 1.41 × 10⁻⁴ | 3.11 × 10⁻⁵ | 2.0 × 10⁻⁴ | 5.00 × 10⁻⁵ | 0.695 | 0.526 | 2.39 × 10⁻⁴ | 1.50 × 10⁻⁴ |
| rs6096781 | 35960629 | Promoter | T/C | 0.09 | 0.08 | 0.014 | 0.0034 | 0.016 | 0.0044 | 0.866 | 0.872 | 0.023 | 0.0011 |
| rs6020339 | 35765409 | Intron 1 | T/C | 0.37 | 0.32 | 0.031 | 0.0071 | 0.035 | 0.0087 | 0.869 | 0.881 | 0.006 | 0.0021 |
aThe second allele represents the minor allele of each locus.
bMAF calculated in the US Caucasian sample.
cMAF reported for Caucasians in the public database of HapMap CEU.
FDR q values less than 0.05 are in bold.
Table 2.
Association results in the US Caucasian sample: magnitude and direction of SNP effectsa
| SNP | β | SE | r2 | Reference allele | |||
|---|---|---|---|---|---|---|---|
| BMI | Fat mass | BMI | Fat mass | BMI | Fat mass | ||
| rs6013029 | 0.115 | 0.122 | 0.022 | 0.022 | 0.013 | 0.015 | G |
| rs16986921 | −0.112 | −0.122 | 0.022 | 0.022 | 0.013 | 0.015 | C |
| rs6020712 | −0.110 | −0.119 | 0.022 | 0.022 | 0.012 | 0.014 | G |
| rs6020846 | −0.094 | −0.101 | 0.023 | 0.022 | 0.009 | 0.010 | T |
| rs6020395 | 0.093 | 0.101 | 0.022 | 0.023 | 0.008 | 0.010 | G |
| rs16986890 | 0.085 | 0.094 | 0.022 | 0.023 | 0.007 | 0.009 | A |
| rs6096781 | −0.055 | −0.066 | 0.022 | 0.023 | 0.003 | 0.004 | T |
| rs6020399 | −0.049 | −0.061 | 0.022 | 0.023 | 0.002 | 0.004 | T |
aObtained using linear regression analyses.
Using the confidence interval method (23) implemented in Haploview (24) and our own genotype data, we plotted the LD and haplotype structure of the CTNNBL1 gene (Fig. 1). The gene forms three major haplotype blocks (blocks 1–3). The most significant SNP rs6013029 is in weak LD with some of the other SNPs.
Figure 1.
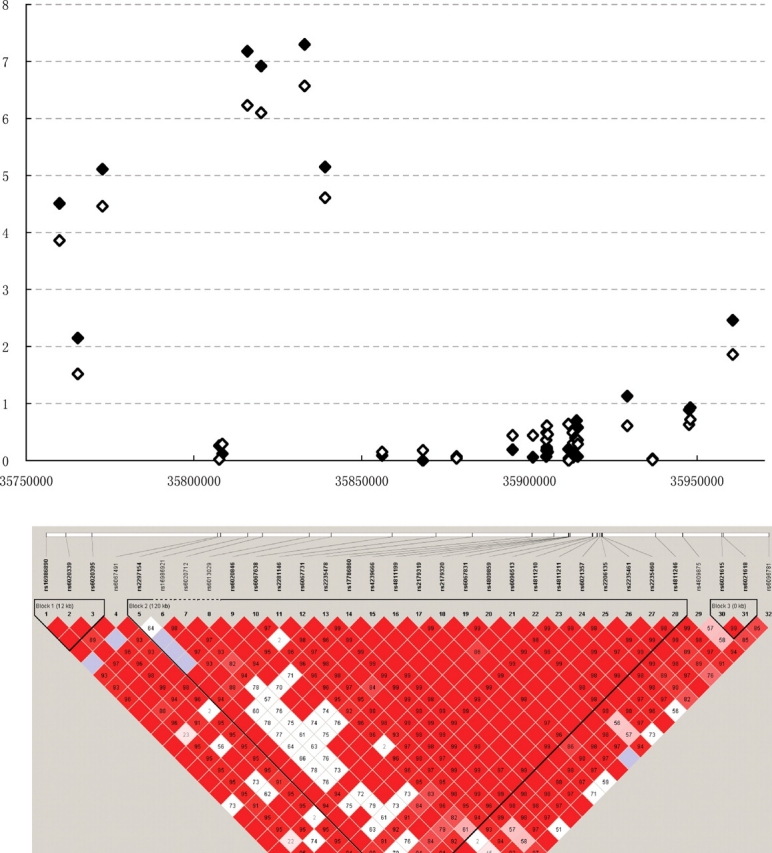
Association signals for all genotyped SNPs in the CTNNBL1 gene in US Caucasians. The empty diamonds represent association signals for BMI and the filled diamonds represent association signals for fat mass. The Y axis is −log10(P) values. The haplotype block maps were constructed using our own genotype data showing pairwise LD (D′).
The SNP rs6013029, with a polymorphism of G→T nucleotide change, is located in the intron 7 of CTNNBL1. The BMI and fat mass distribution in different genotypes are shown in Figure 2. The subjects of homozygous TT have higher BMI and fat mass than those of homozygous GG. The analyses of allele effects showed that the risk allele T confers 9.8% higher BMI (2.67 kg/m2) and 24.1% higher fat mass (5.96 kg) than the alternative allele G. Using quantitative genetics methods, we calculated the genetic variance that rs6013029 may explain, which were 0.029 and 0.042, respectively, for BMI and fat mass. We then calculated the power of identifying the estimated genetic variances using Genetic Power Calculator (25). At the significance level of 4.2 × 10⁻⁷, the power of this study to identify the reported effect sizes was 64.3 and 93.2%, respectively, for BMI and fat mass. We further calculated the probability of replicating the identified effect sizes using the methods proposed by Killeen (26). Assuming that replication studies have the same number of subjects as the original GWA and that they have similar levels of sampling error, the probabilities of replicating the identified effect sizes will be as high as 99.9% for both BMI and fat mass.
Figure 2.

BMI (kg/m2) and fat mass (kg) distribution in different genotype groups of rs6013029 in US Caucasians.
To determine the inter-relationship between these eight significant SNPs within the CTNNBL1 gene and to investigate whether the association signals detected by these SNPs are from the same or distinct functional variants, we performed conditional association analyses for the seven SNPs using the genotype at the most significant SNP rs6013029 as the covariate to adjust for BMI and fat mass. As shown in Figure 3, all seven SNPs had universal and significant loss association signals, as reflected by the evident drop of −log10(P) values. This suggests that the associations of these eight SNPs may come from the same functional variant of the gene, which is in strong LD with rs6013029 and influences BMI and fat mass. We also performed conditional analyses in reverse by using the seven SNPs as covariates to see whether any of these SNPs could eliminate the association of rs6013029. The P-values obtained were 0.003 and 0.002, respectively, for BMI and fat mass, suggesting that these seven SNPs may explain only a portion of the variance that is attributable to rs6013029.
Figure 3.
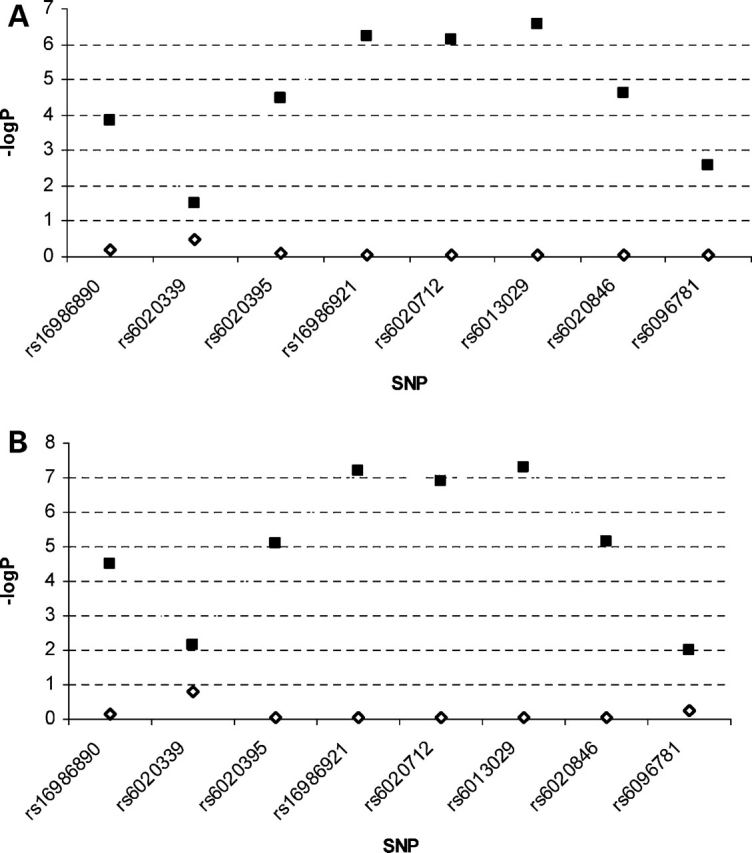
The results of association tests for BMI and fat mass before and after adjusting for genotype of rs6013029. (A) Results of association analyses for BMI. (B) Results of association analyses for fat mass. Filled squares represent association signals in original association analyses. Empty diamonds represent association signals after adjusting genotype at the rs6013029 as a covariate.
Using the FASTSNP program, we investigated the potential functions of these eight SNPs. According to the program, four SNPs (rs6013029, rs6020712, rs16986890 and rs6020339) are potential transcription factor-binding sites and hence may have a role in transcription regulation. A G→T change at rs6013029, a G→A change at rs6020712 and an A→G change at rs16986890 may result in the elimination of the binding sites for transcription factor Oct-1, CdxA and SRY, respectively, whereas an A→G change at rs6020339 may produce a change in the binding site from CdxA to Pbx-1 or AP-1. The other three intronic SNPs (i.e. rs6096781, rs6020846 and rs6020395) and a promoter SNP, rs6096781, are without known function.
The CTNNBL1 gene is located at the chromosome region 20q, which showed strong linkage to obesity phenotypes in our previous genome-wide linkage scan studies (27); LOD scores of 1.55 and 3.31 were obtained for BMI and fat mass, respectively, at this region (Table 3). This region contains two other candidate genes, FLJ42133 and NNAT, whose SNPs also achieved highly suggestive associations for fat mass in the current GWA study (P-values of 10−6 to 10−5). The region 5q35, achieving an LOD score of 2.04 for BMI in our earlier linkage scan (27), contains two genes, SH3PXD2B and SLIT3, whose SNPs achieved P-values of 10−5 to 10−4 for BMI in this GWA study.
Table 3.
Comparison of the results of our earlier linkage scan (27) and current GWA study in US Caucasians
| Results of our earlier linkage scan | Results of the current GWA | |||||
|---|---|---|---|---|---|---|
| Phenotype | Genomic region | LOD score | SNP | Associated gene | Cytoband | P-value |
| BMI | 5q35 | 2.04 | rs13356223 | SH3PXD2B | 5q35.1 | 5.91 × 10⁻⁵ |
| rs10077897 | SH3PXD2B | 5q35.1 | 1.39 × 10⁻⁴ | |||
| rs13436547 | SH3PXD2B | 5q35.1 | 4.27 × 10⁻⁴ | |||
| rs17734503 | SLIT3 | 5q35.1 | 4.80 × 10⁻⁴ | |||
| rs12654448 | SLIT3 | 5q35.1 | 5.92 × 10⁻⁴ | |||
| Fat mass | 20p11–q13 | 3.31 | rs6013029 | CTNNBL1 | 20q11.23 | 4.99 × 10⁻⁸ |
| rs16986921 | CTNNBL1 | 20q11.23 | 6.54 × 10⁻⁸ | |||
| rs6020712 | CTNNBL1 | 20q11.23 | 1.20 × 10⁻⁷ | |||
| rs7363432 | FLJ42133 | 20q11.23 | 3.51 × 10⁻⁶ | |||
| rs6095722 | FLJ42133 | 20q11.23 | 1.74 × 10⁻⁵ | |||
Several recent GWA studies identified novel genes for obesity, such as INSIG2 on chromosome 2q14.1 (14), FTO on 16q12 (16–18), and PFKP on 10p15 (16). The associations of INSIG2 and PFKP with obesity were also observed in this study, as reflected by P-values achieved for the SNPs within/around each gene (Table 4). However, the association of the FTO gene with obesity could not be replicated in this study sample.
Table 4.
Comparison of the published GWA studies for obesity and the current study
| Results of the published GWA | Results of current GWA | |||||||
|---|---|---|---|---|---|---|---|---|
| SNP | Associated gene | Cytoband | P-value | Reference | SNP | Associated gene | Cytoband | P-value |
| rs75666015 | INSIG2 | 2q14.1 | 0.0026 | (14) | rs2012693 | INSIG2 | 2q14.1 | 0.007 |
| rs7566605 | INSIG2 | 2q14.1 | 0.009 | |||||
| rs9930506 | FTO | 16q12 | 8.6 × 10⁻⁷ | (17) | >0.50 | |||
| rs9939609 | FTO | 16q12 | <0.001 | (16) | >0.50 | |||
| rs6602024 | PFKP | 10p15 | 4.9 × 10⁻⁶ | (17) | rs2388395 | PFKP | 10p15 | 1.4 × 10⁻⁴ |
| rs2388399 | PFKP | 10p15 | 4.2 × 10⁻⁴ | |||||
| rs2388397 | PFKP | 10p15 | 4.8 × 10⁻⁴ | |||||
For potential stratification of our sample, when 200 randomly selected unlinked SNPs were used to cluster our subjects, under all the assigned values (i.e. 2, 3 and 4) for the assumed number of population strata, k, all 1000 subjects were tightly clustered together, implying no population stratification. When 2000 and 6000 SNPs were used, under all the assigned values of k, the vast majority (>98%) of the subjects were tightly clustered together, with the exception of only six subjects, suggesting that there is essentially no population stratification in this sample. These six subjects do not have extreme BMI or fat mass values. This analysis indicates that these six subjects have little contribution to the overall association results. Moreover, we re-performed association analyses after excluding these six subjects and obtained very similar results (data not shown).
To further guard against potential population stratification that could not be identified by the structured association method (28), we performed association analyses using the principal component analysis method implemented in EIGENSTRAT (29). The P-values obtained in EIGENSTRAT analyses were quite comparable with the raw P-values (Tables 1 and 2). Supplementary Material, Figure S1 shows the top two principal components in this study sample.
We examined the distribution of P-values for all 379 319 SNPs analyzed using quantile–quantile (Q–Q) plots for BMI and fat mass (Fig. 4). It can be seen that the observed P-values matched the expected P-values under the null distributions over the range of 1 < −log10(P) < 4.0 for both BMI and fat mass. An excess of low P-value is observed at −log10(P) of 4.0 for both traits. Departure of distribution at the extreme tail suggests that the associations identified are likely due to true variants rather than potential biases such as genotyping error.
Figure 4.

Q–Q plots for BMI (A) and fat mass (B) association −log10(P) values for the US Caucasian sample and P-values expected under the null distribution for the GWA SNPs.
Replication studies in a French case–control sample
To confirm our GWA findings obtained in the US Caucasian population, we genotyped the five most significant CTNNBL1 SNPs (rs6013029, rs16986921, rs6020712, rs6020846 and rs6020395) in 896 class III obese adults (BMI ≥ 40 kg/m2) and 2916 lean adults (BMI < 25 kg/m2) of French Caucasian origin. The P-values of logistic regression analysis and OR (95% CI) for each SNP are provided in Table 5. It can be seen that all five SNPs showed strong associations with obesity (8.83 × 10⁻³ < P < 6.96 × 10⁻⁴). Those subjects who were homozygous for allele T at SNP rs6013029 had 1.42-fold increased odds of obesity compared with those subjects not carrying the T allele. Since the threshold of significance for follow-up regional replication analysis should be less stringent (i.e. larger P-values) than that of initial GWA scans, the association results obtained in this French case–control sample provide very strong replication evidence supporting the GWA findings in US Caucasians.
Table 5.
Replication studies in French adult case–control sample
| SNP | Allelea | Obese | Control | MAF (case, control) | OR (95% CI) | P-value |
|---|---|---|---|---|---|---|
| rs6013029 | G/T | 2.669 | 877 | 0.072, 0.052 | 1.42 (1.14–1.77) | 7.80 × 10⁻⁴ |
| rs16986921 | C/T | 2.669 | 877 | 0.070, 0.051 | 1.38 (1.11–1.72) | 1.96 × 10⁻³ |
| rs6020712 | G/A | 2.669 | 877 | 0.072, 0.052 | 1.43 (1.15–1.72) | 6.96 × 10⁻⁴ |
| rs6020846 | A/G | 2.669 | 877 | 0.080, 0.062 | 1.32 (1.07–1.62) | 4.03 × 10⁻³ |
| rs6020395 | G/C | 2.669 | 877 | 0.077, 0.061 | 1.29 (1.04–1.58) | 8.83 × 10⁻³ |
aThe second allele represents the minor allele of each locus. Replication analyses compare genotype frequencies in obese and lean individuals using logistic regression under an additive model. The OR is the odds ratio of the risk allele.
DISCUSSION
In this study, we identified a novel gene, CTNNBL1, which has multiple SNPs associated with BMI and fat mass. In the US Caucasian sample, the minor allele T of the most significant SNP (rs6013029) confers an average increase in BMI and fat mass of 2.67 kg/m2 and 5.96 kg, respectively, compared with the alternative allele G. In the French case–control sample, those subjects who were homozygous for the rs6013029 allele T had a 1.42-fold increased odds of obesity when compared with those not carrying the T allele. The other four significant SNPs (rs16986921, rs6020712, rs6020846 and rs6020395) showed consistency in sign for the association with BMI and fat mass. The importance of chromosome region 20q11, which harbors the CTNNBL1 gene, was also highlighted in our previous genome-wide linkage scan study (27). Moreover, several other groups also found linkages to obesity at this region (4).
The sequence, gene structure and expression pattern of CTNNBL1 were recently characterized (30), but its biological functions remain largely unknown. The human CTNNBL1 gene contains 16 exons and 15 introns spanning >178 kb (30). CTNNBL1 mRNA is detectable in all tissues, but is especially abundant in skeletal muscle (a major site for energy metabolism), placenta, heart, spleen, testes and thyroid (30). A number of motifs in the CTNNBL1 sequence are characteristic of transcription factors. Further, the CTNNBL1 protein has structural similarities to the family of proteins containing armadillo repeats, a structural motif originally identified in the Drosophila melanogaster segment polarity gene product armadillo, the ortholog of mammalian β-catenin (30). On the basis of this structural homology, CTNNBL1 may also possess similar functions of β-catenin, which not only regulates cell-to-cell adhesion as a protein interacting with cadherin but also functions as a component of the Wnt-signaling pathway (30–32). The Wnt-signaling pathway is conserved in various organisms and plays important roles in development, cellular proliferation and differentiation. Studies demonstrate that the Wnt/β-catenin-signaling pathway appears to operate to maintain the undifferentiated state of pre-adipocytes by inhibiting adipogenic gene expression (33). In addition, β-catenin may also influence the magnitude and potential of intestinal nutrient absorption through the metabolic learning process, as the physiological differentiation zone of enterocytes is linked to the β-catenin system (34). Our association finding here for CTNNBL1, together with structural homology between CTNNBL1 and β-catenin and the functional relevance of the Wnt/β-catenin pathway on adipogenesis, may suggest a novel hypothetical mechanism by which CTNNBL1 contributes to the development of obesity. Interestingly, the TCL7L2 (transcription factor 7-like 2) gene which was repeatedly associated with diabetes (6–9,35) can regulate proglucagon in enteroendocrine cells via the Wnt-signaling pathway. Further studies showed TCF7L2 can substantially influence normal birth weight variation (36).
Several recent GWA studies reported association findings for obesity and related phenotypes. The first GWA for obesity was published in 2006 (14), in which the INSIG2 gene was associated with BMI in the Framingham Heart Study participants, and the association was replicated in four separate sample populations including Western Europeans, African Americans and children. In the current study, we obtained P-values of 0.007 and 0.009 for two INSIG2 SNPs. In view of the fact that P-values for replication studies should not be as stringent as those for GWA studies, our study provides supportive evidence for association between INSIG2 and obesity. Nevertheless, the association between INSIG2 and obesity has been inconsistent. Some independent studies (37,38) could not replicate this association, although others studies (39,40) found this INSIG2 polymorphism may increase the risk for obesity in already overweight individuals. Overall, US Caucasian subjects studied here were overweight (BMI of 28.92 kg/m2 for males and 27.29 kg/m2 for females), which may partially explain the associations observed for INSIG2 in this study sample. The association of the FTO gene with obesity was recently identified by several GWA studies (16–18), but this association could not be replicated in the present study, suggesting that this association might be heterogeneous across population samples.
GWA studies of complex diseases are still in their early stages and many GWA findings await further studies to validate or refute. From classical probability theory, the probability of replication for a specific association may decrease with increasing number of independent GWA studies. This is because the likelihood that a specific association can be replicated by multiple GWA studies is the product of the power of each study. Thus, the probability of replication is high only when all the studies have very high power. Many other factors, such as differential LD and allele frequencies across populations, small sample sizes and potential population stratification, may also significantly influence the chance of replicating GWA results (41). Therefore, statistical replication may not always be easy, even for functional variants in well-designed studies. Meta-analysis is a useful tool for synthesizing data and exploring potential heterogeneity (42,43). Bayesian approaches (44) or complementary concepts such as Bayesian false-positive report probability (45,46) may also help assess the credibility of an association identified. However, meta-analysis and Bayesian analyses require data sharing among different research groups, which is not always easy to obtain in the research community. Functional molecular and cellular studies are essential for validating and illuminating the functional relevance of the genes uncovered in population studies. It is critical that validation of preliminary associations can be achieved in additional samples before follow-up molecular and cellular studies.
Potential population stratification may cause false-positive/negative association results (47), but the probability is low in this study. First, our study cohort for the initial GWA came from a US mid-west Caucasian population, living in Omaha, NE, USA, and its surrounding areas. This US Caucasian population is relatively homogenous due to a fairly stable population in which Caucasians have predominated as the major ethnic group in this area for an extended period. In addition, we found that the genotypic and allelic frequencies of the significant SNPs in our sample are very similar to those reported in the typical and representative Caucasian samples used in the HapMap CEU. Our subpopulation analysis indicated that >98% of the subjects consistently clustered together as a single group, suggesting no significant population substructure in our sample. Moreover, genome control factors for BMI and fat mass are quite close to 1.0. To further guard against potential population stratification, we performed principal component analysis implemented in EIGENSTRAT (29).
In summary, we identified a novel gene, CTNNBL1, associated with BMI and fat mass through a GWA study in a US Caucasian population. The significance of this gene was further replicated in a large French adult case–control sample. The functional relevance of CTNNBL1 on obesity is still unclear. Because of structural homology between CTNNBL1 and β-catenin, and the functional relevance of Wnt/β-catenin pathway on adipogenesis, we propose a novel hypothetical mechanism underlying obesity, in which CTNNBL1 may play an important role. Further functional studies including knockout and overexpression models of CTNNBL1 are necessary to validate its significance to obesity.
MATERIALS AND METHODS
Subjects and phenotypes
The study was approved by the Institutional Review Board involved. Signed informed consent documents were obtained from all study participants before they entered the study.
US Caucasian sample
This sample contains 1000 unrelated adults, which was randomly identified from our established and expanding genetic repertoire currently containing more than 6000 subjects. All of the chosen subjects were US Caucasians of Northern European origin living in Omaha, NE, USA, and its surrounding areas. They were normal healthy subjects defined by a comprehensive suite of exclusion criteria (48). Briefly, subjects with chronic diseases and conditions involving vital organs (heart, lung, liver, kidney and brain) and severe endocrine, metabolic or nutritional diseases that might affect fat metabolism were excluded from this study.
BMI was calculated as body weight (in kilograms) divided by the square of height (in meters). Weight was measured in light indoor clothing without shoes, using a calibrated balance beam scale, and height was measured using a calibrated stadiometer. Body fat mass was measured with Hologic 4500 DEXA machines. The short-term reproducibility (coefficient of variation) of BMI and fat mass measurements is on average 0.2 and 1.1%, respectively. The general relevant characteristics of the study subjects are shown in Table 6. Measurement of body fat mass by DEXA is considered to be highly accurate and gold standard (49). The correlation between BMI and fat mass was 0.85 (P < 0.01) in this sample.
Table 6.
Basic characteristics of the subjects
| US Caucasian sample | French adult case–control sample | |||||
|---|---|---|---|---|---|---|
| Trait | Male (n = 500) | Female (n = 500) | Status | Age (years) | BMI (kg/m2) | Males% |
| Age (years) | 59.7 (±14.9) | 58.1 (±15.8) | Cases | 44.0 (±12.0) | 47.0 (±7.5) | 30 |
| Height (m) | 1.77 (±0.07) | 1.64 (±0.06) | Controls | 51.0 (±10.0) | 22.8 (±2.0) | 40 |
| Weight (kg) | 89.07 (±15.44) | 71.38 (±15.88) | ||||
| BMI (kg/m2) | 28.92 (±4.30) | 27.29 (±5.98) | ||||
| Fat mass (kg) | 23.46 (±8.88) | 26.92 (±10.33) | ||||
French case–control sample
This sample contained 896 adult cases and 2916 adult controls of French Caucasian origin (see Table 6 for characteristics of the sample). This sample was used in a recent prominent GWA study (18), in which the FTO gene was found to contribute to obesity. The cases were class III obese adults defined by a BMI ≥ 40 kg/m2. The controls were lean adults defined by a BMI < 25 kg/m2. The obese individuals were recruited through a multimedia campaign run by the CNRS UMR8090 and the Department of Nutrition of the Paris Hotel Dieu Hospital. The controls were members of three cohorts: a cohort of middle-aged, lean adults comprising (DESIR) (n = 2041) volunteers recruited from 10 health examination centers in the western-central part of France; one sample of 382 controls that were recruited along with the cases in the multimedia campaign by the CNRS UMR8090; 493 lean young adults from the Haguenau study.
Genotyping
Affymetrix 500K SNPs in 1000 US Caucasians
Genomic DNA was extracted from whole human blood using a commercial isolation kit (Gentra systems, Minneapolis, MN, USA) following the protocols detailed in the kit. Before advancing to the genotyping step, the measurements of DNA concentration were double-checked by pico-green analysis that can detect fluorescent signal enhancement of PicoGreen® dsDNA Quantitation Reagent, which selectively binds to dsDNA (50,51). Genotyping with the Affymetrix Mapping 250K Nsp and Affymetrix Mapping 250K Sty arrays was performed at the Vanderbilt Microarray Shared Resource at Vanderbilt University Medical Center, Nashville, TN, USA, using the standard protocol recommended by the manufacturer. Briefly, for each array, 250 ng of genomic DNA was digested with either Nsp1 or Sty1 and ligated to adapters that recognize the cohesive four base pair overhangs. A generic primer that recognizes the ligated adapter sequence was used to amplify the ligation products in a polymerase chain reaction. The amplified DNA was assayed by agarose gel electrophoresis to verify an average size distribution of 250–1500 bp. The amplified DNA was purified per the manufacturer's protocol and quantitated by absorbance at 260 and 280 nm. Ninety micrograms of purified DNA was fragmented with DNaseI and visualized on a 4% agarose gel. Samples with fragment distributions <180 bp were hybridized to the appropriate array (Nsp or Sty). Arrays were stained, washed and scanned per the manufacturer's protocol using immunopure strepavidin (Pierce, Milwaukee, WI, USA), biotinylated antistreptavidin antibody (Vector Labs, Burlingame, CA, USA) and R-phycoerythrin strepavidin (Invitrogen, Carlsbad, CA, USA). Fluorescence intensities were quantitated using an Affymetrix array scanner 30007G. Data management and analyses were performed using Affymetrix GeneChip Operating System. Genotyping calls were determined from the fluorescent intensities using the DM algorithm with a 0.33 P-value setting (52) as well as the B-RLMM algorithm (53). DM calls were used for quality control, and the B-RLMM calls were used for all subsequent data analysis. B-RLMM clustering was performed with 94 samples per cluster.
The final average BRLMM call rate across the entire sample reached the high level of 99.14%. However, out of the initial full set of 500 568 SNPs, we discarded 32 961 SNPs with sample call rate <95%, another 36 965 SNPs with allele frequencies deviating from Hardy–Weinberg equilibrium (P < 0.001) and 51 323 SNPs with minor allele frequencies (MAF) <1%. Therefore, the final SNP set maintained in the subsequent analyses contained 379 319 SNPs, yielding an average marker spacing of ∼7.9 kb throughout the human genome.
Replication genotyping in French Caucasians
The five most significant SNPs within the CTNNBL1 gene (rs6013029, rs16986921, rs6020712, rs6020846 and rs6020395) were genotyped in the French case–control sample. These SNPs were genotyped using an allelic discrimination assay-by-design TaqMan method on ABI 7900 (Applied Biosystems). Among the total 3812 subjects, 266 subjects were excluded due to the low genotyping call rate. The average genotyping rate was 96%. The genotyping error rate was assessed by randomly re-genotyping 200 participants. The concordance rate was 100% for all the five SNPs.
Statistical analysis
Initial GWA in US Caucasians
GWA statistical analyses, including single-marker association analyses and haplotype association analyses, were performed using HelixTree 5.3.1 (Golden Helix, Bozeman, MT, USA). The association tests performed in the screen were allele-wised, that is, t-tests of one-degree of freedom. In association analyses, age, age2, sex, age-by-sex interaction and age2-by-sex interaction were included as covariates to adjust the BMI and fat mass data.
The LD patterns of the interested genes were analyzed and plotted using the Haploview program (24) and our own genotype data. To explore potential functions of the significant SNPs identified, we used the FASTSNP (function analysis and selection tool for SNPs) program (http://fastsnp.ibms.sinica.edu.tw) that analyzes SNP functions on the basis of up-to-date information extracted from 11 external bioinformatic databases at query time (54).
We calculated an FDR-based q value to measure the statistical significance at the genome-wide level for the association results. Bonferroni correction is overly conservative for multiple-testing adjustment in a GWA study since it does not take into account the intrinsic correlations between a large number of tests, which is caused by the extensive LD among SNP markers genome-wide. The FDR-based q value is a method that strikes a delicate balance between keeping meaningful results and maintaining a low rate of false-positive findings. There are multiple versions of FDR (55,56). In this study, we adopted the method proposed by Storey and Tibshirani (56) and used the related software QVALUE (http://genomine.org/qvalue/) to calculate q values. A range of tuning parameters (λ), from 0 to 0.95 with a step of 0.05, were screened, and the optimal λ was picked using the smoother method (56) to minimize the mean squared error of the estimates. We used an FDR threshold of q = 0.05 to control the genome-wide significance of the identified markers, which means that among all the markers called significant by this standard, only <5% of these may be truly ‘null’ on average. Therefore, our selection process for the most significant markers/genes based on the P-values and FDR q value was stringent yet also took into account a reasonable dynamic range of significance levels to allow for more interesting leads (such as multiple significant markers from a single gene) to emerge.
To facilitate interpretation of the results, we defined as ‘highly suggestive’ associations those markers with raw P-values <0.001. We compared our GWA results with several published GWA studies for obesity and related phenotypes. In addition, we compared the highly suggestive association results achieved here with our previous linkage findings (27).
To detect population stratification that may lead to spurious association results, we used the structured association method (28) to investigate the potential substructure of our sample. To ensure the robustness of our results, we performed nine independent analyses under each combination of two conditions, the assumed number of population strata, k, which was set at 2, 3 and 4, respectively, and the three different sets of unlinked markers selected randomly genome-wide, which contains 200, 2000 and 6000 markers, respectively. To further guard against potential population stratification that cannot be identified by STRUCTURE (28), we performed analyses using the principal component analysis method implemented in EIGENSTRAT (29). We also calculated the overall GC correction factors and the GC-corrected P-values.
To investigate whether the identified associations are due to potential biases (e.g. genotyping error), we examined the distribution of P-values for all 379 319 SNPs analyzed in our sample using Q–Q plots.
Replication analyses in the French case–control sample
We used logistic regression analyses to test association in case–controls under an additive model, and Pearson’s χ2 for the general association model. The P-values for replication are one-sided because we test the specific hypothesis of increased frequency of alleles in these SNPs in obese adults.
SUPPLEMENTARY MATERIAL
FUNDING
Collection of the US Caucasian sample was partially supported by grants from NIH (R01 AR050496-01, R21 AG027110, R01 AG026564 and P50 AR055081). The study also benefited from grants from National Science Foundation of China, Huo Ying Dong Education Foundation, HuNan Province, Xi'an Jiaotong University and the Ministry of Education of China. The recruitment of French obese cases was supported by both Assistance-Publique Hôpitaux de Paris and Centre National de la Recherche Scientifique.
Supplementary Material
ACKNOWLEDGEMENTS
We wish to thank Dr Beverley Balkau and the DESIR consortium as well as Dr Claire Lévy-Marchal, who recruited a proportion of the French study lean controls. We thank Emmanuelle Durand, Jérôme Delplanque and Stefan Gaget for the technical support on replication SNP genotyping in the French case–control sample.
Conflict of Interest statement. None declared.
REFERENCES
- 1.Kopelman P.G. Obesity as a medical problem. Nature. 2000;404:635–643. doi: 10.1038/35007508. [DOI] [PubMed] [Google Scholar]
- 2.Ogden C.L., Carroll M.D., Curtin L.R., McDowell M.A., Tabak C.J., Flegal K.M. Prevalence of overweight and obesity in the United States, 1999–2004. JAMA. 2006;295:1549–1555. doi: 10.1001/jama.295.13.1549. [DOI] [PubMed] [Google Scholar]
- 3.Bell C.G., Walley A.J., Froguel P. The genetics of human obesity. Nat. Rev. Genet. 2005;6:221–234. doi: 10.1038/nrg1556. [DOI] [PubMed] [Google Scholar]
- 4.Rankinen T., Zuberi A., Chagnon Y.C., Weisnagel S.J., Argyropoulos G., Walts B., Perusse L., Bouchard C. The human obesity gene map: the 2005 update. Obesity. 2006;14:529–644. doi: 10.1038/oby.2006.71. [DOI] [PubMed] [Google Scholar]
- 5.Hirschhorn J.N., Daly M.J. Genome-wide association studies for common diseases and complex traits. Nat. Rev. Genet. 2005;6:95–108. doi: 10.1038/nrg1521. [DOI] [PubMed] [Google Scholar]
- 6.Genome-wide association study of 14,000 cases of seven common diseases and 3,000 shared controls. Nature. 2007;447:661–678. doi: 10.1038/nature05911. [DOI] [PMC free article] [PubMed] [Google Scholar]
- 7.Saxena R., Voight B.F., Lyssenko V., Burtt N.P., de Bakker P.I., Chen H., Roix J.J., Kathiresan S., Hirschhorn J.N., Daly M.J., et al. Genome-wide association analysis identifies loci for type 2 diabetes and triglyceride levels. Science. 2007;316:1331–1336. doi: 10.1126/science.1142358. [DOI] [PubMed] [Google Scholar]
- 8.Scott L.J., Mohlke K.L., Bonnycastle L.L., Willer C.J., Li Y., Duren W.L., Erdos M.R., Stringham H.M., Chines P.S., Jackson A.U., et al. A genome-wide association study of type 2 diabetes in Finns detects multiple susceptibility variants. Science. 2007;316:1341–1345. doi: 10.1126/science.1142382. [DOI] [PMC free article] [PubMed] [Google Scholar]
- 9.Sladek R., Rocheleau G., Rung J., Dina C., Shen L., Serre D., Boutin P., Vincent D., Belisle A., Hadjadj S., et al. A genome-wide association study identifies novel risk loci for type 2 diabetes. Nature. 2007;445:881–885. doi: 10.1038/nature05616. [DOI] [PubMed] [Google Scholar]
- 10.Duerr R.H., Taylor K.D., Brant S.R., Rioux J.D., Silverberg M.S., Daly M.J., Steinhart A.H., Abraham C., Regueiro M., Griffiths A., et al. A genome-wide association study identifies IL23R as an inflammatory bowel disease gene. Science. 2006;314:1461–1463. doi: 10.1126/science.1135245. [DOI] [PMC free article] [PubMed] [Google Scholar]
- 11.Hampe J., Franke A., Rosenstiel P., Till A., Teuber M., Huse K., Albrecht M., Mayr G., De L.V., Briggs J., et al. A genome-wide association scan of nonsynonymous SNPs identifies a susceptibility variant for Crohn disease in ATG16L1. Nat. Genet. 2007;39:207–211. doi: 10.1038/ng1954. [DOI] [PubMed] [Google Scholar]
- 12.Gudmundsson J., Sulem P., Manolescu A., Amundadottir L.T., Gudbjartsson D., Helgason A., Rafnar T., Bergthorsson J.T., Agnarsson B.A., Baker A., et al. Genome-wide association study identifies a second prostate cancer susceptibility variant at 8q24. Nat. Genet. 2007;39:631–637. doi: 10.1038/ng1999. [DOI] [PubMed] [Google Scholar]
- 13.Yeager M., Orr N., Hayes R.B., Jacobs K.B., Kraft P., Wacholder S., Minichiello M.J., Fearnhead P., Yu K., Chatterjee N., et al. Genome-wide association study of prostate cancer identifies a second risk locus at 8q24. Nat. Genet. 2007;39:645–649. doi: 10.1038/ng2022. [DOI] [PubMed] [Google Scholar]
- 14.Herbert A., Gerry N.P., McQueen M.B., Heid I.M., Pfeufer A., Illig T., Wichmann H.E., Meitinger T., Hunter D., Hu F.B., et al. A common genetic variant is associated with adult and childhood obesity. Science. 2006;312:279–283. doi: 10.1126/science.1124779. [DOI] [PubMed] [Google Scholar]
- 15.Lyon H.N., Emilsson V., Hinney A., Heid I.M., Lasky-Su J., Zhu X., Thorleifsson G., Gunnarsdottir S., Walters G.B., Thorsteinsdottir U., et al. The association of a SNP upstream of INSIG2 with body mass index is reproduced in several but not all cohorts. PLoS Genet. 2007;3:e61. doi: 10.1371/journal.pgen.0030061. [DOI] [PMC free article] [PubMed] [Google Scholar]
- 16.Frayling T.M., Timpson N.J., Weedon M.N., Zeggini E., Freathy R.M., Lindgren C.M., Perry J.R., Elliott K.S., Lango H., Rayner N.W., et al. A common variant in the FTO gene is associated with body mass index and predisposes to childhood and adult obesity. Science. 2007;316:889–894. doi: 10.1126/science.1141634. [DOI] [PMC free article] [PubMed] [Google Scholar]
- 17.Scuteri A., Sanna S., Chen W.M., Uda M., Albai G., Strait J., Najjar S., Nagaraja R., Orru M., Usala G., et al. Genome-wide association scan shows genetic variants in the FTO gene are associated with obesity-related traits. PLoS Genet. 2007;20:e115. doi: 10.1371/journal.pgen.0030115. [DOI] [PMC free article] [PubMed] [Google Scholar]
- 18.Dina C., Meyre D., Gallina S., Durand E., Korner A., Jacobson P., Carlsson L.M., Kiess W., Vatin V., Lecoeur C., et al. Variation in FTO contributes to childhood obesity and severe adult obesity. Nat. Genet. 2007;39:724–726. doi: 10.1038/ng2048. [DOI] [PubMed] [Google Scholar]
- 19.The International HapMap Project. Nature. 2003;426:789–796. doi: 10.1038/nature02168. [DOI] [PubMed] [Google Scholar]
- 20.Frazer K.A., Ballinger D.G., Cox D.R., Hinds D.A., Stuve L.L., Gibbs R.A., Belmont J.W., Boudreau A., Hardenbol P., Leal S.M., et al. A second generation human haplotype map of over 3.1 million SNPs. Nature. 2007;449:851–861. doi: 10.1038/nature06258. [DOI] [PMC free article] [PubMed] [Google Scholar]
- 21.Frazer K.A., Ballinger D.G., Cox D.R., Hinds D.A., Stuve L.L., Gibbs R.A., Belmont J.W., Boudreau A., Hardenbol P., Leal S.M., et al. A second generation human haplotype map of over 3.1 million SNPs. Nature. 2007;449:851–861. doi: 10.1038/nature06258. [DOI] [PMC free article] [PubMed] [Google Scholar]
- 22.Marchini J., Howie B., Myers S., McVean G., Donnelly P. A new multipoint method for genome-wide association studies by imputation of genotypes. Nat. Genet. 2007;39:906–913. doi: 10.1038/ng2088. [DOI] [PubMed] [Google Scholar]
- 23.Gabriel S.B., Schaffner S.F., Nguyen H., Moore J.M., Roy J., Blumenstiel B., Higgins J., DeFelice M., Lochner A., Faggart M., et al. The structure of haplotype blocks in the human genome. Science. 2002;296:2225–2229. doi: 10.1126/science.1069424. [DOI] [PubMed] [Google Scholar]
- 24.Barrett J.C., Fry B., Maller J., Daly M.J. Haploview: analysis and visualization of LD and haplotype maps. Bioinformatics. 2005;21:263–265. doi: 10.1093/bioinformatics/bth457. [DOI] [PubMed] [Google Scholar]
- 25.Purcell S., Cherny S.S., Sham P.C. Genetic Power Calculator: design of linkage and association genetic mapping studies of complex traits. Bioinformatics. 2003;19:149–150. doi: 10.1093/bioinformatics/19.1.149. [DOI] [PubMed] [Google Scholar]
- 26.Killeen P.R. An alternative to null-hypothesis significance tests. Psychol. Sci. 2005;16:345–353. doi: 10.1111/j.0956-7976.2005.01538.x. [DOI] [PMC free article] [PubMed] [Google Scholar]
- 27.Zhao L.J., Xiao P., Liu Y.J., Xiong D.H., Shen H., Recker R.R., Deng H.W. A genome-wide linkage scan for quantitative trait loci underlying obesity related phenotypes in 434 Caucasian families. Hum. Genet. 2007;121:145–148. doi: 10.1007/s00439-006-0286-y. [DOI] [PubMed] [Google Scholar]
- 28.Pritchard J.K., Rosenberg N.A. Use of unlinked genetic markers to detect population stratification in association studies. Am. J. Hum. Genet. 1999;65:220–228. doi: 10.1086/302449. [DOI] [PMC free article] [PubMed] [Google Scholar]
- 29.Price A.L., Patterson N.J., Plenge R.M., Weinblatt M.E., Shadick N.A., Reich D. Principal components analysis corrects for stratification in genome-wide association studies. Nat. Genet. 2006;38:904–909. doi: 10.1038/ng1847. [DOI] [PubMed] [Google Scholar]
- 30.Jabbour L., Welter J.F., Kollar J., Hering T.M. Sequence, gene structure, and expression pattern of CTNNBL1, a minor-class intron- containing gene—evidence for a role in apoptosis. Genomics. 2003;81:292–303. doi: 10.1016/s0888-7543(02)00038-1. [DOI] [PubMed] [Google Scholar]
- 31.Kikuchi A. Regulation of beta-catenin signaling in the Wnt pathway. Biochem. Biophys. Res. Commun. 2000;268:243–248. doi: 10.1006/bbrc.1999.1860. [DOI] [PubMed] [Google Scholar]
- 32.Moon R.T., Bowerman B., Boutros M., Perrimon N. The promise and perils of Wnt signaling through beta-catenin. Science. 2002;296:1644–1646. doi: 10.1126/science.1071549. [DOI] [PubMed] [Google Scholar]
- 33.Ross S.E., Hemati N., Longo K.A., Bennett C.N., Lucas P.C., Erickson R.L., MacDougald O.A. Inhibition of adipogenesis by Wnt signaling. Science. 2000;289:950–953. doi: 10.1126/science.289.5481.950. [DOI] [PubMed] [Google Scholar]
- 34.Schmitz G., Langmann T. Metabolic learning in the intestine: adaptation to nutrition and luminal factors. Horm. Metab. Res. 2006;38:452–454. doi: 10.1055/s-2006-947841. [DOI] [PubMed] [Google Scholar]
- 35.Grant S.F., Thorleifsson G., Reynisdottir I., Benediktsson R., Manolescu A., Sainz J., Helgason A., Stefansson H., Emilsson V., Helgadottir A., et al. Variant of transcription factor 7-like 2 (TCF7L2) gene confers risk of type 2 diabetes. A genome-wide association study identifies novel risk loci for type 2 diabetes. Nature. 2007;445:881–885. doi: 10.1038/ng1732. [DOI] [PubMed] [Google Scholar]
- 36.Freathy R.M., Weedon M.N., Bennett A., Hypponen E., Relton C.L., Knight B., Shields B., Parnell K.S., Groves C.J., Ring S.M., et al. Type 2 diabetes TCF7L2 risk genotypes alter birth weight: a study of 24,053 individuals. Am. J. Hum. Genet. 2007;80:1150–1161. doi: 10.1086/518517. [DOI] [PMC free article] [PubMed] [Google Scholar]
- 37.Dina C., Meyre D., Samson C., Tichet J., Marre M., Jouret B., Charles M.A., Balkau B., Froguel P. Comment on ‘A common genetic variant is associated with adult and childhood obesity. Science. 2007;315:187. doi: 10.1126/science.1129402. [DOI] [PubMed] [Google Scholar]
- 38.Loos R.J., Barroso I., O'Rahilly S., Wareham N.J. Comment on ‘A common genetic variant is associated with adult and childhood obesity. Science. 2007;315:187. doi: 10.1126/science.1130012. [DOI] [PMC free article] [PubMed] [Google Scholar]
- 39.Hall D.H., Rahman T., Avery P.J., Keavney B. INSIG-2 promoter polymorphism and obesity related phenotypes: association study in 1428 members of 248 families. BMC Med. Genet. 2006;7:83. doi: 10.1186/1471-2350-7-83. [DOI] [PMC free article] [PubMed] [Google Scholar]
- 40.Rosskopf D., Bornhorst A., Rimmbach C., Schwahn C., Kayser A., Kruger A., Tessmann G., Geissler I., Kroemer H.K., Volzke H. Comment on ‘A common genetic variant is associated with adult and childhood obesity. Science. 2007;315:187. doi: 10.1126/science.1130571. [DOI] [PubMed] [Google Scholar]
- 41.Colhoun H.M., McKeigue P.M., Davey S.G. Problems of reporting genetic associations with complex outcomes. Lancet. 2003;361:865–872. doi: 10.1016/s0140-6736(03)12715-8. [DOI] [PubMed] [Google Scholar]
- 42.Ioannidis J.P., Patsopoulos N.A., Evangelou E. Heterogeneity in meta-analyses of genome-wide association investigations. PLoS ONE. 2007;2:e841. doi: 10.1371/journal.pone.0000841. [DOI] [PMC free article] [PubMed] [Google Scholar]
- 43.Evangelou E., Maraganore D.M., Ioannidis J.P. Meta-analysis in genome-wide association datasets: strategies and application in Parkinson disease. PLoS ONE. 2007;2:e196. doi: 10.1371/journal.pone.0000196. [DOI] [PMC free article] [PubMed] [Google Scholar]
- 44.Chanock S.J., Manolio T., Boehnke M., Boerwinkle E., Hunter D.J., Thomas G., Hirschhorn J.N., Abecasis G., Altshuler D., Bailey-Wilson J.E., et al. Replicating genotype-phenotype associations. Nature. 2007;447:655–660. doi: 10.1038/447655a. [DOI] [PubMed] [Google Scholar]
- 45.Wacholder S., Chanock S., Garcia-Closas M., El Ghormli L., Rothman N. Assessing the probability that a positive report is false: an approach for molecular epidemiology studies. J. Natl Cancer Inst. 2004;96:434–442. doi: 10.1093/jnci/djh075. [DOI] [PMC free article] [PubMed] [Google Scholar]
- 46.Wakefield J. A Bayesian measure of the probability of false discovery in genetic epidemiology studies. Am. J. Hum. Genet. 2007;81:208–227. doi: 10.1086/519024. [DOI] [PMC free article] [PubMed] [Google Scholar]
- 47.Deng H.W. Population admixture may appear to mask, change or reverse genetic effects of genes underlying complex traits. Genetics. 2001;159:1319–1323. doi: 10.1093/genetics/159.3.1319. [DOI] [PMC free article] [PubMed] [Google Scholar]
- 48.Deng H.W., Deng H., Liu Y.J., Liu Y.Z., Xu F.H., Shen H., Conway T., Li J.L., Huang Q.Y., Davies K.M., Recker R.R. A genomewide linkage scan for quantitative-trait loci for obesity phenotypes. Am. J. Hum. Genet. 2002;70:1138–1151. doi: 10.1086/339934. [DOI] [PMC free article] [PubMed] [Google Scholar]
- 49.Bray B.A., Bouchard C., James W.P. Marcel Dekker, NY: 1997. [Google Scholar]
- 50.Ahn S.J., Costa J., Emanuel J.R. PicoGreen quantitation of DNA: effective evaluation of samples pre- or post-PCR. Nucleic Acids Res. 1996;24:2623–2625. doi: 10.1093/nar/24.13.2623. [DOI] [PMC free article] [PubMed] [Google Scholar]
- 51.Singer V.L., Jones L.J., Yue S.T., Haugland R.P. Characterization of PicoGreen reagent and development of a fluorescence-based solution assay for double-stranded DNA quantitation. Anal. Biochem. 1997;249:228–238. doi: 10.1006/abio.1997.2177. [DOI] [PubMed] [Google Scholar]
- 52.Di X., Matsuzaki H., Webster T.A., Hubbell E., Liu G., Dong S., Bartell D., Huang J., Chiles R., Yang G., et al. Dynamic model based algorithms for screening and genotyping over 100 K SNPs on oligonucleotide microarrays. Bioinformatics. 2005;21:1958–1963. doi: 10.1093/bioinformatics/bti275. [DOI] [PubMed] [Google Scholar]
- 53.Rabbee N., Speed T.P. A genotype calling algorithm for affymetrix SNP arrays. Bioinformatics. 2006;22:7–12. doi: 10.1093/bioinformatics/bti741. [DOI] [PubMed] [Google Scholar]
- 54.Yuan H.Y., Chiou J.J., Tseng W.H., Liu C.H., Liu C.K., Lin Y.J., Wang H.H., Yao A., Chen Y.T., Hsu C.N. FASTSNP: an always up-to-date and extendable service for SNP function analysis and prioritization. Nucleic Acids Res. 2006;34:W635–W641. doi: 10.1093/nar/gkl236. [DOI] [PMC free article] [PubMed] [Google Scholar]
- 55.Benjamini Y. Controlling the false discovery rate: a practical and powerful approach to multiple testing. J. R. Stat. Soc. Ser. B. 1995;57:289–300. [Google Scholar]
- 56.Storey J.D., Tibshirani R. Statistical significance for genomewide studies. Proc. Natl Acad. Sci. USA. 2003;100:9440–9445. doi: 10.1073/pnas.1530509100. [DOI] [PMC free article] [PubMed] [Google Scholar]
Associated Data
This section collects any data citations, data availability statements, or supplementary materials included in this article.