Abstract
Apoptosis of tubular epithelial cells contributes to the tubular atrophy that accompanies diabetic nephropathy. Reactive oxygen species (ROS) promote tubular apoptosis, but the mechanisms by which this occurs are incompletely understood. Here, we sought proapoptotic genes that ROS differentially upregulate in renal proximal tubular cells of diabetic (db/db) mice. We performed microarray analysis using total RNA from freshly isolated renal proximal tubules of nondiabetic, diabetic, and diabetic transgenic mice overexpressing catalase in the proximal tubule (thereby attenuating ROS). We observed greater expression of caspase-12 in the proximal tubules of the diabetic mice compared with the nondiabetic and diabetic transgenic mice. Quantitative PCR and immunohistochemistry confirmed the enhanced expression of caspase-12, as well as members of the endoplasmic reticulum stress–induced apoptotic pathway. Ex vivo, albumin induced caspase-12 activity and expression (protein and mRNA) and mRNA expression of the CCAT/enhancer-binding protein homologous protein in freshly isolated wild-type proximal tubules but not in catalase-overexpressing proximal tubules. In vitro, albumin stimulated activity of both caspase-12 and caspase-3 as well as expression of caspase-12 and CCAT/enhancer-binding protein homologous protein in a human proximal tubule cell line (HK-2). The free radical scavenger tiron inhibited these effects. Furthermore, knockdown of caspase-12 with small interfering RNA reduced albumin-induced apoptosis in HK-2 cells. Taken together, these studies demonstrate that albuminuria may induce tubular apoptosis through generation of ROS and the subsequent expression and activation of endoplasmic reticulum stress genes in the diabetic kidney.
Diabetic nephropathy (DN) is the leading cause of ESRD.1–5 Although glomerular lesions are central in initiating kidney damage, studies within the past three decades have demonstrated that tubulointerstitial fibrosis and tubular atrophy play a key role in nephropathy progression, leading to ESRD.6–12
The underlying mechanism(s) of tubular atrophy in diabetes, however, are incompletely delineated. One attractive mechanism is apoptosis, which has been demonstrated to mediate cell death in a variety of renal diseases, including DN.13–16 Indeed, apoptosis was detected in renal proximal tubular cells (RPTCs) of mice,13,17 rats,18 and patients with diabetes,6,19 suggesting that tubular apoptosis may precede tubular atrophy in diabetes.
Reactive oxygen species (ROS) mediate renal cell apoptosis induced by hyperglycemia, angiotensin II, and albumin.9,10,12–14,17,18 High glucose induced ROS generation and stimulated renin-angiotensin system gene expression in RPTCs.20–23 Furthermore, transgenic (Tg) mice overexpressing rat catalase (CAT) in their RPTCs exhibited attenuated ROS generation, hypertension, and tubular apoptosis in diabetic kidneys in vivo,13,14 supporting an important role for ROS in tubular apoptosis in diabetes.
This study aimed to identify proapoptotic genes that are differentially upregulated by ROS in RPTCs of type 2 diabetic db/db mice by using DNA chip microarray. Caspase-12, an endoplasmic reticulum (ER) stress–induced proapoptotic gene, was differentially upregulated in RPTCs of db/db mice. Increased caspase-12 expression in RPTCs was confirmed by immunohistochemistry and real-time quantitative-PCR (RT-qPCR). Finally, we also demonstrated that albumin induced caspase-12 expression and RPTC apoptosis, and its action was mediated, at least in part, via ROS generation.
Results
Physiologic Parameters in Tg Mice
Consistent with our previous data,14 there were significant differences in body weight, blood glucose level, and systolic BP (SBP) but not in the albumin-to-creatinine ratio (ACR) in 12-week-old male db/db mice as compared with db/m+ and db/db CAT-Tg mice (Table 1). SBP, body weight, blood glucose level, and ACR were significantly higher in 20-week-old male db/db mice than in db/m+ mice (Table 2). Conversely, db/db CAT-Tg mice had higher body weight and blood glucose level than db/m+ mice but exhibited normal SBP and attenuated ACR as compared with db/db mice (Tables 1 and 2). These results indicate that CAT overexpression in RPTCs effectively prevented hypertension and attenuated albuminuria in db/db mice.
Table 1.
Physiologic parameters of mice at age 12 weeks
| Parameter | Body Weight (g) | Blood Glycemia (mM) | SBP (mmHg) | ACR (μg/mg) |
|---|---|---|---|---|
| db/m+ | 24.5 ± 1.1 | 12.8 ± 2.3 | 115 ± 5 | 1.73 ± 1.14 |
| CAT-Tg | 26.9 ± 3.7 | 13.7 ± 2.2 | 106 ± 5 | 0.30 ± 0.27 |
| db/db | 47.5 ± 2.2a | 28.6 ± 5.0a | 134 ± 9b | 1.35 ± 0.44 |
| db/db CAT-Tg | 49.7 ± 3.2a | 29.6 ± 3.0b | 111 ± 8c | 3.03 ± 1.61 |
aP < 0.001.
bP < 0.01.
cP < 0.05 versus db/db.
Table 2.
Physiologic parameters of mice at age 20 weeks
| Parameter | Body Weight (g) | Blood Glycemia (mM) | Kidney Weight (g) | Kidney/Body Weight (g/g) | SBP (mmHg) | ACR (μg/mg) |
|---|---|---|---|---|---|---|
| db/m+ | 29.2 ± 1.4 | 11.5 ± 1.0 | 0.330 ± 0.030 | 0.0100 ± 0.0010 | 108 ± 8 | 0.98 ± 0.71 |
| CAT-Tg | 32.1 ± 4.8 | 12.7 ± 1.5 | 0.430 ± 0.050 | 0.0130 ± 0.0047 | 112 ± 7 | 1.09 ± 0.23 |
| db/db | 56.4 ± 2.0a | 27.1 ± 4.6b | 0.450 ± 0.035 | 0.0080 ± 0.0006 | 131 ± 8c | 16.00 ± 3.71a |
| db/db CAT-Tg | 59.0 ± 2.9a | 18.8 ± 5.2c | 0.460 ± 0.078 | 0.0078 ± 0.0015 | 118 ± 1d | 10.00 ± 1.23a,d |
aP < 0.001.
bP < 0.01.
cP < 0.05 versus db/m+.
dP < 0.05 versus db/db.
Gene Chip Microarray Analysis
Data were normalized from the various probe sets on the chips for analysis. Gene Ontology database was used to screen for the probe sets involved in the apoptotic processes and that resulted in a list of eight upregulated apoptotic genes in db/db mice, compared with db/m+ and db/db CAT-Tg mice based on a value of P < 0.01 (Table 3).
Table 3.
Gene ontology
| Gene Title | Abbreviation | db/m+ versus db/db |
db/db versus db/db CAT-Tg |
Average Expression | ||
|---|---|---|---|---|---|---|
| Fold (log) | P | Fold (log) | P | |||
| Baculoviral IAP repeat-containing 4 | Birc4 | −0.358 | 0.004 | 0.368 | 0.004 | 2.787 |
| Bcl2 modifying factor | Bmf | −1.617 | 0.010 | 1.617 | 0.010 | 4.953 |
| Caspase-12 | Casp12 | −0.865 | 0.007 | 0.857 | 0.007 | 3.221 |
| E2F transcription factor 1 | E2f1 | −0.249 | 0.007 | 0.246 | 0.006 | 2.939 |
| Neurotrophic tyrosine kinase, receptor, type 2 | Ntrk2 | −0.606 | 0.002 | 0.574 | 0.002 | 2.717 |
| Purinergic receptor P2X, ligand-gated ion channel, 1 | P2rx1 | −1.958 | 0.011 | 2.303 | 0.008 | 2.939 |
| Tial 1 cytotoxic granule–associated RNA binding protein-like 1 | Tial1 | −0.481 | 0.011 | 0.638 | 0.007 | 6.886 |
| Tnf receptor–associated factor 1 | Traf1 | −0.936 | 0.009 | 0.949 | 0.009 | 2.818 |
Validation of Caspase-12 Expression in Mouse Kidneys by RT-PCR and Immunohistochemistry
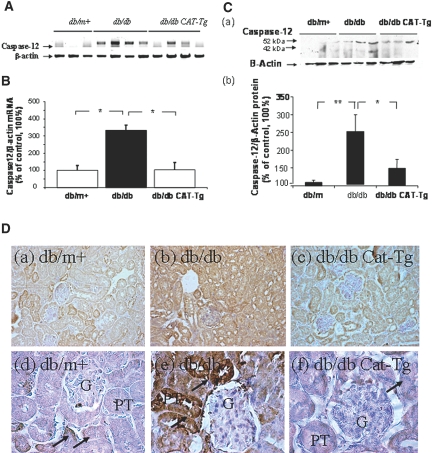
Conventional RT-PCR and RT-qPCR for mouse caspase-12 mRNA expression were used to validate DNA microarray findings (Figure 1, A and B, respectively). Baseline expression of caspase-12 mRNA in 20-week-old db/db mice was threefold higher as compared with db/m+ by RT-qPCR (Figure 1B). This increase was significantly (P < 0.05) attenuated in db/db CAT-Tg mice. Immunoblotting of caspase-12 confirms the upregulation of caspase-12 expression in 20-week-old db/db mice as compared with db/m+ but normalized in db/db CAT-Tg mice (Figure 1C).
Figure 1.
Caspase-12 expression is validated in mouse kidneys at week 20. (A) Southern blotting of conventional RT-PCR analysis of caspase-12 mRNA expression in RPTs of db/m+, db/db, and db/db CAT-Tg mice. (B) RT-qPCR analysis of mouse caspase-12 mRNA expression in RPTs of db/m+ (wt), db/db, and db/db CAT-Tg mice. Caspase-12 mRNA levels in db/m+ mice were considered as 100%. Each point represents the mean ± SD of six animals. *P < 0.05; **P < 0.01. (C, a) Immunoblotting (antibody from Cell Signaling) of mouse caspase-12 protein expression in RPTs of db/m+ (wt), db/db (db), and db/db CAT-Tg (db-Cat) mice. (b) Densitometry of the data in a. (D) Immunohistochemical staining for caspase-12 in db/m+, db/db, and db/db CAT-Tg mouse kidneys, using rabbit anti–caspase-12 polyclonal antibodies (antibody from eBioscience). Arrows indicate caspase-12 immunopositive cells in proximal tubules. Magnifications: ×200 in D, a through c; ×600 in D, d through f.
Immunohistochemistry revealed caspase-12 expression in the distal tubules but in very few renal proximal tubules (RPTs) of db/m+ mouse kidneys (Figure 1D, a). RPTs near the glomeruli (proximal convoluted tubules) stained negative for caspase-12, whereas proximal straight tubules stained positive (Figure 1D, d); however, increased immunostaining for caspase-12 in the convoluted segment of RPTs was apparent in diabetic db/db mice (Figure 1D, b and e), compared with nondiabetic db/m+ controls (Figure 1D, a and d). CAT overexpression effectively attenuated caspase-12 expression in RPTs of db/db CAT-Tg mice (Figure 1D, c and f).
Apoptotic RPTs Express Caspase-12
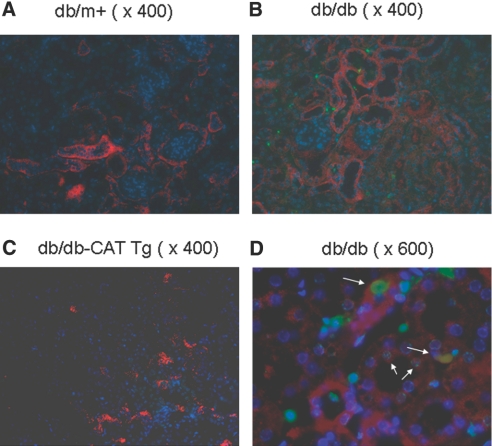
Immunofluorescence analysis of caspase-12 expression and terminal transferase-mediated deoxyuridine triphosphate nick end-labeling (TUNEL) assay in 20-week-old mouse kidneys revealed that db/db mice (Figure 2b) had a much greater number of apoptotic cells than db/m+ (Figure 2a) and db/db Cat-Tg mice (Figure 2c). Magnification at ×600 in db/db mice demonstrated that RPTs overexpressing caspase-12 contained TUNEL-positive apoptotic cells (Figure 2d).
Figure 2.
Caspase-12 expression and apoptotic cells are localized in mouse kidneys at week 20. Twenty-week-old mouse kidneys were sectioned and subjected to TUNEL assay to visualize apoptotic cells (green) and then incubated with anti–caspase-12 antibody (eBioscience) followed by anti-rabbit AlexaFluor 555 to demonstrate caspase-12 expression (red). Cells staining positively for TUNEL and caspase-12 appear yellow. Nuclei were stained with DAPI (blue). (a through c) Kidneys from db/m+ mouse kidney (a), db/db mouse kidney (b), and db/db-CAT Tg (c) mice. Kidneys were first stained with TUNEL and then incubated with anti–caspase-12 antibody. (d) higher magnification of b. Arrows indicate cells that stained positively for TUNEL and caspase-12. Magnification, ×400 in a through c; ×600 in d.
Caspase-12 Expression Is ER Stress Dependent
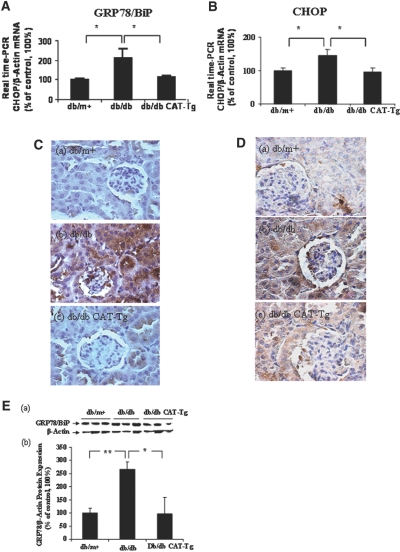
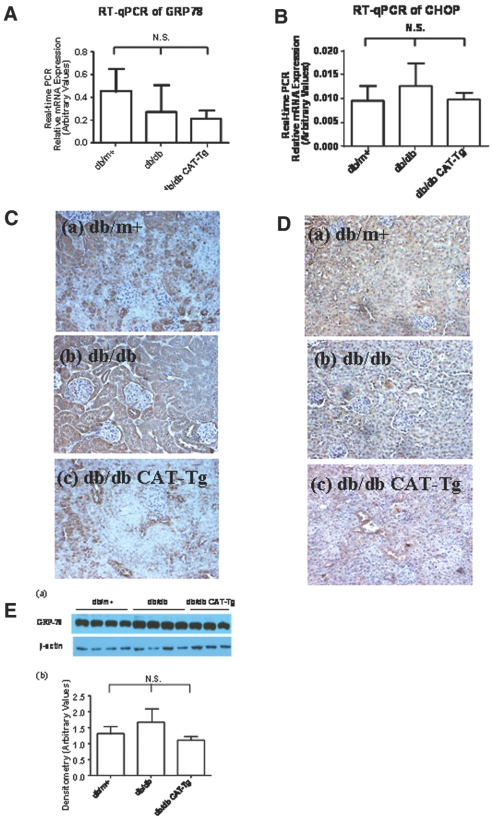
Because ER stress induces caspase-12 expression,24–32 we investigated the expression of ER chaperone 78-kD glucose-regulated protein/Ig heavy chain–binding protein (GRP78/BiP), an ER stress marker and an ER stress–inducible proapoptotic gene, CCAT/enhancer-binding protein homologous protein (CHOP), in our model. GRP78/BiP and CHOP mRNA expression in RPTs of 20-week-old db/db mice were significantly increased as compared with db/m+ (P < 0.05) by RT-qPCR (Figure 3, A and B). This increase was significantly (P < 0.05) attenuated in db/db CAT-Tg mice. Consistently, immunostaining showed marked increases in GRP78/BiP (Figure 3C, b) and CHOP (Figure 3D, b) expression in RPTs of db/db mice as compared with db/m+ mice (Figure 3, C, a, and D, a). Once again, CAT overexpression effectively attenuated these changes (Figure 3, C, c, and D, c). These results demonstrate parallel expression of GRP78/BiP, CHOP, and caspase-12 in RPTCs of db/db mice. Moreover, immunoblotting of GRP78/BiP confirmed upregulation of GRP78/BiP expression in 20-week-old db/db mice as compared with db/m+ but attenuated in db/db CAT-Tg mice (Figure 3E). Because CHOP could not be detected in RPTs of 20-week-old db/db mice by immunoblotting using the same antibody as in immunohistochemistry (Supplemental Figure A, a), CHOP immunoblotting is not shown for subsequent experiments.
Figure 3.
GRP78/BiP and CHOP are expressed in mouse kidneys at week 20. (A and B) RPTs from mouse kidneys were isolated and assayed by RT-qPCR for GRP78/BiP (A) and CHOP (B) mRNA. The relative densities of GRP78/BiP and CHOP mRNA were normalized with β-actin mRNA control. GRP78/BiP and CHOP mRNA levels in db/m+ mice were considered as 100%. Each point represents the mean ± SD of six animals. *P < 0.05. (C and D) Immunostaining for GRP78/BiP (C) and CHOP (D) expression in mouse kidneys at 20 weeks. (E, a) Immunoblotting of mouse GRP78/BiP protein expression in RPTs of db/m+, db/db, and db/db CAT-Tg mice. (b) Densitometry of the data in a. Each bar represents the mean ± SD of at least three animals. *P < 0.05; **P < 0.01. Magnification, ×600 in C and D.
Albumin Induces Caspase-12 and CHOP but not GRP78/BiP Expression in 12-Week-Old Mice
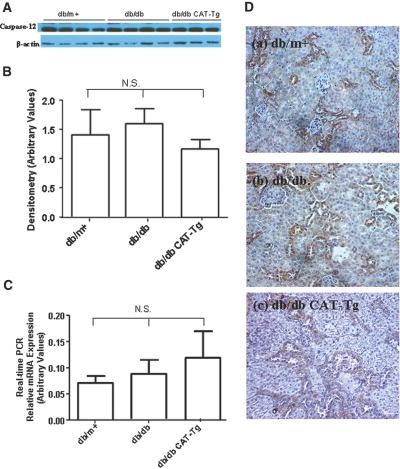
High concentrations of albumin have been implicated in the induction of caspase-12 expression and apoptosis in RPTCs in vitro.31,33,34 To investigate the correlation of albuminuria with caspase-12, GRP78/BiP, and CHOP expression in vivo in RPTs, we examined caspase-12, GRP78/BiP, and CHOP protein and mRNA expression in RPTs as well as in kidney sections of 12-week-old animals. Immunoblotting (Figure 4, A and B) and RT-qPCR (Figure 4C) as well as immunostaining (Figure 4D) showed no significant differences in caspase-12 protein and mRNA expression in db/m+, db/db, and db/db CAT-Tg mice. Likewise, no significant differences could be detected in GRP78/BiP and CHOP mRNA expression (Figure 5, A and B) and protein expression (Figure 5, C and D) and GRP78/BiP expression (Figure 5E) in 12-week-old mice. Thus, the differences in caspase-12, CHOP, and GRP78/BiP expression observed at 20 weeks of age were likely due to increased ACR in the db/db and db/db Cat-Tg mice compared with db/m+ and Cat-Tg mice (Tables 1 and 2).
Figure 4.
Caspase-12 is expressed in 12-week-old mouse kidneys. (A) Immunoblotting of caspase-12 protein expression. Each lane represents a different mouse. (B) Densitometry of the data in A. (C) RT-qPCR data showing caspase-12 mRNA expression from db/m+, db/db, and db/db CAT-Tg mice. Each bar represents the mean ± SD of at least three animals. (D) Immunostaining of caspase-12 expression. Magnification, ×200 in D.
Figure 5.
GRP-78/BiP and CHOP are expressed in 12-week-old mouse kidneys. (A and B) RT-qPCR data showing GRP78/BiP (A) and CHOP (B) mRNA expression from db/m+, db/db, and db/db CAT-Tg mice. Each bar represents the mean ± SD of at least three animals. (C and D) Immunostaining of GRP78/BiP (C) and CHOP (D) expression in mouse kidneys. (E, a) Immunoblotting of GRP78/BiP protein expression. Each lane represents a different mouse. (b) Densitometry of the data in a. Magnification, ×200 in C and D.
Albumin Induces ROS Generation and Caspase-12 and CHOP Expression Ex Vivo
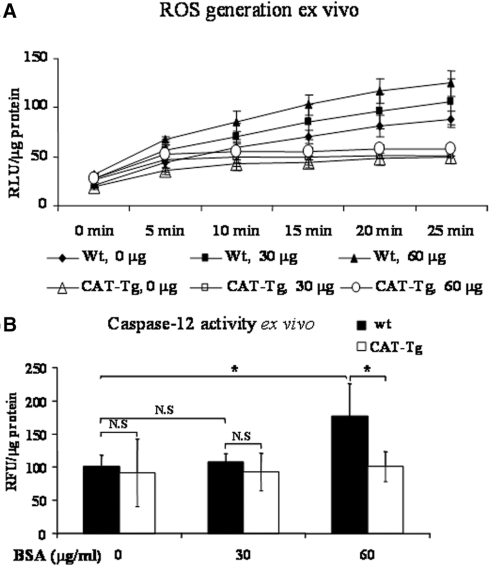
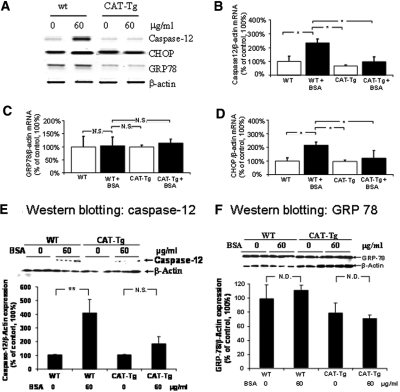
To ascertain ROS dependence of caspase-12 and CHOP upregulation, we performed ex vivo studies on RPTs freshly isolated from adult male wild-type (wt) mice (C57BL/6J) and CAT-Tg mice (C57BL/6J).31,35 RPTs were incubated with 0, 30, and 60 μg/ml fat-free BSA in serum-free medium for 16 hours. Albumin (60 μg/ml) induced ROS generation (Figure 6A) and increased caspase-12 activity (Figure 6B) in RPTs of wt mice but not of RPTs of CAT-Tg mice. Likewise, albumin stimulated caspase-12 and CHOP mRNA expression in RPTs of wt mice without inducing significant changes in caspase-12 and CHOP mRNA expression in RPTs of CAT-Tg mice (Figure 7, A, B, and D). Albumin also induced caspase-12 protein expression in RPTs of wt mice but had no effect in RPTs of CAT-Tg mice (Figure 7E). GRP78/BiP mRNA and protein expression did not differ in RPTs of wt and CAT-Tg mice in response to albumin (Figure 7, A, C, and F).
Figure 6.
Albumin effects ROS production and caspase-12 activity in mRPTs ex vivo. mRPTs from male wt or CAT-Tg mice were incubated in 5 mM d-glucose serum-free DMEM in the absence or presence of albumin (0, 30, or 60 μg/ml) for 16 hours. (A) ROS generation was assessed after 10 minutes of incubation in Krebs buffer and expressed as relative light units (RLU). (B) Caspase-12 activity assays were performed after 16 hours of incubation in mRPTs.
Figure 7.
Albumin affects caspase-12, GRP78/BiP, and CHOP expression in RPTs of wt and CAT-Tg mice ex vivo. (A) Southern blotting of RT-PCR of caspase-12, CHOP, and GRP78/Bip mRNA. (B) RT-qPCR of caspase-12 mRNA. (C) RT-qPCR of GRP78/BiP mRNA. (D) RT-qPCR of CHOP mRNA. (E, a) Immunoblotting of caspase-12 protein expression. (b) Densitometry of the data in a. (F, a) immunoblotting of GRP-78/BiP protein expression. (b) Densitometry of the immunoblotting of a.
Albumin Induces ROS Generation and Caspase-12 Expression in HK-2 Cells In Vitro
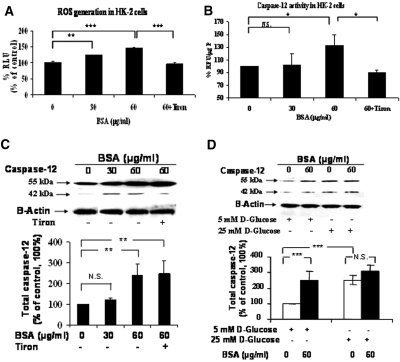
Next, we used a human proximal tubular cell line (HK-2) to confirm albumin induction of caspase-12 expression. HK-2 cells were incubated with 0, 30, and 60 μg/ml BSA in serum-free medium for 24 hours. BSA at 30 μg/ml enhanced ROS generation (Figure 8A) but not caspase-12 activity (Figure 8B). Furthermore, increases in caspase-12 protein (combined both pro–caspase-12 (55 kD) and cleaved pro–caspase-12 (45 kD) expression level did not reach statistical significance (Figure 8C). At 60 μg/ml, BSA induced significantly higher ROS generation (Figure 8A) and enhanced caspase-12 activity (Figure 8B) and caspase-12 protein expression (Figure 8, C and D). Tiron effectively blocked the stimulatory effects of BSA on ROS generation, caspase-12 activity, and caspase-12 cleavage but had no effect on pro–caspase-12 expression (Figure 8, A through C). Culturing HK-2 cells in high-glucose medium also augmented total caspase-12 expression (Figure 8D).
Figure 8.
Albumin affects ROS production, caspase-12 activity, and caspase-12 expression in HK-2 cells in vitro. HK-2 cells were incubated in 5 mM d-glucose serum-free DMEM in the absence or presence of albumin (0, 30, or 60 μg/ml) with or without tiron (10−4 M) for 16 hours. (A) ROS generation. (B) Caspase-12 activity assay. (C) Caspase-12 protein expression assessed by immunoblotting and quantification. (D) Immunoblotting and quantification of caspase-12 protein expression in HK-2 cells in 5 mM d-glucose plus 20 mM d-mannitol or 25 mM d-glucose in the presence or absence of 60 μg/ml albumin. *P < 0.05; **P < 0.01; ***P < 0.005.
Albumin Induces Caspase-3 Activation and Apoptosis in HK-2 cells
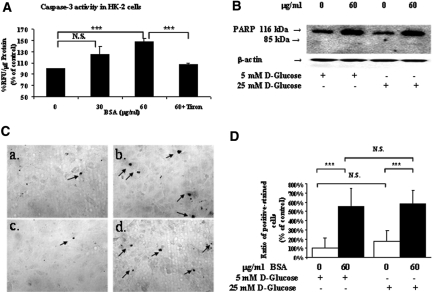
Next, we investigated whether albumin could induce caspase-3 activation and apoptosis in HK-2 cells. Incubation of HK-2 cells with BSA at 60 μg/ml but not at 30 μg/ml in serum-free medium for 24 hours stimulated caspase-3 activity (Figure 9A), as well as poly(ADP-ribose)polymerase (PARP) expression and cleavage (Figure 9B). Furthermore, albumin enhanced the number of apoptotic HK-2 cells in normal and high-glucose medium (Figure 9C, b and d) compared with untreated cells (Figure 9C, a and c). Interestingly, high glucose (25 mM) alone did not increase significantly the number of apoptotic cells in HK-2 cells (Figure 9D).
Figure 9.
Albumin affects caspase-3 activity and apoptosis in HK-2 cells in vitro. HK-2 cells were incubated in 5 mM d-glucose serum-free DMEM in the absence or presence of albumin (0, 30, or 60 μg/ml) with or without tiron (10−4 M) for 16 hours. (A) Caspase-3 activity assay. (B) Immunoblotting for PARP expression and cleavage in HK-2 cells in 5 mM d-glucose plus 20 mM d-mannitol or 25 mM d-glucose in the presence or absence of 60 μg/ml albumin. (C) HK-2 cell apoptosis analyzed by TUNEL staining assay. HK-2 cells were incubated in 5 mM d-glucose plus 20 mM d-mannitol medium in the absence (a) or in the presence (b) of 60 μg/ml albumin or in 25 mM d-glucose medium in the absence (c) or presence (d) of 60 μg/ml albumin. Arrows indicate the TUNEL-positive cells. (D) Quantification of TUNEL-positive cells in C. Data are means ± SD; n = 3. ***P < 0.005. Magnification, ×200 in C.
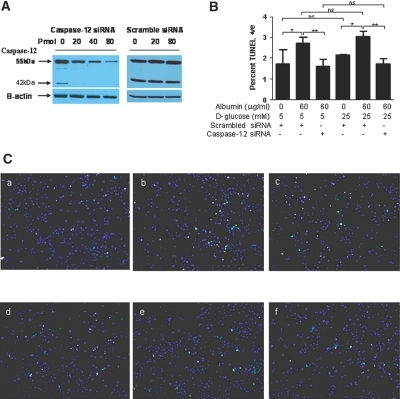
Finally, we investigated whether specific knockdown of caspase-12 expression would reduce the proapoptotic effect of albumin. Transfection of HK-2 cells with caspase-12 small interfering RNA (siRNA) but not a scrambled siRNA effectively reduced caspase-12 expression assessed as both the 55- and 42-kD bands in a dosage-dependent manner (Figure 10A). Incubation of HK-2 cells with 60 μg/ml BSA increased the number of apoptotic cells compared with HK-2 cells cultured with 40 pmol of scrambled siRNA alone in 5 or 25 mM d-glucose medium (Figure 10, B and C, b and e). By contrast, caspase-12 siRNA reduced the number of apoptotic HK-2 cells incubated with 60 μg/ml BSA (Figure 10, B and C, c and f). Of note, culture of HK-2 cells in high-glucose medium (25 mM d-glucose) did not significantly increase the number of apoptotic cells as compared with those cultured in normal glucose (Figure 10, B and C, a and d).
Figure 10.
Caspase-12 siRNA affects the number of TUNEL-positive apoptotic cells. (A) HK-2 cells were incubated in 5 mM d-glucose medium with increasing dosages of either caspase-12 siRNA or scrambled siRNA. (B) HK-2 cells were incubated in normal-glucose (5 mM d-glucose plus 20 mM d-mannitol) or high-glucose (25 mM d-glucose) medium in the absence or presence of albumin (60 μg/ml) and with or without caspase-12 siRNA or scrambled siRNA (40 pmol). Quantification of TUNEL-positive stained cells. Data are means ± SD. *P < 0.05; **P < 0.01. (C) Apoptosis was assessed by the TUNEL assay. TUNEL-positive apoptotic cells fluoresced green, and DAPI-stained nuclei fluoresced blue. HK-2 cells, plated at a density of 2.5 × 10⁴ in 12-well microplates, were incubated in 5 mM d-glucose plus 20 mM d-mannitol in the absence of albumin and presence of 40 pmol of scrambled siRNA (a) or in the presence of 60 μg/ml albumin and 40 pmol of scrambled siRNA (b) or in the presence of 60 μg/ml albumin and 40 pmol of caspase-12 siRNA (c). HK-2 cells were incubated in 25 mM d-glucose medium in the absence of albumin and presence of 40 pmol of scrambled siRNA (d) or in the presence of 60 μg/ml albumin and 40 pmol of scrambled siRNA (e) or in the presence of 60 μg/ml albumin and 40 pmol of caspase-12 siRNA (f). Magnification, ×100 in C.
Discussion
This study demonstrated increased caspase-12, GRP78/BiP, and CHOP expression in RPTCs of diabetic db/db mice. The kidneys of diabetic db/db mice also indicated a higher degree of apoptosis than db/m+ and db/db Cat-Tg mice, which co-localized with areas of increased caspase-12 expression. Albumin induced ROS generation and stimulated caspase-12, GRP78/BiP, and CHOP expression in RPTs of nondiabetic mice ex vivo and in HK-2 cells in vitro but not in RPTs of CAT-Tg mice ex vivo. Furthermore, albumin increased the number of apoptotic HK-2 cells in vitro, and this was abrogated by treatment with caspase-12 siRNA. These findings indicate an important role for ROS in mediating albumin-induced RPTC apoptosis via ER stress and proapoptotic gene expression.
Caspase-12 immunostaining was markedly augmented in RPTs of db/db mice with albuminuria at 20 weeks of age. This increase in caspase-12 expression in RPTs was initially found by gene chip microarray analysis and subsequently validated by RT-qPCR. The increase in caspase-12 expression in RPTs coincided with the development of albuminuria in db/db mice. Thus, at 12 weeks of age, when db/db mice had no apparent albuminuria, caspase-12 expression in their RPTs seemed to be similar to that of db/m+ mice. In contrast, development of macroalbuminuria at the age of 20 weeks14 coincided with increased caspase-12 expression in the RPTs. Intriguingly, caspase-12 expression was dramatically decreased in RPTs of 20-week-old db/db CAT-Tg mice, suggesting that caspase-12 expression was mediated, at least in part, via ROS generation.14 Immunofluorescence staining for caspase-12 and the TUNEL assay in 20-week-old mice revealed that the kidneys of db/db mice contained higher numbers of apoptotic cells that also expressed caspase-12, suggesting a causal link between caspase-12 expression and RPTC apoptosis.
ER stress–mediated activation of caspase-1224 suggests a role for caspase-12 in RPTC apoptosis, because it directly cleaves procaspase-9, leading to caspase-3 activation independent of the intrinsic (mitochondrial) pathway.25,27,36,37 Mice deficient in caspase-12 develop normally, and cells derived from caspase-12 null embryos are usually resistant to pharmacologic induction of ER stress,24 although some types of cells could undergo ER-induced apoptosis in the absence of caspase-12.27 Thus, the importance of caspase-12–mediated apoptosis in vivo remains unclear but could be cell specific; however, it is very likely that caspase-12 activation (mitochondrial independent) could act in concert with the mitochondrial pathway to promote RPTC apoptosis in diabetes. Indeed, our previous study demonstrated increased Bax expression in RPTCs of db/db mice.14
To date, several pathways of ER stress have been reported (reviewed by Zhang and Kaufman38). GRP78/BiP, a molecular chaperone localized in the ER, is involved in the folding and translocation of nascent proteins.39 CHOP is a proapoptotic gene activated by ER stress.25,29,31,35 We detected increases in GRP78/BiP and CHOP mRNA expression in the RPTs of 20-week-old db/db mice, indicating that caspase-12 upregulation in db/db mice was ER stress dependent. We also detected increased GRP78/Bip protein expression but not CHOP in the RPTs of 20-week-old db/db mice as compared with db/m+ and db/db Cat-Tg mice (unpublished results, Supplemental Figure A). Although the reasons for undetectable CHOP expression by immunoblotting are not clear, it is possible that either the expression of endogenous mouse CHOP was below the detection limit of our assay, or the anti-CHOP antibody that works well in immunohistochemistry does not work in immunoblotting. Furthermore, increases in GRP78/BiP and CHOP expression coincided with the onset of albuminuria. Twelve-week-old db/db mice did not exhibit increased expression compared with db/m+ and db/db Cat-Tg, whereas 20-week-old animals did show augmented expression corresponding with an elevated ACR.
To explore the underlying mechanism(s) of albumin-induced caspase-12, GRP78/BiP, and CHOP expression, we studied mouse RPTs (mRPTs) freshly isolated from wt and CAT-Tg mice. We observed that albumin enhanced ROS production and caspase-12 activity and caspase-12 mRNA and protein expression and CHOP mRNA expression in freshly isolated RPTs from wt mice. No such enhancement or activation was noted, however, in RPTs from CAT-Tg mice. Thus, albumin stimulation of caspase-12 activation seems to be ROS dependent. Indeed, albumin induced ROS generation in RPTs. Thus, these findings support the notion that stimulation of caspase-12 and ER stress gene expression and activation by albumin is mediated, at least in part, via ROS generation in RPTs. Surprising, we did not observe an increase of GRP78/BiP protein and mRNA expression by albumin ex vivo. By contrast, previous studies reported that high levels of albumin induced GRP78/BiP expression in RPTCs in vitro.31,33,34 Of note, we used BSA at the concentration range of 10 to 100 μg /ml, which were detected in the ultrafiltrate by Lindenmeyer et al.,40 whereas other studies used albumin at 100- to 1000-fold higher concentrations (i.e., 10 to 30 mg/ml).31,33,34
Our results with mouse kidneys were further supported by in vitro studies on HK-2 cells. Intriguing, albumin also enhanced caspase-12 expression in HK-2 cells via ROS generation. Previous bioinformatics analyses41–43 predicted that a silencing stop codon is inserted in the caspase-12 sequence in 98% of the population, yielding a truncated caspase-12 (i.e., inactive caspase-12). Positive selection for the mutation inserting the stop codon presumably occurred more than 100,000 years ago41 and may have an advantage for survival because caspase-12 also functions as an inhibitor of caspase-1 to impair the inflammasome. Thus, the presence of the full-length caspase-12 (a 52- to 54-kD) protein might sensitize humans to sepsis, a disadvantage for survival. Recent findings suggest that full-length caspase-12 could be re-expressed in human tissues under certain pathologic conditions, including cancer.44–48 Intriguingly, our sequencing confirmed presence of a silencing stop codon in caspase-12; however, a full-length 55-kD caspase-12 protein continued to be expressed in our studies. Furthermore, caspase-12 siRNA silenced expression of both the 55- and 42-kD caspase-12 with concomitant reduction in the number of apoptotic cells. These findings strongly suggest that human caspase-12 may have a functional role in some cell types despite the notion that it may be a pseudogene lacking activity.43
Cell-free in vitro transcription/translation experiments49 demonstrated that a single-nucleotide polymorphism (T125C) in human caspase-12 is translated into a 38-kD human caspase-12 protein but that this does not occur when there is a stop codon (TGA) in human caspase-12 at amino acid position 125. Other studies documented expression of a 50-kD caspase-12 in human promyelocytic leukemia cells (HL-60)48 and a 60-kD caspase-12 in human gastrointestinal stromal tumors (STI571).45 It is not clear how a 52- or 60-kD caspase-12 protein can be expressed in the presence of a stop codon; however, these studies raise the possibility that the 52- or 60-kD pro–caspase-12 could be aberrantly expressed in cells undergoing pathologic changes.
Future studies are required to investigate whether human caspase-12 is glycosylated in HK-2 or cancer cells. Our culture media contained 100 μg/ml streptomycin, an aminoglycoside. Because aminoglycosides permit translational read-through of the stop codon in many genes (reviewed by Linde and Kerem50), it remains to be investigated whether streptomycin might have promoted translational read-through of the stop codon in human caspase-12 gene.
Studies of rodent and human RPTCs reported albumin-induced caspase-12 activation and consequently RPTC apoptosis.30,31,35,51 In HK-2 cells, we also observed albumin-induced caspase-12 activation, caspase-3 activation, PARP cleavage, and apoptosis. Moreover, specific knockdown of caspase-12 with siRNA markedly reduced apoptosis in response to albumin. These findings lend further support to the hypothesis that elevated tubular fluid albumin levels could induce RPTC apoptosis via caspase-12 expression. Surprising, high glucose (25 mM) enhanced caspase-12 expression without inducing HK-2 cell apoptosis. A possible explanation is that high glucose enhances expression of caspase-12 expression and activity that did not lead to caspase-3 activation as suggested by our unpublished data (Supplemental Figure B).
Our findings may have important clinical implications. Because tubular apoptosis is detectable in various renal diseases with proteinuria, including DN,40,46–48,52 and tubular atrophy seems to be a better indicator of disease progression than glomerular pathology,11 we postulate that albuminuria-induced RPTC apoptosis may be an initial step leading to tubular atrophy and that ROS is one of the key mediators of this process. ROS may induce ER stress in RPTCs and stimulate caspase-12, GRP78/BiP, and CHOP expression and activation, triggering the initiation and amplification of the apoptotic cascade leading to tubular apoptosis.
In summary, our results indicate an important role for ROS and ER stress in albuminuria-induced RPTC apoptosis and suggest that caspase-12 activation may contribute to RPTC apoptosis and nephropathy progression in diabetes.
Concise Methods
Chemicals and Constructs
d-Glucose, d-mannitol, lipid-free BSA, tiron, and mAbs against β-actin were purchased from Sigma-Aldrich Canada Ltd. (Oakville, Ontario, Canada). Normal glucose (5 mM d-glucose), DMEM, and FBS were bought from Invitrogen (Burlington, Ontario, Canada). Polyclonal anti-GRP78/BiP, anti-PARP, and anti-CHOP antibodies were obtained from Santa Cruz Biotechnology (Santa Cruz, CA). Polyclonal anti-human/mouse caspase-12 antibody was procured from Cell Signaling (New England Biolabs Ltd., Pickering, Ontario, Canada) and (eBioscience, Cedarlane Laboratories, Hornby, Ontario, Canada). Oligonucleotides were synthesized by Invitrogen. HK-2 cells were obtained from American Type Culture Collection (Manassas, VA) and cultured according to the supplier. Sense and antisense primers used for both conventional RT-PCR and RT-qPCR are listed in Table 4.
Table 4.
Primers used for conventional RT-PCR and RT-qPCR
| Mouse caspase-12 |
| sense N + 778 to N + 797 (5′-GAA GGA ATC TGT GGG GTG AA-3′) |
| antisense N + 971 to N + 952 (5′-TCA GCA GTG GCT AT CCC TTT-3′) (NM 009808) |
| Mouse CHOP |
| sense N + 248 to N + 268 (5′-GTC CCT AGC TTG GCT GAC AGA-3′) |
| antisense N + 413 to N + 396 (5′-TGG AGA GCG AGG GCT TTG-3′) (X67083.1) |
| Mouse GRP78/BiP |
| sense N + 1269 to N + 1290 (5′-AAG GTG AAC GAC CCC TAA CAA A-3′) |
| antisense N + 1404 to N + 1378 (5′-GTC ACT CGG AGA ATA CCA TTA ACA TCT-3′) (BC005785.1) |
| β-actin |
| sense N + 155 to N + 179 (5′-ATG CCA TCC TGC GTC TGG ACC TGG C-3′) |
| antisense N + 115 to N + 139 (5′-AGC ATT TGC GGT GCA CGA TGG AGG G-3′) (NM 031144) |
Generation of db/db CAT-Tg Mice
We have reported the generation of db/db CAT-Tg mice overexpressing rat CAT in their RPTCs.14 Non-Tg, gender-matched db/m+ littermates (controls), db/db CAT-Tg mice, and db/db mice were studied at 12 and 20 weeks of age. All animals received standard mouse chow and water ad libitum. Animal care met the standards set forth by the Canadian Council on Animal Care, and all procedures were approved by the Animal Care Committee of the Centre hospitalier de l'Université de Montréal.
Physiologic Parameters
BP was monitored with a BP-2000 tail-cuff pressure instrument (Visitech Systems, Apex, NC) every 2 weeks for a period of 20 weeks, starting at the age of 8 weeks as described previously.14 Blood glucose level was quantified weekly with an ACCU-CHEK Compact Plus glucose meter (Roche Diagnostics, Laval, Québec, Canada). The mice were housed in metabolic cages to obtain 24-hour urine samples for the assessment of albuminuria by ELISA (Albuwell and Creatinine companion; Exocell, Philadelphia, PA).14
Mouse RPT Isolation and DNA Microarray Analysis
Animals were killed at 12 and 20 weeks of age, and kidneys were removed immediately. The left kidney was used for histology and immunohistochemistry. The right kidney was used for proximal tubule isolation by Percoll gradient as described previously.53 Aliquots of freshly isolated mRPTs from individual animals (three mice in each group) at 20 weeks of age were immediately used for total RNA isolation and subjected to Affymetrix Mouse Genome 430 2.0 microarray chips analysis (Microarray Centre of the Centre de recherche du Centre hospitalier de l'Université de Montréal). Data were analyzed on a computer with the R statistical language (version 2.51). The affylmGUI (version 1.10.5) software and the LIMMA package (version 2.10.5) of the Bioconductor library (release 2.0) were used for analysis. The GCRMA algorithm was used for background correction of the data, and a linear model fit was done on the various contrasts representing the desired group comparisons (i.e., db/db versus db/m+ mice, db/db mice versus db/db CAT-Tg mice). A list of normalized data from all of the probe sets represented on the chips was made, and classification was done by filtering on the basis of P < 0.01.
PCR Assays for Gene Expression
Total RNA was used in RT-PCR and RT-qPCR to quantify the amount of caspase-12, GRP78/BiP, and CHOP mRNA expressed in mRPTs and human RPTCs (HK-2).14,54 RT-qPCR data were analyzed using Opticon Monitor 3 software (Bio-Rad, Hercules, CA).
Immunohistochemistry
Immunostaining for mouse caspase-12, GRP78/BiP, and CHOP was performed by standard avidin-biotin-peroxidase complex method (ABC Staining System; Santa Cruz Biotechnology).13 Slides from six animals per group were analyzed visually under a light microscope by two investigators who were unaware of the treatments.
Cell Culture
HK-2 cells were cultured as described elsewhere.54 Briefly, cells were cultured in 5 mM d-glucose DMEM containing 5% FBS. For experiments, cells were synchronized for 24 hours in serum-free 5 mM d-glucose DMEM at 60 to 70% confluence. Then, cells were cultured in serum-free 5 mM d-glucose DMEM plus 20 mM d-mannitol (for normalization of osmolality) or 25 mM d(+)-glucose DMEM in the absence or presence of various concentrationsof lipid-free BSA with or without tiron (10−4 M) for an additional 24 or 48 hours. At the end of the incubation period, the cells were harvested for RT-qPCR assays and immunoblotting for caspase-12, PARP, and β-actin mRNA and protein quantification, respectively.
In Vivo Fluorescence Staining
Kidney sections of 20-week-old animals were incubated initially with the TUNEL fluorescein kit (Roche Diagnostics, Indianapolis, IN) as indicated by the manufacturer's protocol. After the last PBS wash, sections were blocked with goat serum followed by overnight incubation with anti–caspase-12 antibody (eBioscience). Sections were then incubated with anti-rabbit AlexaFluor 555 (Invitrogen), and nuclei were stained with DAPI.
Caspase-12 and Caspase-3 Activity Assay and Immunoblotting
Freshly isolated mRPTs and HK-2 cells were incubated for 24 hours as described previously and then harvested for caspase-12 and caspase-3 activity assay as well as for immunoblotting of caspase-12, PARP, GRP78/BiP, and β-actin expression. Caspase-12 and caspase-3 activity was determined fluorometrically using frozen (−80°C) mRPTs (BD Bioscience Pharmingen, Mississauga, Ontario, Canada). Briefly, mRPTs were resuspended in cold lysis buffer and placed on ice for 30 minutes. Then an equal volume of HEPES buffer containing DEVD-AFC (for caspase-3) or ATAD-AFC (for caspase-12; 15 μg/ml) was added to the mixture. After incubation at 37°C for 1 hour, the amount of AFC liberated from ATAD-AFC was measured using a spectrofluorometer with excitation of 380 nm and emission wavelength of 460 nm. The relative densities of caspase-12 and PARP and their respective cleaved forms and β-actin bands in immunoblotting were quantified by computerized laser densitometry (ImageQuant 5.1 software; Molecular Dynamics).
siRNA Dosage-Dependence Analysis
HK-2 cells were plated at a density of 2.5 × 10⁴ in a 12-well plate. The next day, cells were transfected using lipofectamine (Invitrogen) according to the manufacturer's instructions using 20, 40, and 80 pmol of caspase-12 siRNA (Santa Cruz Biotechnology) or scrambled siRNA (Bio-Rad). Low-glucose medium plus 5% FBS was added after 4 to 6 hours of incubation. Whole-cell lysates were collected for immunoblotting 48 hours after transfection.
TUNEL Assay
HK-2 cells were plated at a density of 1.2 × 10⁴ in four-well chamber slides coated with poly-d-lysine (Sigma). The next day, cells were transfected with 40 pmol of siRNA or scrambled siRNA using lipofectamine (Invitrogen). Low-glucose medium plus 5% FBS was placed after 4 to 6 hours of incubation with lipofectamine. Twenty-four hours after transfection, the medium was replaced with serum-free medium containing either 5 mM d-glucose plus 20 mM d-mannitol or 25 mM d-glucose with or without 60 μg/ml albumin and incubated for an additional 24 hours. The chamber slides were then processed for staining with TUNEL fluorescein kit according to the manufacturer's protocol (Roche Diagnostics, Indianapolis, IN). Nuclei were visualized using DAPI staining. Slides were examined using a fluorescence microscope, and the percentage of TUNEL-positive cells was determined using Image J software (http://rsb.info.nih.gov/ij/).
Sequencing of Genomic DNA of HK-2 Cells
Genomic DNA of HK-2 cells were isolated and subjected to PCR using primers framing a region of 300 bp surrounding the T125C polymorphism (sense 5′-GTCATTCTGTGTGTATTAATTGC-3′; antisense 5′-CCTATAATATCATACATCTTGCTC-3′) to amplify the genomic DNA.49 The PCR product was sequenced by Genome Quebec (Montréal, Québec, Canada).
Statistical Analysis
Experimental data were expressed as means ± SD. The data were analyzed by one-way ANOVA using Bonferroni correction. P < 0.05 was considered statistically significant.
Disclosures
None.
Acknowledgments
This work was supported by grants from the Kidney Foundation of Canada (KFOC80015), the Canadian Institutes of Health Research (MOP 84363 to J.S.D.C., MT-12573 to J.G.F., and MOP 86450 to S.-L.Z.), and the National Institutes of Health (HL-48455 to J.R.I.).
The editorial assistance of Research Support Office, Centre de recherche du Centre hospitalier de l'Université de Montréal, is acknowledged.
Footnotes
Published online ahead of print. Publication date available at www.jasn.org.
See related editorial, “Caspase-12 and Diabetic Nephropathy: From Mice to Men?” on pages 886–888.
Supplemental information for this article is available online at http://www.jasn.org/.
REFERENCES
- 1. Rabkin R: Diabetic nephropathy. Clin Cornerstone 5: 1–11, 2003. [DOI] [PubMed] [Google Scholar]
- 2. Sarafidis PA, Stafylas PC, Kanaki AI, Lasaridis AN: Effects of renin-angiotensin system blockers on renal outcomes and all-cause mortality in patients with diabetic nephropathy: An updated meta-analysis. Am J Hypertens 21: 922–929, 2008. [DOI] [PubMed] [Google Scholar]
- 3. Gordois A, Scuffham P, Shearer A, Oglesby A: The health care costs of diabetic nephropathy in the United States and the United Kingdom. J Diabetes Complications 18: 18–26, 2004. [DOI] [PubMed] [Google Scholar]
- 4. Hovind P, Tarnow L, Parving HH: Remission and regression of diabetic nephropathy. Curr Hypertens Rep 6: 377–382, 2004. [DOI] [PubMed] [Google Scholar]
- 5. Tarchini R, Bottini E, Botti P, Marseglia CD, Talassi E, Baraldi O, Lambertini D, Gaetti L, Bellomi A: Type 2 diabetic nephropathy: Clinical course and prevention proposals 2004 [in Italian]. G Ital Nefrol 22[Suppl 31]: S15–S19, 2005. [PubMed] [Google Scholar]
- 6. Ortiz A, Ziyadeh FN, Neilson EG: Expression of apoptosis-regulatory genes in renal proximal tubular epithelial cells exposed to high ambient glucose and in diabetic kidneys. J Investig Med 45: 50–56, 1997. [PubMed] [Google Scholar]
- 7. Morii T, Fujita H, Narita T, Shimotomai T, Fujishima H, Yoshioka N, Imai H, Kakei M, Ito S: Association of monocyte chemoattractant protein-1 with renal tubular damage in diabetic nephropathy. J Diabetes Complications 17: 11–15, 2003. [DOI] [PubMed] [Google Scholar]
- 8. Zeisberg M, Soubasakos MA, Kalluri R: Animal models of renal fibrosis. Methods Mol Med 117: 261–272, 2005. [DOI] [PubMed] [Google Scholar]
- 9. Bohlender JM, Franke S, Stein G, Wolf G: Advanced glycation end products and the kidney. Am J Physiol Renal Physiol 289: F645–F659, 2005. [DOI] [PubMed] [Google Scholar]
- 10. Ninichuk V, Khandoga AG, Segerer S, Loetscher P, Schlapbach A, Revesz L, Feifel R, Khandoga A, Krombach F, Nelson PJ, Schlondorff D, Anders HJ: The role of interstitial macrophages in nephropathy of type 2 diabetic db/db mice. Am J Pathol 170: 1267–1276, 2007. [DOI] [PMC free article] [PubMed] [Google Scholar]
- 11. Bagby SP: Diabetic nephropathy and proximal tubule ROS: Challenging our glomerulocentricity. Kidney Int 71: 1199–1202, 2007. [DOI] [PubMed] [Google Scholar]
- 12. Ninichuk V, Kulkarni O, Clauss S, Anders HJ: Tubular atrophy, interstitial fibrosis, and inflammation in type 2 diabetic db/db mice: An accelerated model of advanced diabetic nephropathy. Eur J Med Res 12: 351–355, 2007. [PubMed] [Google Scholar]
- 13. Brezniceanu ML, Liu F, Wei CC, Tran S, Sachetelli S, Zhang SL, Guo DF, Filep JG, Ingelfinger JR, Chan JS: Catalase overexpression attenuates angiotensinogen expression and apoptosis in diabetic mice. Kidney Int 71: 912–923, 2007. [DOI] [PubMed] [Google Scholar]
- 14. Brezniceanu ML, Liu F, Wei CC, Chenier I, Godin N, Zhang SL, Filep JG, Ingelfinger JR, Chan JS: Attenuation of interstitial fibrosis and tubular apoptosis in db/db transgenic mice overexpressing catalase in renal proximal tubular cells. Diabetes 57: 451–459, 2008. [DOI] [PubMed] [Google Scholar]
- 15. Itoh Y, Yano T, Sendo T, Oishi R: Clinical and experimental evidence for prevention of acute renal failure induced by radiographic contrast media. J Pharmacol Sci 97: 473–488, 2005. [DOI] [PubMed] [Google Scholar]
- 16. Chan LY, Leung JC, Tang SC, Choy CB, Lai KN: Tubular expression of angiotensin II receptors and their regulation in IgA nephropathy. J Am Soc Nephrol 16: 2306–2317, 2005. [DOI] [PubMed] [Google Scholar]
- 17. Liu F, Brezniceanu ML, Wei CC, Chenier I, Sachetelli S, Zhang SL, Filep JG, Ingelfinger JR, Chan JS: Overexpression of angiotensinogen increases tubular apoptosis in diabetes. J Am Soc Nephrol 19: 269–280, 2008. [DOI] [PMC free article] [PubMed] [Google Scholar]
- 18. Kumar D, Zimpelmann J, Robertson S, Burns KD: Tubular and interstitial cell apoptosis in the streptozotocin-diabetic rat kidney. Nephron Exp Nephrol 96: e77–e88, 2004. [DOI] [PubMed] [Google Scholar]
- 19. Verzola D, Gandolfo MT, Ferrario F, Rastaldi MP, Villaggio B, Gianiorio F, Giannoni M, Rimoldi L, Lauria F, Miji M, Deferrari G, Garibotto G: Apoptosis in the kidneys of patients with type II diabetic nephropathy. Kidney Int 72: 1262–1272, 2007. [DOI] [PubMed] [Google Scholar]
- 20. Hsieh TJ, Zhang SL, Filep JG, Tang SS, Ingelfinger JR, Chan JS: High glucose stimulates angiotensinogen gene expression via reactive oxygen species generation in rat kidney proximal tubular cells. Endocrinology 143: 2975–2985, 2002. [DOI] [PubMed] [Google Scholar]
- 21. Hsieh TJ, Fustier P, Wei CC, Zhang SL, Filep JG, Tang SS, Ingelfinger JR, Fantus IG, Hamet P, Chan JS: Reactive oxygen species blockade and action of insulin on expression of angiotensinogen gene in proximal tubular cells. J Endocrinol 183: 535–550, 2004. [DOI] [PubMed] [Google Scholar]
- 22. Miyata K, Ohashi N, Suzaki Y, Katsurada A, Kobori H: Sequential activation of the reactive oxygen species/angiotensinogen/renin-angiotensin system axis in renal injury of type 2 diabetic rats. Clin Exp Pharmacol Physiol 35: 922–927, 2008. [DOI] [PMC free article] [PubMed] [Google Scholar]
- 23. Noh H, Ha H, Yu MR, Kim YO, Kim JH, Lee HB: Angiotensin II mediates high glucose-induced TGF-beta1 and fibronectin upregulation in HPMC through reactive oxygen species. Perit Dial Int 25: 38–47, 2005. [PubMed] [Google Scholar]
- 24. Nakagawa T, Zhu H, Morishima N, Li E, Xu J, Yankner BA, Yuan J: Caspase-12 mediates endoplasmic-reticulum-specific apoptosis and cytotoxicity by amyloid-beta. Nature 403: 98–103, 2000. [DOI] [PubMed] [Google Scholar]
- 25. Rao RV, Peel A, Logvinova A, del Rio G, Hermel E, Yokota T, Goldsmith PC, Ellerby LM, Ellerby HM, Bredesen DE: Coupling endoplasmic reticulum stress to the cell death program: role of the ER chaperone GRP78. FEBS Lett 514: 122–128, 2002. [DOI] [PMC free article] [PubMed] [Google Scholar]
- 26. Araki E, Oyadomari S, Mori M: Endoplasmic reticulum stress and diabetes mellitus. Intern Med 42: 7–14, 2003. [DOI] [PubMed] [Google Scholar]
- 27. Kalai M, Lamkanfi M, Denecker G, Boogmans M, Lippens S, Meeus A, Declercq W, Vandenabeele P: Regulation of the expression and processing of caspase-12. J Cell Biol 162: 457–467, 2003. [DOI] [PMC free article] [PubMed] [Google Scholar]
- 28. Hitomi J, Katayama T, Taniguchi M, Honda A, Imaizumi K, Tohyama M: Apoptosis induced by endoplasmic reticulum stress depends on activation of caspase-3 via caspase-12. Neurosci Lett 357: 127–130, 2004. [DOI] [PubMed] [Google Scholar]
- 29. Lee W, Kim DH, Boo JH, Kim YH, Park IS, Mook-Jung I: ER stress-induced caspase-12 activation is inhibited by PKC in neuronal cells. Apoptosis 10: 407–415, 2005. [DOI] [PubMed] [Google Scholar]
- 30. Shiraishi H, Okamoto H, Yoshimura A, Yoshida H: ER stress-induced apoptosis and caspase-12 activation occurs downstream of mitochondrial apoptosis involving Apaf-1. J Cell Sci 119: 3958–3966, 2006. [DOI] [PubMed] [Google Scholar]
- 31. Ohse T, Inagi R, Tanaka T, Ota T, Miyata T, Kojima I, Ingelfinger JR, Ogawa S, Fujita T, Nangaku M: Albumin induces endoplasmic reticulum stress and apoptosis in renal proximal tubular cells. Kidney Int 70: 1447–1455, 2006. [DOI] [PubMed] [Google Scholar]
- 32. Liu G, Sun Y, Li Z, Song T, Wang H, Zhang Y, Ge Z: Apoptosis induced by endoplasmic reticulum stress involved in diabetic kidney disease. Biochem Biophys Res Commun 370: 651–656, 2008. [DOI] [PubMed] [Google Scholar]
- 33. Erkan E, De Leon M, Devarajan P: Albumin overload induces apoptosis in LLC-PK(1) cells. Am J Physiol Renal Physiol 280: F1107–F1114, 2001. [DOI] [PubMed] [Google Scholar]
- 34. Arici M, Chana R, Lewington A, Brown J, Brunskill NJ: Stimulation of proximal tubular cell apoptosis by albumin-bound fatty acids mediated by peroxisome proliferator activated receptor-gamma. J Am Soc Nephrol 14: 17–27, 2003. [DOI] [PubMed] [Google Scholar]
- 35. Kimura K, Jin H, Ogawa M, Aoe T: Dysfunction of the ER chaperone BiP accelerates the renal tubular injury. Biochem Biophys Res Commun 366: 1048–1053, 2008. [DOI] [PubMed] [Google Scholar]
- 36. Morishima N, Nakanishi K, Takenouchi H, Shibata T, Yasuhiko Y: An endoplasmic reticulum stress-specific caspase cascade in apoptosis: Cytochrome c-independent activation of caspase-9 by caspase-12. J Biol Chem 277: 34287–34294, 2002. [DOI] [PubMed] [Google Scholar]
- 37. Jimbo A, Fujita E, Kouroku Y, Ohnishi J, Inohara N, Kuida K, Sakamaki K, Yonehara S, Momoi T: ER stress induces caspase-8 activation, stimulating cytochrome c release and caspase-9 activation. Exp Cell Res 283: 156–166, 2003. [DOI] [PubMed] [Google Scholar]
- 38. Zhang K, Kaufman RJ: From endoplasmic-reticulum stress to the inflammatory response. Nature 454: 455–462, 2008. [DOI] [PMC free article] [PubMed] [Google Scholar]
- 39. Watson LM, Chan AK, Berry LR, Li J, Sood SK, Dickhout JG, Xu L, Werstuck GH, Bajzar L, Klamut HJ, Austin RC: Overexpression of the 78-kDa glucose-regulated protein/immunoglobulin-binding protein (GRP78/BiP) inhibits tissue factor procoagulant activity. J Biol Chem 278: 17438–17447, 2003. [DOI] [PubMed] [Google Scholar]
- 40. Lindenmeyer MT, Rastaldi MP, Ikehata M, Neusser MA, Kretzler M, Cohen CD, Schlondorff D: Proteinuria and hyperglycemia induce endoplasmic reticulum stress. J Am Soc Nephrol 19: 2225–2236, 2008. [DOI] [PMC free article] [PubMed] [Google Scholar]
- 41. Xue Y, Daly A, Yngvadottir B, Liu M, Coop G, Kim Y, Sabeti P, Chen Y, Stalker J, Huckle E, Burton J, Leonard S, Rogers J, Tyler-Smith C: Spread of an inactive form of caspase-12 in humans is due to recent positive selection. Am J Hum Genet 78: 659–670, 2006. [DOI] [PMC free article] [PubMed] [Google Scholar]
- 42. Kachapati K, O'Brien TR, Bergeron J, Zhang M, Dean M: Population distribution of the functional caspase-12 allele. Hum Mutat 27: 975, 2006. [DOI] [PubMed] [Google Scholar]
- 43. Fischer H, Koenig U, Eckhart L, Tschachler E: Human caspase 12 has acquired deleterious mutations. Biochem Biophys Res Commun 293: 722–726, 2002. [DOI] [PubMed] [Google Scholar]
- 44. Lu HF, Hsueh SC, Ho YT, Kao MC, Yang JS, Chiu TH, Huamg SY, Lin CC, Chung JG: ROS mediates baicalin-induced apoptosis in human promyelocytic leukemia HL-60 cells through the expression of the Gadd153 and mitochondrial-dependent pathway. Anticancer Res 27: 117–125, 2007. [PubMed] [Google Scholar]
- 45. Nakatani H, Araki K, Jin T, Kobayashi M, Sugimoto T, Akimori T, Namikawa T, Okamoto K, Nakano T, Okabayashi T, Hokimoto N, Kitagawa H, Taguchi T: STI571 (Glivec) induces cell death in the gastrointestinal stromal tumor cell line, GIST-T1, via endoplasmic reticulum stress response. Int J Mol Med 17: 893–897, 2006. [PubMed] [Google Scholar]
- 46. Tinhofer I, Anether G, Senfter M, Pfaller K, Bernhard D, Hara M, Greil R: Stressful death of T-ALL tumor cells after treatment with the anti-tumor agent Tetrocarcin-A. FASEB J 16: 1295–1297, 2002. [DOI] [PubMed] [Google Scholar]
- 47. Rabik CA, Fishel ML, Holleran JL, Kasza K, Kelley MR, Egorin MJ, Dolan ME: Enhancement of cisplatin [cis-diammine dichloroplatinum (II)] cytotoxicity by O6-benzylguanine involves endoplasmic reticulum stress. J Pharmacol Exp Ther 327: 442–452, 2008. [DOI] [PMC free article] [PubMed] [Google Scholar]
- 48. Iuchi K, Hatano Y, Yagura T: Heterocyclic organobismuth(III) induces apoptosis of human promyelocytic leukemic cells through activation of caspases and mitochondrial perturbation. Biochem Pharmacol 76: 974–986, 2008. [DOI] [PubMed] [Google Scholar]
- 49. Saleh M, Vaillancourt JP, Graham RK, Huyck M, Srinivasula SM, Alnemri ES, Steinberg MH, Nolan V, Baldwin CT, Hotchkiss RS, Buchman TG, Zehnbauer BA, Hayden MR, Farrer LA, Roy S, Nicholson DW: Differential modulation of endotoxin responsiveness by human caspase-12 polymorphisms. Nature 429: 75–79, 2004. [DOI] [PubMed] [Google Scholar]
- 50. Linde L, Kerem B: Introducing sense into nonsense in treatments of human genetic diseases. Trends Genet 24: 552–563, 2008. [DOI] [PubMed] [Google Scholar]
- 51. Reich H, Tritchler D, Herzenberg AM, Kassiri Z, Zhou X, Gao W, Scholey JW: Albumin activates ERK via EGF receptor in human renal epithelial cells. J Am Soc Nephrol 16: 1266–1278, 2005. [DOI] [PubMed] [Google Scholar]
- 52. Singh DK, Winocour P, Farrington K: Mechanisms of disease: The hypoxic tubular hypothesis of diabetic nephropathy. Nat Clin Pract Nephrol 4: 216–226, 2008. [DOI] [PubMed] [Google Scholar]
- 53. Brezniceanu ML, Wei CC, Zhang SL, Hsieh TJ, Guo DF, Hebert MJ, Ingelfinger JR, Filep JG, Chan JS: Transforming growth factor-beta 1 stimulates angiotensinogen gene expression in kidney proximal tubular cells. Kidney Int 69: 1977–1985, 2006. [DOI] [PubMed] [Google Scholar]
- 54. Lorz C, Benito-Martin A, Boucherot A, Ucero AC, Rastaldi MP, Henger A, Armelloni S, Santamaria B, Berthier CC, Kretzler M, Egido J, Ortiz A: The death ligand TRAIL in diabetic nephropathy. J Am Soc Nephrol 19: 904–914, 2008. [DOI] [PMC free article] [PubMed] [Google Scholar]


