Abstract
Background
The main concern in noninvasive (NI) glucose monitoring methods is to achieve high accuracy results despite the fact that no direct blood or interstitial fluid glucose measurement is performed. An alternative approach to increase the accuracy of NI glucose measurement was previously suggested through a combination of three NI methods: ultrasonic, electromagnetic, and thermal. This paper provides further explanation about the nature of the implemented technologies, and multi-sensors are presented, as well as a detailed elaboration on the novel algorithm for data analysis.
Methods
Clinical trials were performed on two different days. During the first day, calibration and six subsequent measurements were performed. During the second day, a “full day” session of about 10 hours took place. During the trial, type 1 and 2 diabetes patients were calibrated and evaluated with GlucoTrack® glucose monitor against HemoCue® (Glucose 201+).
Results
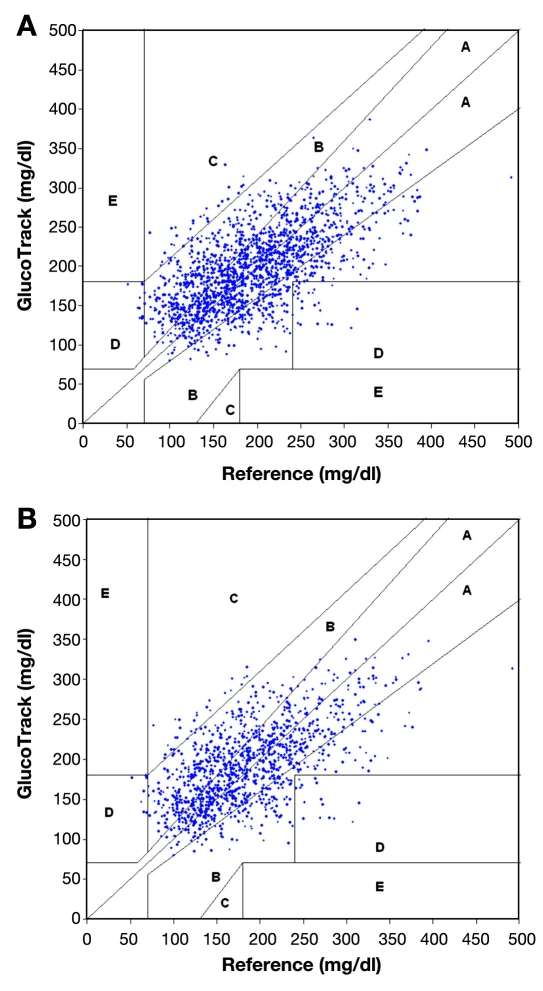
A total of 91 subjects were tested during the trial period. Clarke error grid (CEG) analysis shows 96% of the readings (on both days 1 and 2) fall in the clinically accepted A and B zones, of which 60% are within zone A. The absolute relative differences (ARDs) yield mean and median values of 22.4% and 15.9%, respectively. The CEG for day 2 of the trial shows 96% of the points in zones A and B, with 57% of the values in zone A. Mean and median ARD values for the readings on day 2 are 23.4% and 16.5%, respectively. The intervals between day 1 (calibration and measurements) and day 2 (measurements only) were 1–22 days, with a median of 6 days.
Conclusions
The presented methodology shows that increased accuracy was indeed achieved by combining multi-technology and multi-sensors. The approach of integration contributes to increasing the signal-to-noise ratio (glucose to other contributors). A combination of several technologies allows compensation of a possible aberration in one modality by the others, while multi-sensor implementation enables corrections for interference contributions.
Furthermore, clinical trials indicate the ability of using the device for a wide range of demography, showing clearly that the calibration is valid for long term.
Keywords: combination methodology, ear clip, electromagnetic, GlucoTrack, glucose monitor, multi-sensors, multi-technology, noninvasive glucose monitoring, self-monitoring of blood glucose, thermal, ultrasonic
Introduction
Diabetes and its complications impose significant economic consequences on individuals, families, health systems, and countries. The annual expenditure for diabetes in 2007 in the United States alone was estimated to be over $170 billion, attributed to both direct and indirect costs.1 In 2010, health care expenditures for diabetes are expected to account for 11.6% of the total health care expenditure worldwide.2 It is estimated that approximately 285 million people around the globe will have diabetes in 2010, representing 6.6% of the world's adult population, with a prediction for 438 million by 2030.2
Researches have conclusively shown that improved glucose control reduces the long-term complications of diabetes.3,4 According to the American Diabetes Association, self-monitoring of blood glucose (SMBG) has a positive impact on the outcome of therapy with insulin, oral agents, and medical nutrition.5 In its consensus statement,6 the Diabetes Research Institute in Munich recommends performing of SMBG for all types of diabetes treatment approaches, in order to achieve optimal glucose control and values that are close to normal, without increasing the risk of hypoglycemia. Furthermore, special guidelines were issued by the International Diabetes Federation to support SMBG for noninsulin-treated type 2 diabetes patients.7 Self-monitoring of blood glucose presents several benefits in both diabetes education and treatment. It can help to facilitate individuals' diabetes management by providing an instrument for objective feedback on the impact of daily lifestyle habits, including exercise and food intake, on the daily profile and thereby empower the individual to make necessary changes.6,7 Moreover, SMBG can support the health care team in providing individually tailored advice about lifestyle activities and blood glucose (BG)-lowering medications, thus helping to achieve specific glycemic goals.7
However, the inconvenience, expenses, pain, and complexity involved in conventional (invasive) SMBG lead to its underutilization, mainly in people with type 2 diabetes.8–10 Availability of an accurate, painless, inexpensive, and easy-to-operate device will encourage more frequent testing,11,12 leading to tighter glucose control and delay/decrease of long-term complications and their associated health care costs.
Noninvasive (NI) glucose monitoring can decrease the cost of SMBG and meaningfully increase the frequency of testing. The main concern in NI methods is to achieve a high degree of accuracy despite the fact that no direct blood or interstitial fluid glucose measurement is performed.
In our previous paper,13 an alternative approach to increase accuracy of NI glucose measurement was suggested using a combination of three NI methods: ultrasonic, electromagnetic, and thermal.14 These methods take into account the tissue's physiological response to glucose variations, manifested in changes of physical properties such as electric and acoustic impedance, as well as heat transfer (HT) characteristics of the cellular, interstitial, and plasma compartments due to changes in ion concentration, density, compressibility, and hydration of both compartments.
The selected methods were chosen for several reasons. Being based on different physical properties of the measurement object, the monitored variables/the outputs of the measurement channels are functionally independent15 and allow receiving information with sufficient resolution for engineering/practical implementations. Additional consideration upon the selection of the particular techno-logies in use was their implementation feasibility such as physical size, weight, and power consumption. Each chosen method per se is indicative of glucose but is confined by the impact of the interfering factors due to lack of specificity. The behavior of each measured parameter is different as a function of glucose and interfering factors, affecting the sensitivity of each measurement channel distinctively. Harman-Boehm et al. suggested that a combination of several modalities decreases the errors derived from each method separately, thereby increasing the accuracy of the final result.13
The present paper further explores the nature of the implemented technologies and multi-sensors and presents a detailed elaboration on the novel data analysis algorithm.13 Multi-technology and multi-sensor combination, together with aggregated data analysis algorithm, is expected to improve the accuracy of individual measurements compared to the accuracy achieved by use of a single measurement channel. Moreover, the presented methodology, with some further improvements, results in a clinically acceptable product.
Methods
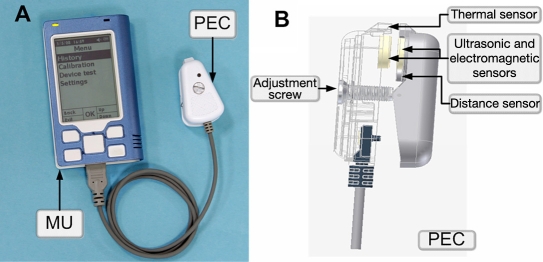
The GlucoTrack glucose monitor is comprised by a main unit (MU), which drives three different sensor pairs (one per technology), located at the tip of a personal ear clip (PEC) (Figure 1). In order to perform a spot measurement, the PEC is clipped externally to the user's earlobe for the duration of the measurement (about one minute) and is removed afterward.
Figure 1.
(A) Main unit with PEC and (B) PEC side view.
Thermal Technology
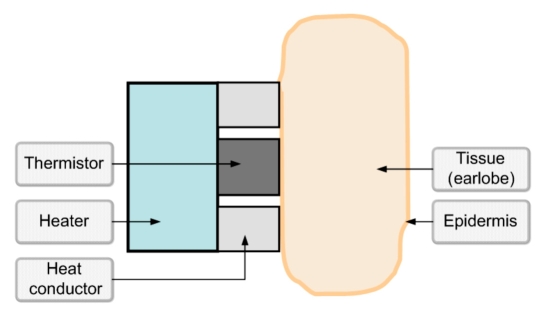
Blood glucose variations affect HT characteristics through changes in heat capacity,16 density,17 and thermal conductivity18 of the tissue due to water/electrolytes shifts.19,20 Thus the alteration of the HT processes that occurs in a multilayer sensor-tissue mechanical structure (Figure 2) is a direct result of changes in glucose concentration.21 The higher the glucose concentration, the lower the heat capacity and the lower the thermal conductivity, thus causing greater temperature elevation in the exterior tissue layers in response to heating. Since the sensor (thermistor) is mounted on the epidermis, the measured rate and magnitude of the temperature change upon heating is greater than in the internal tissues.
Figure 2.
Sensor-tissue mechanical structure.
The thermal method applies a specific amount of energy (see Calibration section) to the tissue. The rate and magnitude of a temperature change, caused by applying a known amount of energy on the tissue, are correlated with the heat capacity, density, and thermal conductivity of the tissue as a function of the tissue components, including glucose concentration.
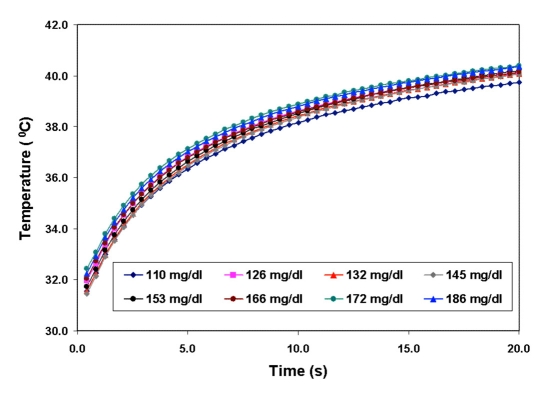
Thus the glucose concentration is evaluated indirectly by measuring changes in the HT characteristics obtained after heating for a predetermined duration of time. Figure 3 depicts the raw process of heating the sensor-tissue structure.
Figure 3.
Raw process of heating the sensor-tissue structure in subject A (as an example) as measured by the thermal sensor. The different colors of the heating process represent different glucose concentrations.
The ambient temperature that defines the boundary condition of the surface skin temperature and the sensor's initial temperature affect the process as well. Therefore, in the NI device, the thermal process is integrated and normalized to consider the initial skin surface temperature, followed by a compensation for the difference between the ambient and skin temperatures:
| (1) |
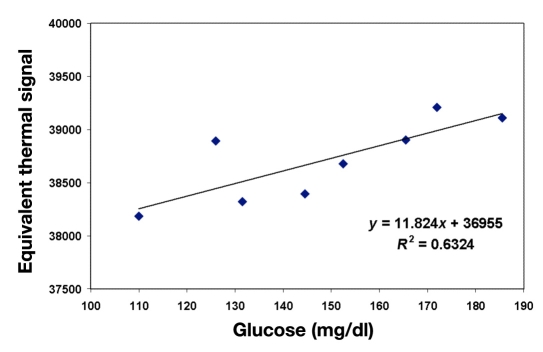
where t0 and tf are the starting and the finishing time of the heating process; Tear and Tamb are the tissue and the ambient temperatures, respectively; and k is the temperature correction factor. The integrated, corrected, and compensated signal (equivalent thermal signal) is shown in Figure 4, as a function of glucose concentration.
Figure 4.
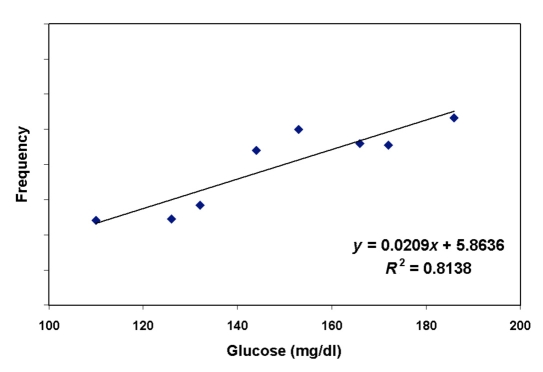
Integrated and temperature-corrected equivalent thermal signal in subject A (as an example) versus glucose. The quality of correlation between the heat signal and glucose, shown as R2, is 0.63.
Ultrasonic Technology
Changes in the glucose concentration can be indirectly evaluated by measurement of the velocity of sound through the tissue.13 As glucose concentration increases, the propagation velocity increases as well.16,17,22 Since the propagation velocity depends linearly on glucose concentration, the higher the glucose content in a tissue, the faster the ultrasonic wave propagates through it, thus decreasing the time of propagation.
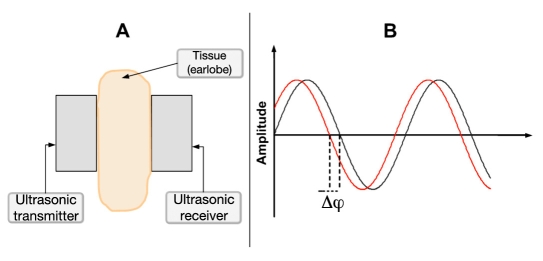
The measurement channel consists of an ultrasound transmitter and receiver attached to the subject's earlobe and an electronic circuit (Figure 5A). A continuous ultrasonic wave produced by the transmitter travels through the earlobe with characteristic velocity, causing a phase shift (Δφ) between the transmitted and received wave (Figure 5B). The phase shift is then amplified by G1 factor to increase the signal resolution.
Figure 5.
(A) Shematic representation of the earlobe between the two ultrasonic piezo elements. (B) Phase shift between the transmitted and received waves, measured as Δφ.
The velocity is phase related:
| (2) |
where f is the frequency (Hz), Δφ is the phase shift (radians), and d is the distance between piezo elements of the sensors (m).
During calibration, two optimal frequencies are elected, one from the low-frequency range and one from the high-frequency range, while the frequency ranges are nonoverlapping (see Calibration section). After calibration, the measurements are conducted at the two chosen frequencies.
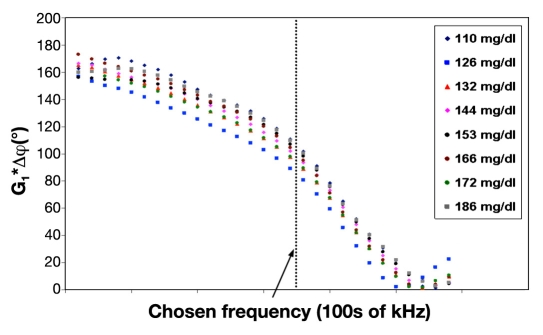
Figure 6 presents plot of the measured phase-shift values as a family of functions having the frequency of excitation as an argument and the glucose values as a parameter of the family. The tissue thickness determines the part of the measured phase-shift cycle (ascending or descending). Therefore, the direction (negative or positive) of the phase-shift change with glucose increment depends on the tissue thickness. In the arrangement shown in Figure 6, the descending part of the cycle is viewed, G1*Δφ causing to increase with enhancement in glucose level.
Figure 6.
Amplified phase shift versus input transducer frequency in the low-frequency region. The amplified phase-shift values are viewed at a chosen frequency, which was found to be the optimal frequency during calibration for subject A. Different colors apply to different glucose levels.
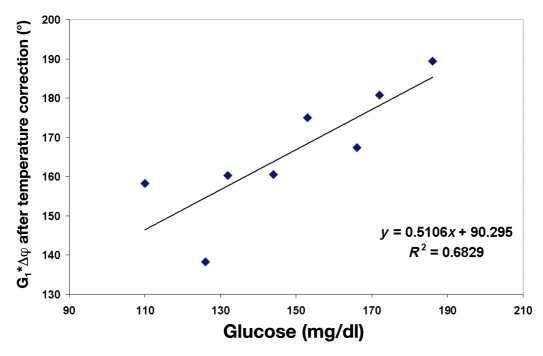
It is well-known that the velocity of ultrasound waves depends on the propagation medium temperature.22–24 The ambient temperature affects the sensor parameters, whereas the tissue temperature impacts the wave propagation in the tissue itself. Therefore, temperature correction, using both ambient and tissue temperatures is necessary. The temperature correction is performed on the measured amplified phase shift (Figure 7) using the following formula:
Figure 7.
Amplified phase shift (measured at a chosen frequency) corrected for temperature for subject A (as an example) versus glucose. The quality of corelation between glucose and phase shift after temperature correction, shown as R2, is 0.68.
| (3) |
where Phase Shift Cor is the temperature-corrected amplified phase shift, G2 is the temperature correction factor, Tamb is the ambient temperature, and Tear is the tissue surface temperature. The sign of correction depends on the direction of the phase shift change with frequency.
Electromagnetic Technology
A glucose-induced water and ion transport across the cellular membrane leads to changes in the electrical properties of the cellular and, consequently, extracellular compartments.25,26 Primarily, a change in the dielectric properties is observed,27 which, consequently, is reflected in changes of the whole tissue impedance.
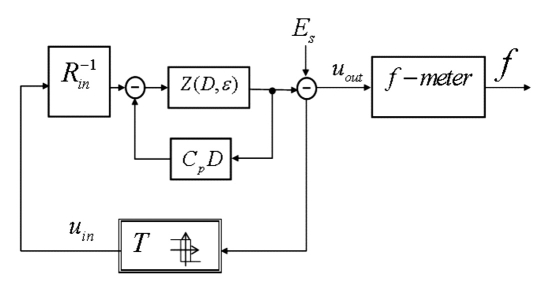
To capture changes in the tissue electrical impedance caused by varying glucose, the electromagnetic channel (EMC) includes a special auto-oscillating circuit and the earlobe, which functions as a dielectric material, positioned between two electrodes connected to the circuitry (Figure 8).
Figure 8.
Electromagnetic channel, where Rin is the input resistance, Z(D,ε) is the transfer operator of the sensing element; f-meter is the auto-oscillation frequency (f) measuring circuit, T is the relay element with hysteresis creating a positive feedback in the auto-oscillating circuit, Es is the electrical potential on the skin surface, and Cp is the parasitic capacitance. The EMC integrator includes the earlobe tissue in the feedback, and the transfer operator time constants depend on the tissue electric permittivity, denoted ε.
The earlobe temperature is also considered in the measurement, since tissue impedance is temperature dependent.28 Among the disturbance-causing variables of the EMC, the ambient temperature plays two roles: (a) influencing the tissue parameters and (b) affecting the sensor's electromagnetic parameters such as parasitic capacitance of electrodes. Therefore, the electromagnetic signal is corrected for both, ambient and ear temperatures using Equation (4), as shown in Figure 9:
| (4) |
where Electromagnetic Signal Cor is a temperature-corrected electromagnetic signal, C is the temperature correction factor, Tamb is the ambient temperature, and Tear is the tissue surface temperature.
Figure 9.
Electromagntic signal (frequency) corrected for temperature for subject A (as an example) versus glucose. The quality of linear correlation between glucose and temperature-corrected electromagnetic signal, shown as R2, is 0.81.
Integration of Technologies
Harman-Boehm et al. suggested that a combination of several modalities decreases the errors derived from each method separately, thereby increasing the accuracy of the final result (Figure 10).13
Figure 10.
Proof of concept of using combined technologies: (A) raw glucose readings per each technology [( ), thermal; (
 ), electromagnetic; (
 ), ultrasonic] and (B) final combined glucose result.
The data collected as a confirmation for the concept of using combined technologies showed mean absolute relative difference (ARD) values of 23.2%, 19.9%, and 22.1% for the thermal, electromagnetic, and ultrasonic channels, respectively, with the final combined result of the three technologies having a mean ARD value of 15.8%.13
Calibration
Calibration is required to be performed prior to glucose measurements so that the influence of individual quasi-stable factors, such as tissue structure, can be minimized. The sensor is individually adjusted for optimal fit, according to the thickness of the user's earlobe, prior to calibration. An adjustment screw (Figure 1B) is used to adjust the distance between the sensors and, consequently, the pressure on the earlobe for optimal fit. This action is guided by the device through a series of appropriate instructions presented on the device's screen following an initiative set of instructions. The user is guided by direction and number of turns to turn the adjustment screw for achieving individual optimal sensor fit.
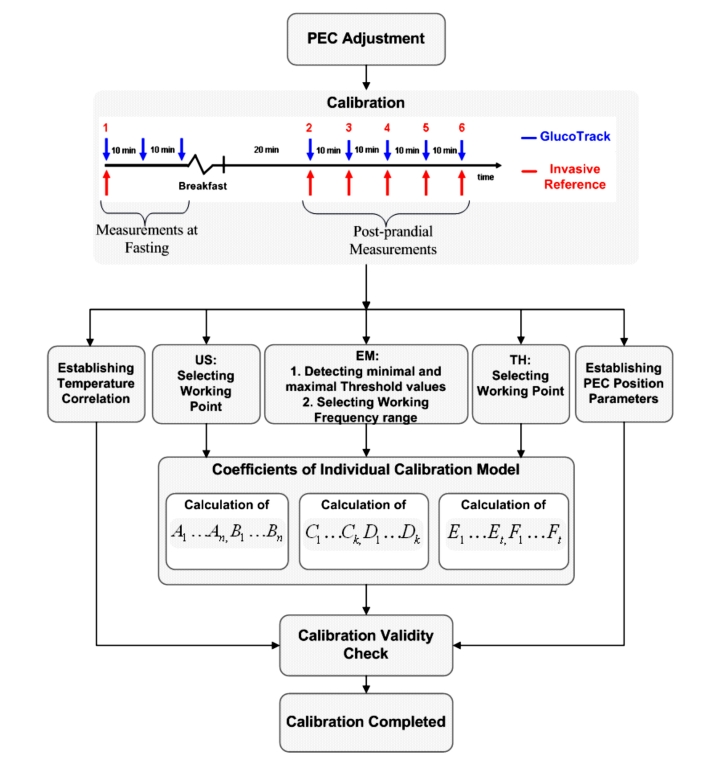
After adjusting the PEC, the calibration process begins. The procedure consists of correlating invasive basal and postprandial BG data, taken from fingertip capillary blood, with six sequential measurements with a NI device, generating a calibration curve that is exclusive to each individual (Figure 11).
Figure 11.
Build up of a calibration model. US, ultrasonic channel; EM, electromagnetic channel; TH, thermal channel.
The first three calibration points are performed at the same (fasting) glucose level and together determine an accurate initial point for the model used in the calibration. This initial calibration is performed in fasting state and consists of one invasive and three consecutive NI measurements followed by food and drink consumption in order to increase BG by at least 30% from the fasting value. Then, 20 minutes later, a set of 5 sequential measure-ment pairs, with time intervals of about 10 minutes in between, is taken. In total, the calibration process takes about 1.5 to 2 hours.
At the first point of calibration, the distance between the sensors is automatically measured and set as a reference distance (original location or preset reference point) of the sensors in the following calibration points, as well as measurement points to be checked prior to beginning the measurement itself. The earlobe is a pretty homogeneous and parallel tissue. Therefore, if the distance in any of the calibration points or in regular measurement points differs (within a certain tolerance range) from the preset reference point, the user is guided by the device to move the PEC as required in order to get to the original location. Once the calibration is completed, a vector of individual linear model parameters is set for each technology's output (Figure 11).
For the thermal technology, heating intensity is checked during the measurement of the first point and a correction factor is calculated for optimal heating intensity to be used in the subsequent measurements. This factor is calculated for each individual user in order to ensure increasing the tissue surface temperature above a minimal increment threshold.
For the electromagnetic technology, the oscillations are performed at three close but different frequency ranges. The optimal frequency range is chosen as a function of individual sensitivity to glucose changes during calibration. Furthermore, the maximal and minimal deviations between the working frequency range and the next close frequency range are set as threshold values (Figure 11B) for the electromagnetic signal validity filter:
| (5) |
where EMmin and EMmax are minimal and maximal electromagnetic signal threshold values, accordingly; EMi is the electromagnetic signal in the working frequency range; and EMj is the electromagnetic signal in the neighboring frequency range.
In order to choose optimal working frequencies for the acoustic measurement method, a scanning of two frequency regions (low and high) is performed during calibration. In each region, the optimal frequency is selected according to the signal's amplitude (the strength of propagated signal) and the sensitivity of the phase shift to glucose changes at that particular frequency. Post calibration, the measurements are performed at these two selected frequencies (one from the low region and one from the high region).
At each calibration point, both ambient and tissue temperatures are taken. At the end of the calibration process, a correlation between the two temperatures is found. This correlation is later used to discover discrepancies in the measured ear and ambient temperatures for each measurement.
Algorithm
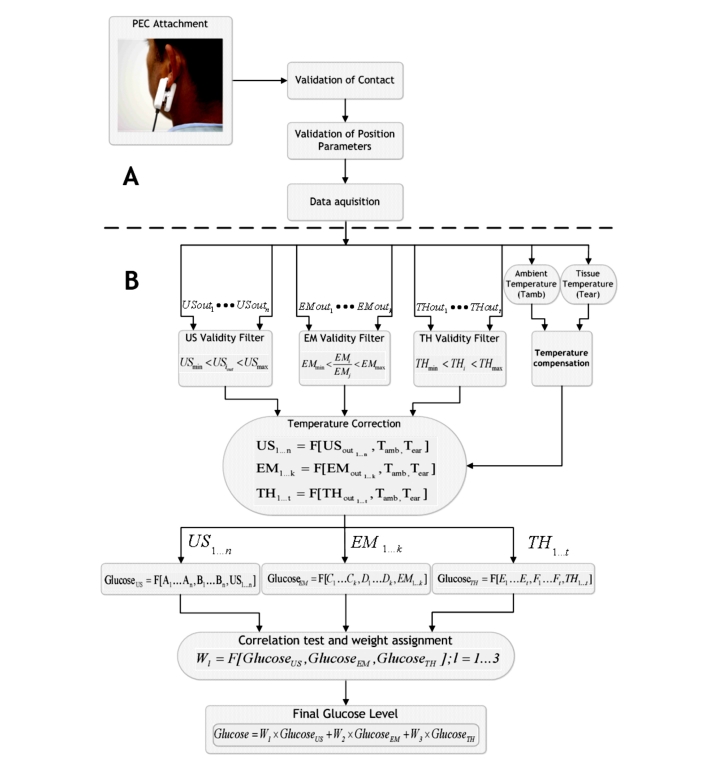
After the calibration, glucose spot measurements can be performed by clipping the sensor to the earlobe for the duration of the measurement (approximately one minute) and removing it afterward (Figure 12A).
Figure 12.
(A) Measurement procedure and (B) schematics of glucose calculation algorithm. US, ultrasonic channel output signal; EM, electromagnetic channel output signal; TH, thermal channel output signal.
Following verification of the sensor position (by the device), using the distance reference established during calibration, the measurement begins (Figure 12A). Each measurement channel produces several outputs, upon which a three-stage signal processing is applied: signal validation and recognition of outliers, temperature compensation, and temperature correction.
In the first stage, for the ultrasonic channel, the signal's amplitude for each elected frequency is checked to ensure proper wave propagation through the tissue.
Since the electromagnetic and ultrasonic sensors are physically mounted on the same area of the tissue, a low measured amplitude points out a poor contact quality. In this case, the measurement is disregarded, and a failure notice is provided to the user. In the thermal technology, the sensor is placed on a different tissue area than the electromagnetic and ultrasonic sensors. Therefore, a good quality contact for the two later technologies does not guarantee the same for the thermal channel. Thus the heating process is also checked for minimal and maximal temperature threshold rise through a validity filter (Figure 12B). Out-of-range rise is regarded as poor contact quality and produces a failure notice to the user. The EMC output is also checked for maximal and minimal deviations between the working frequency range and the adjacent one, as discussed earlier.
Since both the ambient and the tissue temperatures are used for compensation in every measurement channel, they must be checked for validity first. Therefore, in the second stage, the temperatures are tested on correlation relatively to calibration. Therefore, for each measurement, low correlation indicates interference in one of the measured temperatures. The disturbed temperature is first compensated according to the other temperature, and then both are used for signal temperature correction, orchestrated across all three technologies (Figure 12B).
The third stage includes temperature correction for all the technologies' outputs, as discussed earlier. Furthermore, glucose value is calculated for each measurement channel using the model coefficients that were established within the calibration procedure.
The received glucose values from each measurement channel are checked for correlation. Subsequently, weights are assigned to each of the three values according to the degree of correlation. Finally, a weighted combination of the three technologies' outputs produces a more sensitive and accurate glucose reading (Figure 12B).
Clinical Trials
Clinical trials were performed in the Diabetes Unit of Soroka University Medical Center, Beer-Sheva, Israel. The study was approved by the local ethics committee, and all the participants signed a written informed consent prior to participation.
Subjects were over 18 years of age, with at least one anatomically suitable earlobe (between minimum and maximum size). Pregnant and breast-feeding women, subjects undergoing dialysis, and subjects with any skin conditions on their earlobes were ineligible to participate in the study. Furthermore, patients with earlobes less than the minimum allowed size (14 mm in diameter) or above maximum allowed diameter (25 mm) were ineligible as well.
A total of 107 subjects were enrolled in the study, of which 91 subjects (12 type 1 and 79 type 2 diabetes patients) finished the study thus far. Sixteen subjects were dismissed from the study due to calibration failure notice and subjects' unwillingness to repeat the calibration procedure (8 subjects), inability to finish the calibration procedure due to either insufficient postprandial BG increase (2 subjects) or excessive BG increase (over 400 mg/dl, which is the uppermost level of the reference device; 2 subjects), and personal reasons (4 subjects).
In order to ensure realistic conditions, measurements were performed in various random ambient conditions and different preprandial and postprandial states. Readings were taken under varying conditions, e.g., temperature, humidity, while fasting, and after a meal. The trial was performed on two different days per each individual.
Day 1: Subjects underwent calibration using capillary glucose measurements determined by HemoCue® (Glucose 201+). Following calibration, 6 simultaneous measurement pairs, by HemoCue and GlucoTrack glucose monitor (with 10 min intervals between measurements), were made (Figure 13).
Day 2: A “full day” session of approximately 8 to 10 hours took place, where 16 simultaneous measure-ment pairs with GlucoTrack glucose monitor and HemoCue (30-minute intervals between pairs) were taken (Figure 14).
Figure 13.
Measurements in day 1.
Figure 14.
Measurement process during day 2.
During these 8–10 hours, the patient received breakfast, lunch, and one or two fruit snacks in order to produce variability in the glucose profile and generate multiple glucose excursions.
During trials, subjects took their usual chronic medications as they would in real life. In both stages, all GlucoTrack glucose monitor and invasive device-related actions (calibration and measurements) were performed by the trial staff. The intervals between day 1 (calibration and measurements) and day 2 (measurements only) were derived from the availability of the subjects. None of the data collected on the second visit day was used to adjust the calibration model used to predict glucose.
Results
A total of 91 subjects were tested during both steps of the clinical trial period, and 1804 data pairs were collected, which include 32 “failure notices” and 1772 glucose result values provided by the GlucoTrack glucose monitor device. Subject characteristics are as follows: 12 type 1 diabetes patients (6 female, 6 male), 79 type 2 diabetes patients (35 female, 44 male), age 51.0 ± 30.0 years, and body mass index 30.0 ± 10.0 kg/m2.
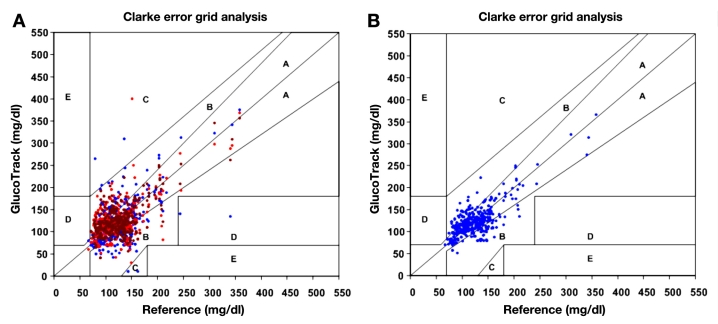
Using Clarke error grid (CEG) analysis,29 96% of the readings on both day 1 and day 2 fall in the clinically acceptable zones A and B (Figure 15A), of which 60% are within zone A. The ARD yields mean and median values of 22.4% and 15.9%, respectively. The CEG for day 2 (Figure 15B) shows 96% of the points in zones A and B, where 57% of the values are in the zone A. Mean and median ARD values for the readings on day 2 are 23.4% and 16.5%, respectively. The intervals between days 1 and 2 were 1 to 22 days, with a median of 6 days.
Figure 15.
(A) Clarke error grid of GlucoTrack glucose monitor readings of all data pairs (1,772 points) for days 1 and 2: 60% in zone A,36% in zone B, 2% in zone C, and 2% in zone D. (B) Clarke error grid of GlucoTrack glucose monitor readings on a different day than calibration (day 2) only (1,225 points): 57% in zone A, 39% in zone B, 2% in zone C, and 2% in zone D.
No increment was observed in the degree of error as a function of the number of days after calibration, as shown in Table 1.
Table 1.
Relationship between the degree of error and time after Calibration.
| 0–6 days after calibration | 7–14 days after calibration | 15–22 days after calibration | |
|---|---|---|---|
| # of subjects | 59 | 28 | 4 |
| Mean ARD (%) | 22.2 | 23.1 | 21.7 |
| Median ARD (%) | 15.8 | 16.5 | 15.5 |
Conclusions
Glucose and other blood solutes influence different tissue properties such as conductivity, permittivity, heat capacity, density, and compressibility in different tissue compartments13 (e.g., interstitium, blood, cells). Thus an integrated measurement of these parameters reflects the glucose concentration and form the basis for NI glucose determinations.
Generally, NI devices (in development stages) producing either trend analysis or continuous glucose values measure physiological phenomena in the tissue parameters changes, correlating with BG.30 However, the actual glucose value derived from such correlation is different than the real glucose value since factors other than glucose influence tissue parameters. These disturbing factors decrease the signal-to-noise ratio and cause inaccuracies in readings.
In order to minimize the impact of those disturbances, a methodology combining multi-technology and multi-sensors is suggested. Each technology measures different tissue parameters that are affected by the same change in glucose concentration. Thus each method per se is indicative of glucose but is confined by the impact of interfering factors due to lack of specificity. Therefore, a simultaneous evaluation of the mentioned physiological changes through measurement of different sets of tissue perturbations, induced by changes in glucose concentration, is expected to increase the validity of the end result.
The presented methodology shows promising results in favor of a multi-technology and multi-sensor approach since this integration contributes to increasing the signal-to-noise ratio. Use of multi-sensors facilitates determination of the quality of the sensors' contact, as well as compensation and correction for the interferences (such as temperature), and accounts for the validity of the measured parameters.
The clinical trials have demonstrated the utility of the device in a wide range of patients, making the GlucoTrack glucose monitor a potential useful solution for SMBG needs of people with diabetes. It could be particularly beneficial due to the long intervals between recalibrations and the ability to perform frequent spot measurements without the need to continuously wear the device. As opposed to invasive devices, the GlucoTrack glucose monitor promotes frequent testing since no pain is involved and no expendables are required. Furthermore, the higher the measurement frequency, the more worthwhile and cost effective the device becomes. The aim of such a NI device is to improve monitoring adherence and to subject diabetes patients to a frequent and painless way to monitor and track their BG, leading to tighter glucose control.
However, the developed and tested glucose-measuring device leaves space for improvement from the accuracy level point of view. A further evolution of the presented approach can be achieved, on one hand, by supplementing additional NI technologies or sensors for a greater minimization of interferences. From a practical point of view, increasing the number of methods or sensors may cause the device to be more complex, up to a level of feasibility limitation. On the other hand, increasing the signal-to-noise ratio may also be achieved through algorithmic evolution, as it was shown in this paper. Therefore, future steps will concentrate on improving the algorithms for signal processing.
Abbreviations
- ARD
absolute relative difference
- BG
blood glucose
- CEG
Clarke error grid
- EM
electromagnetic
- EMC
electromagnetic channel
- HT
heat transfer
- MU
main unit
- NI
noninvasive
- PEC
personal ear clip
- SMBG
self-monitoring of blood glucose
- TH
thermal
- US
ultrasonic
References
- 1.American Diabetes Association. Economic costs of diabetes in the U.S. in 2007. Diabetes Care. 2008;31(3):596–615. doi: 10.2337/dc08-9017. [DOI] [PubMed] [Google Scholar]
- 2.International Diabetes Federation. Diabetes atlas. 4th. Brussels: International Diabetes Federation; 2009. [PubMed] [Google Scholar]
- 3.The Diabetes Control and Complications Trial Research Group. The effect of intensive treatment of diabetes on the development and progression of long-term complications in insulin-dependent diabetes mellitus. N Engl J Med. 1993;329(14):977–986. doi: 10.1056/NEJM199309303291401. [DOI] [PubMed] [Google Scholar]
- 4.UK Prospective Diabetes Study (UKPDS) Group. Intensive blood-glucose control with sulphonylureas or insulin compared with conventional treatment and risk of complications in patients with type 2 diabetes (UKPDS33) Lancet. 1998;352(9131):837–853. [PubMed] [Google Scholar]
- 5.American Diabetes Association. Standards of medical care in diabetes—2006. Diabetes Care. 2006;29(Suppl 1):S4–42. [PubMed] [Google Scholar]
- 6.Schnell O, Alawi H, Battelino T, Ceriello A, Diem P, Felton A, Grzeszczak W, Harno K, Kempler P, Satman I, Verges B. Consensus statement on self-monitoring of blood glucose in diabetes (a European perspective) Diabetes, Stoffwechsel und Herz. 2009;18(4):285–289. [Google Scholar]
- 7.International Diabetes Federation. Guideline on self-monitoring of blood glucose in non-insulin treated type 2 diabetes. Brussels: International Diabetes Federation; 2009. [Google Scholar]
- 8.Mollema ED, Snoek FJ, Heine RJ, Van der Ploeg HM. Phobia of self-injecting and self-testing in insulin-treated diabetes patients: opportunities for screening. Diabet Med. 2001;18(8):671–674. doi: 10.1046/j.1464-5491.2001.00547.x. [DOI] [PubMed] [Google Scholar]
- 9.Davidson MB, Castellanos M, Kain D, Duran P. The effect of self monitoring of blood glucose concentrations on glycated hemoglobin levels in diabetic patients not taking insula blinded, randomized trial. Am J Med. 2005;118(4):422–425. doi: 10.1016/j.amjmed.2004.12.006. [DOI] [PubMed] [Google Scholar]
- 10.Hall RF, Joseph DH, Schwartz-Barcott D. Overcoming obstacles to behavior change in diabetes self-management. Diabetes Educ. 2003;29(2):303–311. doi: 10.1177/014572170302900221. [DOI] [PubMed] [Google Scholar]
- 11.Wagner J, Malchoff C, Abbott G. Invasiveness as a barrier to self-monitoring of blood glucose in diabetes. Diabetes Technol Ther. 2005;7(4):612–619. doi: 10.1089/dia.2005.7.612. [DOI] [PubMed] [Google Scholar]
- 12.Soumerai SB, Mah C, Zhang F, Adams A, Baron M, Fajtova V, Ross-Degnan D. Effects of health maintenance organization coverage of self-monitoring devices on diabetes self-care and glycemic control. Arch Intern Med. 2004;164(6):645–652. doi: 10.1001/archinte.164.6.645. [DOI] [PubMed] [Google Scholar]
- 13.Harman-Boehm I, Gal A, Raykhman AM, Zahn JD, Naidis E, Mayzel Y. Noninvasive glucose monitoring: a novel approach. J Diabetes Sci Technol. 2009;3(2):253–260. doi: 10.1177/193229680900300205. [DOI] [PMC free article] [PubMed] [Google Scholar]
- 14.Freger D, Gal A, Raykhman AM. A method of monitoring glucose level. U.S. Patent 6,954,662. 2005. Oct 11,
- 15.Elmasri RA, Navathe SB. Fundamentals of database systems. 2nd. Boston: Addison-Wesley Longman; 1998. [Google Scholar]
- 16.Zhao Z. Pulsed photoacoustic techniques and glucose determi-nation in human blood and tissue. Ph.D. dissertation. Finland: University of Oulu; 2002. [Google Scholar]
- 17.Toubal M, Asmani M, Radziszewski E, Nongaillard B. Acoustic measurement of compressibility and thermal expansion coefficient of erythrocytes. Phys Med Biol. 1999;44(5):1277–1287. doi: 10.1088/0031-9155/44/5/313. [DOI] [PubMed] [Google Scholar]
- 18.Muramatsu Y, Tagawa A, Kasai T. Thermal conductivity of several liquid foods. Food Sci Technol Res. 2005;11(3):288–294. [Google Scholar]
- 19.Hillier T A, Abbott RD, Barrett EJ. Hyponatremia: evaluating a correction factor for hyperglycemia. Am J Med. 1999;106(4):399–403. doi: 10.1016/s0002-9343(99)00055-8. [DOI] [PubMed] [Google Scholar]
- 20.Moran SM, Jamison RL. The variable hyponatremic response to hyperglycemia. West J Med. 1985;142(1):49–53. [PMC free article] [PubMed] [Google Scholar]
- 21.Wissler EH. Pennes' 1948 paper revisited. J Appl Physiol. 1998;85(1):35–41. doi: 10.1152/jappl.1998.85.1.35. [DOI] [PubMed] [Google Scholar]
- 22.Thomas GH, Watson RM, Noell JO. Method and apparatus for non-invasive monitoring of blood glucose. US Patent 5,119,819. 1992. Jun 9,
- 23.Zips A, Faust U. Determination of biomass by ultrasonic measure-ments. Appl Environ Microbiol. 1989;55(7):1801–1807. doi: 10.1128/aem.55.7.1801-1807.1989. [DOI] [PMC free article] [PubMed] [Google Scholar]
- 24.Sarvazyan A, Tatarinov A, Sarvazyan N. Ultrasonic assessment of tissue hydration status. Ultrasonics. 2005;43(8):661–671. doi: 10.1016/j.ultras.2005.03.005. [DOI] [PubMed] [Google Scholar]
- 25.Genet S, Costalat R, Burger J. The influence of plasma membrane electrostatic properties on the stability of cell ionic composition. Biophys J. 2001;81(5):2442–2457. doi: 10.1016/S0006-3495(01)75891-2. [DOI] [PMC free article] [PubMed] [Google Scholar]
- 26.Hayashi Y, Livshits L, Caduff A, Feldman Y. Dielectric spectroscopy study of specific glucose influence on human erythrocyte membranes. J Phys D Appl Phys. 2003;36(4):369–374. [Google Scholar]
- 27.Park J H, Kim C S, Choi B C, Ham K Y. The correlation of the complex dielectric constant and blood glucose at low frequency. Biosens Bioelectron. 2003;19(4):321–324. doi: 10.1016/s0956-5663(03)00188-x. [DOI] [PubMed] [Google Scholar]
- 28.Gudivaka R, Schoeller D, Kushner RF. Effect of skin temperature on multifrequency bioelectrical impedance analysis. Appl Physiol. 1996;81(2):838–845. doi: 10.1152/jappl.1996.81.2.838. [DOI] [PubMed] [Google Scholar]
- 29.Clarke WL, Cox D, Gonder-Frederick L A, Carter W, Pohl SL. Evaluating clinical accuracy of systems for self-monitoring of blood glucose. Diabetes Care. 1987;10(5):622–628. doi: 10.2337/diacare.10.5.622. [DOI] [PubMed] [Google Scholar]
- 30.Khalil O S. Non-invasive glucose measurement technologies: an update from 1999 to the dawn of the new millennium. Diabetes Technol Ther. 2004;6(5):660–697. doi: 10.1089/dia.2004.6.660. [DOI] [PubMed] [Google Scholar]


