Abstract
Background
This pharmacokinetic (PK) study was designed to characterize the dose response of two concentrations (0.7% and 1%) of a nasal spray of recombinant regular human insulin in combination with cyclopentadecalactone (CPE-215), a compound that enhances absorption of molecules across mucous membranes (Nasulin™, CPEX Pharmaceuticals). Nasulin has been effective in lowering blood glucose in both normal subjects and diabetes patients, and additional dosing options would allow greater titration flexibility.
Method
A five-period crossover study of 24 healthy, nonsmoking subjects (ages 18-50, basal metabolic index <33 kg/m2, weight >70 kg) were studied. Subjects were in a fasted state for 5 h before and 45 min after administration for PK assessment and were then given a meal. Each spray contained 100 μl. Doses tested were 25, 35, 50, 70, and 100 U. Maximum concentration (Cmax) and area under the curve (AUC) were estimated for each dose group. Glucose measurements were also performed.
Results
A dose response (slope of the natural log response versus dose) was demonstrated by baseline-adjusted Cmax of 22, 27, 56, 62, and 84 μU/ml for the 25, 35, 50, 70, and 100 U doses (p < .0001), respectively, and by baseline-adjusted AUC(0–45 min) values of 491, 592, 1231, 1310, and 1894 μU/ml/min (p < .0001). Glucose AUC(0–45 min) determinations also demonstrated a pharmacodynamic (PD) dose response.
Conclusions
Proportional and linear dose responses for both PK and PD parameters were demonstrated for the two concentrations, making multiple doses available for clinical development.
Keywords: intranasal insulin, CPE-215, cyclopentadecalactone, Nasulin, ultra-rapid time action profile
Introduction
The health complications of patients with diabetes mellitus, both types 1 and 2, such as blindness, kidney failure, and premature death are directly related to the ability to maintain glycemic control. The timely delivery of insulin in doses that match the increase in blood glucose after a meal and between meals is a therapeutic challenge. Currently, the practice of attempting to use subcutaneous injections of short-term, fast-acting insulin before meals in conjunction with less frequent administrations of a longer, slower-acting formulation to mimic pancreatic insulin secretion has been able to produce adequate control in general. To date, there is no insulin on the market with an ultra-rapid-acting profile that is able to produce the initial spike of insulin produced by the pancreas in response to a meal.
CPEX Pharmaceuticals has developed a formulation of recombinant human insulin for nasal administration under the trade name Nasulin™. The nasal spray is composed of regular short-acting human recombinant insulin dissolved in water in combination with several common excipients (polysorbate 20, sorbitan monolaurate, cottonseed oil, and cyclopentadecalactone [CPE-215]). The excipient cyclopentadecalactone is a compound that occurs naturally in plants (Angelica archangelica) and is a common constituent of many foodstuffs, cosmetics, and personal hygiene products (e.g., deodorants). In preclinical toxicology studies of three-months'; duration in rats and dogs, no inflammatory reactions were found.
A number of studies have been conducted to date with the Nasulin 1% concentration. Although historical studies with intranasal insulin formulations have typically been hampered by poor bioavailability, even with the addition of absorption enhancers to the formulation,1 the CPEX formulation has shown via serum insulin levels that Nasulin is well absorbed. The insulin in this formulation is absorbed very rapidly and more closely mimics the first-phase insulin response produced by the pancreas.
Phase 1/2 studies have provided preliminary evidence of the efficacy and absorption of Nasulin at higher than 25 U doses, and it appears to be well tolerated in healthy volunteers and diabetes patients (PK008 and SC00504, data on file).2 Also, Study PK008 revealed that two sprays in the same nostril provided more absorption than one spray in each nostril.2 Thus doses could be escalated to 100 U (two sprays in each nostril), adding additional therapeutic benefit as compared to that of doses up to 50 U utilizing one spray in each nostril, which led us to a new direction in the administration technique.
Smoking3 and the normal physiologic nasal cycle4 did not have a clinically significant effect on absorption or glucodynamic effects, but with nasal route of adminis-tration, total nostril blockage decreased the absorption by approximately 50%. There have been transient nasal symptoms of irritation, tickling sensation, and sneezing that are associated with Nasulin administration; however, these symptoms last only a few minutes, are not present with all administrations nor in all patients, and tend to disappear with continued dosing.
Unlike all the currently marketed insulin products, the pharmacokinetic (PK) profile of Nasulin is similar to that of normal pancreatic insulin secretion, peaking in 10–20 min and returning to baseline at around 60 min.5 Glucodynamic activity begins at 10–20 min and peaks at approximately 30–50 min. The advantage of this profile is that it will provide insulin coverage while food is being absorbed and will not be present before subsequent meals. The risk of hypoglycemia may prove to be less with this route of administration compared to that of injectable insulins. It may also allow a more normal anabolic-catabolic cycle, which may lead to weight stability unlike the usual weight gain experienced by patients when injectable insulins are initiated. It could lead to enhanced compliance and earlier insulin use in patients with type 2 diabetes, as well as aid those who do not wish to inject themselves in public.
CPEX Pharmaceuticals is therefore committed to conducting efficacy and safety studies in subjects with type 1 and type 2 diabetes. In addition to the Nasulin 1% concentration, CPEX Pharmaceuticals has developed a new 0.7% concentration to provide additional dose options for the diabetes population. CPEX chose the additional concentration of 0.7% to achieve maximal fractional separation between the four dosing possibi-lities, including two sprays in the same nostril of two concentration formulations: two sprays in one nostril with 0.7%, two sprays in one nostril with 1.0%, two sprays in each of two nostrils with 0.7%, and two sprays in each of two nostrils with 1.0%. The present study was designed to assess the dose response of the full dose range intended for future phase 2b and phase 3 studies, comparing the new 0.7% concentration to the current 1.0% concentration.
Methods
This open-label study in healthy subjects was conducted to compare the PK parameters of 0.7% and 1% concentrations of Nasulin. The study was conducted at the Orlando Clinical Research Center. Prior to study initiation, the protocol for the study, the written informed consent form, as well as all written information provided to subjects were reviewed by the Independent Investigational Review Board of Orlando, Florida.
All subjects provided written, informed consent. Twenty-four healthy, nonsmoking subjects (ages 18–50, basal metabolic index <33 kg/m2, weight >70kg) participated in this five-way crossover study. There is no evidence to suggest different absorption of Nasulin between healthy volunteers and patients, so for ease of recruitment in this study, normal subjects were tested in a fasted state for 45 min following procedures developed in previous studies.2 The weight restriction was included to lessen the incidence of hypoglycemia.
Subjects were admitted the day prior to the first treatment day and remained in the clinic until the end of the last administration day. Prior to administration, the patency of each nostril was determined by alternately blocking each nostril and inhaling in the other nostril. If total blockage was present, the subjects were instructed to gently blow their nose until patency was accomplished before dosing. All subjects self-administered all Nasulin doses, with proper training practice on day 1 using a placebo sprayer.
This study is the PK portion of an eight-way randomized crossover study. The PK portion involving five of the eight administrations is the subject of this paper. The remainder of the study will be reported at a later date. The latest meal the subjects had was at least 5 h before dose administration. Subjects were fasted for 45 min after administration for PK assessment. They were then given a 600 kcal meal. The preparations used in this study were Nasulin 0.7%, administered in an intranasal mode in 35 and 70 U doses (batch number DPT, lot number 901234), and Nasulin Intranasal 1% Insulin Spray, administered in an intranasal mode in 25, 50, and 100 U doses (batch number Catalent, lot number CT0728).
Each spray contained 100 μl. Each spray of the 0.7% provided 17.5 U, and each spray of the 1% provided 25 U. Doses tested were 25 U (one spray of 1% in one nostril), 35 U (two sprays of 0.7% in one nostril), 50 U (two sprays of 1% in one nostril), 70 U (two sprays of 0.7% in each nostril), and 100 U (two sprays of 1% in each nostril). Precisely, the 0.7% has 19.25 U and the 1% has 27.5 U per spray. The amount is rounded for convenience purposes to 17.5 and 25 U per spray, facilitating dose calculation.
As it was not possible to dose all 24 subjects at once, two cohorts of 12 were dosed on consecutive weeks. Two doses were administered each day before breakfast and lunch. Blood samples were taken at -7, -3, 5, 10, 15, 20, 25, 30, 40, and 45 min (10 time points) for determination of insulin (Automated Chemiluminescence Immunoenzymatic Assay system) and glucose levels. All samples were labeled, handled, processed, and shipped according to Orlando Regional Medical Center (ORMC) Standard Operating Procedures and Clinical Laboratory Procedures using the tubes provided by ORMC Clinical Laboratory. Variables considered for insulin were the maximum concentration (Cmax) measured, the area under the (plasma concentration) time curve (AUC(0–45 min), estimated using PK modelling), and time to maximum concentration (Tmax). The pharmacodynamic (PD) effect was assessed by measuring the AUC(0–45 min) (estimated using trapezoidal method). Each PK/PD parameter was analyzed using an analysis of variance model that included the fixed effects of sequence, treatment, and period and the random effects of subjects within sequences and within-subject errors. Linear contrasts were used to estimate the slope of a line passing through: least square mean PK/PD (of each treatment) versus dose (of each treatment). Estimation of the dose-response and inferential analyses of PK parameters were performed based on the insulin data using the natural log transformed AUC(0–45 min) and natural log Cmax estimated from each subject at each dose treatment.
Each subject was individually monitored by trained medical personnel. Bedside glucometer readings (One Touch, LifeScan, Inc.) were performed at each blood draw. If symptoms of hypoglycemia occurred, a last blood sample was immediately taken, glucose was administered, and the subject was then given a meal. Safety data were compiled by regular open-ended questioning of the subjects and by direct reporting of adverse symptoms.
This study was conducted in accordance with the International Conference on Harmonization Guidelines for Good Clinical Practice, with the ethical principles that have their origins in the Declaration of Helsinki, and in compliance with the approved protocol and applicable regulatory requirements. CPEX Pharmaceuticals, Inc., affirmed and upheld the principle of the subjects'; right to protection against the invasion of privacy. Throughout the study, all data were identified only by subject number and subject initials.
Results
Twenty-four subjects who met the inclusion/exclusion criteria were enrolled in and completed the trial. Samples of all subjects were used in the analysis of the data.
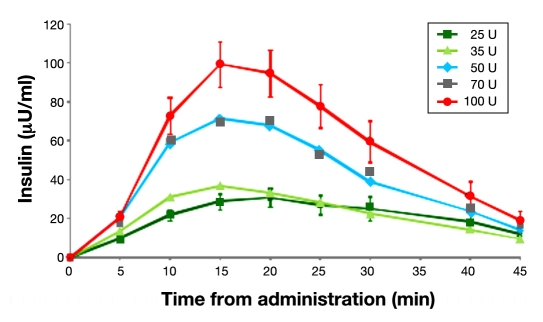
To determine the dose ranges, PK parameters and dose responses of Nasulin 0.7% (a new concentration), in comparison to Nasulin 1%, individual insulin concentration levels after randomized Nasulin administrations of 25, 35, 50, 70, and 100 U doses in the fasted state were analyzed. The distribution of the data indicated that logarithmic transformations were more appropriate. Hence the observed adjusted insulin results of each subject were fitted into the four-parameter model to estimate PK parameters. Figure 1 shows the observed incremental mean total insulin values for the 25, 35, 50, 70, and 100 U doses. These values were adjusted by subtracting the baseline insulin values. Mean (standard deviation) baseline insulin values were 6.73 (6.85) μU/ml. The results do not reflect average Cmax values, which may be found in Table 1.
Figure 1.
Mean observed incremental insulin values (baseline values subtracted) from 24 subjects for doses of 25, 35, 50, 70, and 100 U: 0.7% used for 35 and 70 U doses and 1.0% used for 25, 50, 100 U doses.
Table 1.
Mean Insulin Cmax, AUC(0–45 min), and Tmax by 25, 35, 50, 70, and 100 U Dose
| Dose (U) | Adjusted Cmax (μU/ml) | Adjusted AUC(0–45 min) (μU/min/ml) | Tmax (min) | ||||||
|---|---|---|---|---|---|---|---|---|---|
| GLSMa | SEc | p value H0:Slope:ln(Cmax) versus dose = 0 | GLSMa | SEc | p value H0:Slope: ln(AUC(0–45 min)) versus dose = 0 | LSMb | SEc | p value H0:difference (dose) = 0 | |
| 25 | 22.4 | 3.81 | <.0001 | 490.9 | 92.26 | <.0001 | 18.8 | 1.32 | .8585 |
| 35 | 27.6 | 4.67 | 591.8 | 111.22 | 16 | 1.32 | |||
| 50 | 55.6 | 9.43 | 1230.5 | 231.25 | 16.9 | 1.32 | |||
| 70 | 62.4 | 10.59 | 1309.7 | 246.13 | 16.8 | 1.32 | |||
| 100 | 84.3 | 14.3 | 1894 | 355.94 | 18.4 | 1.32 | |||
Geometric least square mean.
Least square mean.
Standard error of the mean
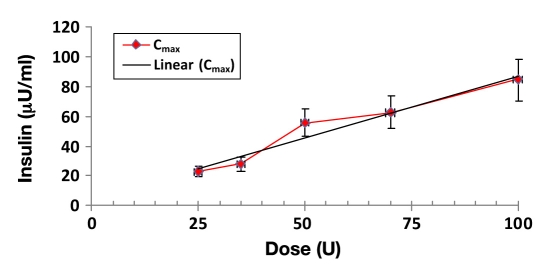
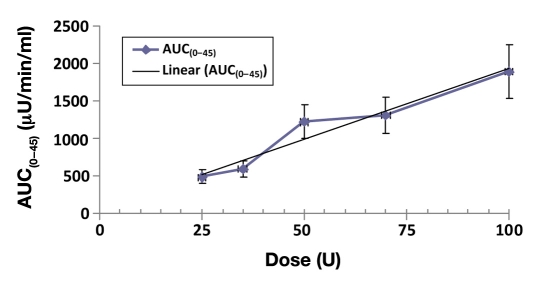
In Figures 2 and 3, there were close to linear dose proportional increases in exposures from the 25 U to the 100 U dose, in terms of both least squares geometric mean Cmax (p < .0001) and AUC(0–45 min) (p < .0001) measures, and there was a strong concordance between the dose exposure relationship determined by Cmax and AUC(0–45 min).
Figure 2.
Mean Cmax dose response of Nasulin 0.7% and 1.0%: 0.7% used for 35 and 70 U doses and 1.0% used for 25, 50, 100 U doses.
Figure 3.
Mean AUC(0–45 min) dose response of Nasulin 0.7% and 1%: 0.7% used for 35 and 70 U doses and 1.0% used for 25, 50, and 100 U doses.
Table 1 displays the mean data for the PK analysis. The highest Cmax was 84.3 (14.3) μU/ml, and the biggest AUC(0–45 min) was 1894.0 (355.94) μU/min/ml, achieved with the 100 U dose administered with two sprays in both nostrils. The p values (<.0001) are significant for both Cmax and AUC(0–45 min), which indicate a linear relationship between exposure and dose. Higher doses lead to higher exposures. However, there was no indication that the higher exposures achieved with the higher doses had any impact when the maximum concentrations were achieved (Tmax, p = .8585, not significant).
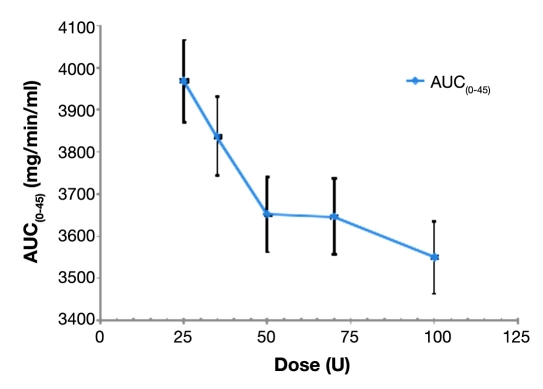
Inferential analyses of PD glucose parameters based on blood glucose levels are shown in Figure 4. There were dose-dependent decreases in subjects'; blood glucose levels after Nasulin administrations from the 25 U to the 100 U dose, and the effects persisted over the period of 45 min, during which subjects'; serum insulin levels and blood glucose levels were monitored. The p value (<.0001) again shows a linear relationship between glucose level and dose. Higher doses result in lower glucose levels. Inferential summary data of glucose AUC(0–45 min) is listed in Table 2.
Figure 4.
Dose response of glucose AUC(0–45 min) after 25, 35, 50, 70, and 100 U doses of Nasulin.
Table 2.
Inferential Summary of Glucose AUC(0–45 min) (mg/min/ml) by 25, 35, 50, 70, and 100 U Dose
| Dose (U) | Geometric Least Square Mean | SEa | p valueH0:Slope: ln(AUC(0–45 min)) versus dose= 0 | |
|---|---|---|---|---|
| 25 | 3967.8 | 97.32 | <.0001 | |
| 35 | 3836.4 | 94.10 | ||
| 50 | 3651.7 | 89.57 | ||
| 70 | 3646.2 | 89.44 | ||
| 100 | 3549.5 | 87.06 |
Standard error of the mean
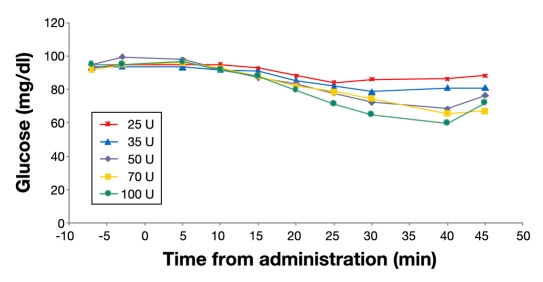
Median glucose values are illustrated in Figure 5. Separation between the 50 and 70 U doses was not apparent in this illustration. The 45-minute values for the 50, 70, 100 U doses show an increase reflecting fewer values, as several values were missing due to the study being stopped in some subjects because of hypoglycemia.
Figure 5.
Median glucose results by dose: 25, 35, 50, 70, and 100 U; N = 24
Summary of Adverse Events
In this study of Nasulin intranasal administration in 24 healthy subjects, concentrations of Nasulin at both 0.7% and 1% were well tolerated, with generally good safety profiles. There were no serious adverse events as defined by the Food and Drug Administration. There were no marked hematological or other laboratory abnormalities, nor were there any events that led to an intervention or significant additional concomitant therapy. All subjects experienced adverse events and probable administration site reactions during the course of the study. All adverse events were of mild intensity except two, which were one event of dizziness of moderate intentisty that resolved and one event of polyuria also of moderate intensity that also resolved in another study. Approximately 50% of the subjects experienced hypoglycemic events that needed treatment with oral carbohydrates. The most noticeable adverse events were probable administration site reactions and, in order of decreasing frequency, included application site irritation, sneezing, increased lacrimation, throat irritation, dysgeusia, headache, cough, nasal congestion, ocular hyperemia, nasal discharge, and mucosal paresthesia. These were transient and mild in severity. All subjects completed the study without early termination or withdrawal from the study due to adverse events.
Discussion
In this study, the dose ranges, PK parameters, and dose responses of Nasulin 0.7% (a new concentration), in comparison to Nasulin 1%, were determined in the healthy volunteers at the fasted state. With Nasulin administrations of the 0.7% and 1% concentrations, substantial dose-dependent increases in insulin exposures were achieved with the 25, 35, 50, 70, and 100 U doses, based on the geometric least squares mean Cmax and AUC(0–45 min) values. The increases in exposure from 25 to 100 U were statistically significant (p < .0001), with the maximum insulin concentration achieved at 84.3 (14.3) μU/ml and the biggest AUC(0–45 min) at 1894.0 (355.94) μU/min/ml with the 100 U dose. The Tmax with Nasulin administrations from 25 to 100 U ranged from 16.0 (1.32) min to 18.8 (1.32) min, and there were no statistically significant differences in Tmax or the uptake and elimination rates between different doses.
While the data clearly demonstrated a dose response through the tested doses, the two 0.7% formulation-based dose point estimates fall below the regression line. This may indicate that a 0.75% concentration might have achieved better separation between the doses in terms of exposure. However, the current addition of this concentration to the availability of doses will make dose titration more accurate, especially in type 1 diabetes patients.
Inversely, based on glucose AUC(0–45 min) of the five different doses, subjects'; blood glucose levels decreased significantly and dose dependently (p < .01) after Nasulin administrations, and the effects persisted over the period of 45 min, during which subjects'; serum insulin levels and blood glucose levels were monitored.
In regard to the adverse event profile, local administrative site reactions occur in most subjects who receive the Nasulin formulation or Nasulin placebo (Nasulin minus insulin). These are usually of mild intensity, as in the present study, where all were reported of mild intensity. In longer-term studies where more than 100 patients have used this preparation over 10–12 weeks (unpublished data), these experiences occur initially and largely abate with continued use of the product. Some patients in whom the symptoms do not abate will discontinue the use of the product.
Conclusions
In this study, substantial dose-dependent exposures of insulin were achieved with repeated administration of the 0.7% and 1% concentrations of Nasulin in a single or both nostrils, with rapid onsets of actions. Higher doses lead to higher exposures in insulin while lowering the glucose levels at the same time. The maximum dose response achieved was with two repeated administrations in each nostril of up to 100 U. Unlike other insulin formulations, increasing the dose did not increase the Tmax. The PD effect was also dose related. Administrative site reactions of brief duration and hypoglycemia events due to the fasting state were the most common events. Two subjects had moderate adverse events, one event being dizziness and one polyuria, both of which resolved spontaneously. Those who do not tolerate the preparation with continued use would not be candidates for long-term use.
Acknowledgment
The authors thank Lance Berman, M.D., M.S., for his contribution to the review of this document.
Abbreviations
- AUC
area under the curve
- Cmax
maximum concentration
- PD
pharmacodynamic
- PK
pharmacokinetic
- ORMC
Orlando Regional Medical Center
- Tmax
time to maximum concentration
References
- 1.Hinchcliffe M, Illum L. Intranasal insulin delivery and therapy. Adv Drug Deliv Rev. 1999;35(2-3):199–234. doi: 10.1016/s0169-409x(98)00073-8. [DOI] [PubMed] [Google Scholar]
- 2.Stote R, Marbury T, Miller M, Strange P. Dose-exposure for two dose strengths of nasal insulin (Nasulin™). Poster presented at the Diabetes Technology Society Meeting; November 5–7, 2009. [Google Scholar]
- 3.Schwartz S, Ryan T, Stote R. Results of a randomized, single-dose 2/3-way crossover comparison study of intranasal insulin spray (Nasulin™) and injectable fast-acting insulin (Humalog®) in normal nonsmoking and smoking subjects. Poster presented at the ADA 67th Scientific Sessions; June 2007. [Google Scholar]
- 4.Leary AC, Dowling M, Cussen K, O';Brien J, Stote RM. Pharmaco-kinetics and pharmacodynamics of intranasal insulin spray (Nasulin) administered to healthy male volunteers: influence of the nasal cycle. J Diabetes Sci Technol. 2008;2(6):1054–1060. doi: 10.1177/193229680800200613. [DOI] [PMC free article] [PubMed] [Google Scholar]
- 5.Stote R, Schwartz S, Dehn C, Strange P. Two randomized crossover glucose clamp studies of NasulinTM and lispro. Poster presented at the Diabetes Technology Society Meeting; November 5–7, 2009. [Google Scholar]


