

Abstract
Background
Tight glycemic control (TGC) in critical care has shown distinct benefits but has also proven to be difficult to obtain. The risk of severe hypoglycemia (<40 mg/dl) raises significant concerns for safety. Added clinical burden has also been an issue. Continuous glucose monitors (CGMs) offer frequent automated measurement and thus the possibility of using them for early detection and intervention of hypoglycemic events. Additionally, regular measurement by CGM may also be able to reduce clinical burden.
Aim
An in silico study investigates the potential of CGM devices to reduce clinical effort in a published TGC protocol.
Methods
This study uses retrospective clinical data from the Specialized Relative Insulin Nutrition Titration (SPRINT) TGC study covering 20 patients from a benchmark cohort. Clinically validated metabolic system models are used to generate a blood glucose (BG) profile for each patient, resulting in 33 continuous, separate BG episodes (6881 patient hours). The in silico analysis is performed with three different stochastic noise models: two Gaussian and one first-order autoregressive. The noisy, virtual CGM BG values are filtered and used to drive the SPRINT TGC protocol. A simple threshold alarm is used to trigger glucose interventions to avert potential hypoglycemia. The Monte Carlo method was used to get robust results from the stochastic noise models.
Results
Using SPRINT with simulated CGM noise, the BG time in an 80–110 mg/dl band was reduced no more than 4.4% to 45.2% compared to glucometer sensors. Antihypoglycemic interventions had negligible effect on time in band but eliminated all recorded hypoglycemic episodes in these simulations. Assuming 4–6 calibration measurements per day, the nonautomated clinical measurements are reduced from an average of 16 per day to as low as 4. At 2.5 min per glucometer measurement, a daily saving of ∼25–30 min per patient could potentially be achieved.
Conclusions
This paper has analyzed in silico the use of CGM sensors to provide BG input data to the SPRINT TGC protocol. A very simple algorithm was used for early hypoglycemic detection and prevention and tested with four different-sized intravenous glucose boluses. Although a small decrease in time in band (still clinically acceptable) was experienced with the addition of CGM noise, the number of hypoglycemic events was reduced. The reduction to time in band depends on the specific CGM sensor error characteristics and is thus a trade-off for reduced nursing workload. These results justify a pilot clinical trial to verify this study.
Keywords: alarm, blood glucose, continuous glucose monitor, glycemic control, hypoglycemia, sensor
Introduction
Critically ill patients often experience high levels of insulin resistance1–7 and stress-induced hyperglycemia, which can negatively impact outcomes.1–3,7,8 Some studies have shown that tight glycemic control (TGC) can reduce intensive care unit (ICU) patient mortality by up to 45%.7,9–11 However, there is a little agreement on what constitutes desirable glycemic performance,12–14 particularly with regard to how TGC affects outcome. Overall, any TGC protocol must reduce elevated blood glucose (BG) levels with minimal hypoglycemia. However, protocols or clinical practices that utilize large insulin doses can suffer from high glycemic variability and excessive hypoglycemia.15 As a result, several clinical trials have not achieved the benefit of TGC.15–18
Hence, there is a significant difficulty in providing protocols that simultaneously provide good performance and TGC without excessive hypoglycemia. Two major causes of hypoglycemia are often reported to be clinical error and, or combined with, infrequent BG measurement using bedside glucometers or blood gas analyzers.17,19–22 Thus continuous glucose monitors (CGMs), with their rapid 2–5 minutes measurement rates, offer the opportunity to better monitor patients so that hypoglycemia could be avoided.
Typically, in most ICU studies, BG is measured every 1–4 h and more frequently only if the levels are already at or near hypoglycemia. More frequent measurement, and even 1–2 hourly measurement, is uncommon due to the clinical effort required.12,19,23 The result can be extremely variable glycemic control, especially with longer measure-ment intervals.24 Thus CGMs may allow more tightly controlled BG levels while minimizing glycemic variability, which has been strongly linked (independent of glycemic levels) with mortality in these cohorts.25,26
There have been relatively few successful investigations of CGMs in critical care use,27 although they are well studied in type 1 diabetes.28–30 In particular, one set of TGC trials using CGM technology was not particularly successful due, in part, to significant sensor noise.31,32 Added sensor noise is a trade-off (in some cases) of the CGM's far higher, automated sampling rate.27,33 The automation of BG measurements could thus also significantly reduce clinical effort while enabling tighter, less variable control. However, any excess sensor noise must be effectively managed. These sensor and algorithm technologies are also constantly evolving with every new generation offering improvements.30
This paper uses data from the Specialized Relative Insulin Nutrition Titration (SPRINT) TGC study.11 It examines 20 ICU patients from a published benchmark cohort34 and, specifically, how they might behave when controlled by the SPRINT TGC protocol driven by simulated CGM measurements rather than the normal 1–2 hourly glucometer measurements. Hypoglycemia detection and prevention are also tested, as CGMs offer the ability to potentially detect and avert these events much earlier than with current methods. This in silico study thus aims to demonstrate that CGM devices coupled with an effective TGC protocol are capable of reducing nursing workload while maintaining safe and effective glycemic control.
Subjects and Methods
Subjects
This study uses patient data from the benchmark cohort, proposed by Chase et al.34 It includes 20 patients who were admitted to the Christchurch hospital ICU during the SPRINT protocol clinical practice change.11 Each patient spent five days or longer on SPRINT, duringwhich some experienced breaks in treatment, typically due to surgery or other clinical changes. Patients who experienced breaks from SPRINT had their BG data segmented into two or more uninterrupted episodes, resulting in 33 individual continuous data sets. Each episode was then treated as an individual “patient” for the purposes of this study. Details of the patient cohort are shown in Table 1. The use of these patient records falls under existing ethics approval granted by the Upper South Regional Ethics Committee, New Zealand.
Table 1.
Cohort Details, Presented as Median (Interquartile Range) Where Applicable
| Number of patients | 33 |
| Age | 68 (59.5–73) |
| Gender | 60% male |
| Length of SPRINT (h) | 167 (81–241) |
| Number of measurements | 102 (57–169) |
| APACHEa II | 19 (16–24) |
| APACHE II risk of Death | 33.6(13.5–51.2) |
APACHE, Acute Physiology and Chronic Health Evaluation
Methods: Continuous Glucose Monitor Noise Models
This study uses two different types of stochastic noise model: one simple Gaussian model based on data from an ICU trial of CGM sensors and one first-order autoregressive model based on an analysis of data from ambulatory type 1 diabetes patients.
Two levels of Gaussian noise model are investigated. The first is designed to produce equivalent simulated CGM BG measurement errors on a similar cohort to those reported by Goldberg and associates27 in a 2004 study of the Medtronic Continuous Glucose Monitoring Sensor (Minimed-Medtronic, Northridge, CA) device in a medical ICU. The second Gaussian model has the magnitude of additive noise reduced by half to simulate any reduction in noise achieved by technological advances in the field since 2004.
The study by Goldberg and associates27 was used as the basis for the noise model, as it was critical care specific and reported a wide range of error statistics. This noise model used was created to match the reported error statistics over the same five BG ranges as reported in the study. In each BG range, the noise is modeled as an independent Gaussian distributed random error with a mean and standard deviation (SD) that matches reported results on a similar ICU cohort.
The first-order autoregressive noise model implemented in this paper is that described by Breton and Kovatchev28 in their 2008 study of CGM error in ambulatory type 1 diabetes patients. This model is based on data from the FreeStyle Navigator CGM sensor (Abbott Diabetes Care, Alameda, CA).
Continuous glucose monitor sensor error consists of a bias due to calibration drift with a random or quasi-random noise superimposed on top. Calibration drift due to sensor degradation over time was not considered in this study, as this factor is controlled by the specific calibration protocol used with the sensor and has not been reported in detail to the authors' knowledge.
Methods: In Silico Continuous Glucose Monitor Measurements
Using a model derived from the clinically validated glucose–insulin model of Lin et al.,35,36 BG profiles were generated incrementally for each patient at 5-minute intervals. As these “actual” BG measurements were sampled in silico, noise was added from a noise model, creating incremental virtual CGM measurement sequences. The sequences range in length from 252 to 9492 measurements (50–1900 minutes).
Methods: Continuous Glucose Monitor Filtering
The virtual CGM sensor BG measurements and error were implemented using MATLAB™ (The Mathworks, Natick, MA). These noisy measurements were filtered incrementally, simulating the process that would be encountered in a real-time clinical setting. Several common filter types were tested, including median, finite impulse response, and infinite impulse response methods. A novel median filter as described by Pretty and colleagues37 was found to be most effective and was used in this study.
Methods: Hypoglycemia Alarm/Intervention Design
This study used a simple threshold algorithm to trigger an alarm and glucose intervention when a hypoglycemic event appeared imminent. Specifically, if two consecutive filtered CGM BG measurements were below 54 mg/dl, an intravenous glucose intervention was triggered. Simulations were performed with different sized glucose interventions (3, 6, 12.5, and 25 g), though held constant for any given simulation. The intervention was given over 3 minutes to approximate the clinical situation. The algorithm also specified there must be a 15-minute period between any interventions to see a significant outcome BG change and further replicate typical clinical practice in this situation.
Methods: Simulating SPRINT with Continuous Glucose Monitor Measurements
A single filtered measurement was taken every 1–2 h from the full sequence of filtered CGM data and used to drive the SPRINT protocol, with no other modifications to the algorithm. Thus using CGM, with all else equal, would save significant nursing time by removing the need for a finger stick measurement every 1–2 h (mean 16 per day).11 More specifically, the SPRINT algorithm and its interventions and intervention frequency were not changed to enable a direct comparison to clinical results and interventions. While the SPRINT protocol only used 1–2 hourly values from CGM sequence, the full set of data were used for the hypoglycemia detection and prevention part of the study.
Methods: Analysis
Monte Carlo simulations were performed using the stochastic noise models, with 10 runs for each of the 33 BG episodes. The baseline simulation was performed once.
Time in the 80–110 mg/dl BG band and number of hypoglycemic events were considered the most important metrics for this investigation. Results from simulations driven by filtered CGM BG readings were compared to baseline results (no added noise). Thus time in band was calculated using only the 1–2 hourly filtered CGM measurements that were used to drive SPRINT, ensuring an equal comparison to the clinical results. Hypoglycemic events were counted as the number of filtered CGM measurements below 40 mg/dl or, in the baseline case, the number of “actual” BG measurements below this level per Monte Carlo run.
Nutrition and insulin interventions prescribed by SPRINT were examined. Differences in these interventions compared to the baseline SPRINT results were analyzed to determine the impact of CGM sensor noise on operation of this protocol. Significant differences might point out the need to customize algorithms or protocols for different types of sensor devices.
Results are presented as nonparametric [median (inter-quartile range [IQR])] or lognormal [mean (1 SD range)] as indicated. Lognormal statistics reflect the skewed (non-Gaussian) results obtained for BG levels.
Results
Monte Carlo simulations of 10 runs were carried out on 33 sets of patient data, providing results for a total of 330 runs. These were repeated for three different noise models and four hypoglycemic intervention dose sizes for a total of 2640 runs. Table 2 shows how the level of control was affected when each of the different noise models was implemented (no interventions for hypoglycemic events). Table 3 shows the results for four different levels of hypoglycemia intervention run with the full Gaussian sensor noise model. The results of the 10 Monte Carlo runs are displayed as median (IQR) where applicable.
Table 2.
Summary Statistics from the Monte Carlo Simulations with Different Noise Models for Both the Whole Cohort and Per–Patient Resultsa
| Summary statistics | Clinical baseline | Half noise, no intervention | Full noise, no intervention | Breton noise, no intervention |
|---|---|---|---|---|
| Num episodes | 33.0 | 33.0 | 33.0 | 33 |
| Total hours | 6881.0 | 6881.0 | 6881.0 | 6881.0 |
| Num 1–2 hourly BG measurements [IQR] | 3953.0 | 3978 [3969–3984] | 4111 [4108–4127] | 4080 [4067–4090] |
| BG median [IQR] (mg/dl) | 105.5 [92.2–119.5] | 105 [91.4–119.4] | 106.7 [91.6–122.0] | 105.3 [91.0–121.6] |
| BG mean (geometric) [IQR] (mg/dl) | 105.9 | 105.16 [104.98–105.20] | 105.98 [105.81–106.06] | 105.15 [105.13–105.26] |
| BG SD (geometric) (mg/dl) | 20.2 | 20.22 [20.21–20.24] | 20.32 [20.32–20.32] | 20.34 [20.33–20.34] |
| % BG within 80–110 mg/dl [IQR] | 49.6 | 50.3 | 45.2 | 47.2 |
| % BG <80 mg/dl [IQR]] | 9.0 | 9.90 [9.73–10.19] | 11.37 [11.25–11.55] | 11.24 [10.93–11.38] |
| % BG <72 mg/dl [IQR] | 3.9 | 4.46 [4.29–4.53] | 5.64 [5.48–5.78] | 5.47 [5.43–5.58] |
| % BG <40 mg/dl [IQR] | 0.0 | 0.04 [0.03–0.08] | 0.05 [0.03–0.07] | 0.10 [0.10–0.12] |
| Num patients <40 mg/dl [IQR] | 1.0 | 2 [1–2] | 2 [1–2] | 3 [2–4] |
| Median insulin rate [IQR] (U/h) | 3.0 [2.0–3.0] | 3.0 [2.0–3.0] | 3.0 [2.0–3.0] | 3.0 [2.0–3.0] |
| Median glucose rate [IQR] (g/h) | 4.6 [3.3–5.9] | 4.6 [3.3–5.9] | 4.6 [3.3–5.9] | 3.9 [3.3–5.2] |
| Number of interventions (where applicable) | 0.0 | 0.0 | 0.0 | 0.0 |
| Per–patient statistics | ||||
| Hours of control [IQR] | 166.0 [71.3–252.7] | 166.0 [71.3–252.2] | 166.0 [70.5–253.0] | 166.0 [71.3–252.2] |
| Num BG measurements [IQR] | 101.0 [43.8–149.5] | 98.0 [44.5–150.7] | 102.0 [43.8–157.2] | 102.0 [43.8–160.5] |
| BG median [IQR] (mg/dl) | 106.8 [102.0–113.4] | 107.1 [102.0–112.0] | 108.5 [104.0–114.0] | 107.3 [102.4–113.4] |
| BG mean (lognormal) (mg/dl) | 109.7 [102.0–116.6] | 108.9 [100.3–116.4] | 109.5 [103.3–115.5] | 108.8 [101.5–115.3] |
| BG SD (lognormal) (mg/dl) | 20.0 [19.6–20.3] | 20.1 [19.5–20.4] | 20.2 [19.8–20.6] | 20.1 [19.8–20.5] |
| Time to <140 mg/dl [IQR] (hours) | 0.0 [0.0–4.0] | 0.0 [0.0–4.0] | 0.0 [0.0–3.2] | 0.0 [0.0–4.0] |
| % patients to <140 mg/dl [IQR] | 100.0 | 100 [100–100] | 100 [100–100] | 100 [100–100] |
| Time to <110 mg/dl [IQR] (hours) | 5.0 [2.0–12.0] | 6.0 [2.0–11.2] | 5.0 [2.0–10.2] | 5.0 [1.8–11.2] |
| % patients to <110 mg/dl [IQR] | 100.0 | 100 [100–100] | 100 [100–100] | 100 [100–100] |
| Median insulin rate [IQR] (U/h) | 3.0 [3.0–3.0] | 3.0 [3.0–3.0] | 3.0 [3.0–3.0] | 3.0 [3.0–3.0] |
| Median dextrose rate [IQR] (g/h) | 4.6 [3.3–5.2] | 4.6 [3.3–5.2] | 3.9 [3.3–5.2] | 3.9 [3.3–5.2] |
Lognormal and nonparametric statistics are used with lognormal as indicated. For summary statistics, IQR is presented across results from all 10 Monte Carlo runs and 33 episodes. For per-patient results, IQR is across median per-patient results.
Table 3.
Summary Statistics from Monte Carlo Simulations of Full-Guassian Noise Model with Intervention. Lognormal or Non-Parametric Statistics are Used with Lognormal as Indicated.
| Summary statistics | Intervention = 3 grams | Intervention = 6 grams | Intervention = 12.5 grams | Intervention = 25 grams |
|---|---|---|---|---|
| Num episodes | 33.0 | 33.0 | 33.0 | 33 |
| Total hours | 6881.0 | 6881.0 | 6881.0 | 6881.0 |
| Num 1–2 hourly BG measurements [IQR] | 4114.5 [4095–4118] | 4095 [4081.5–4117.5] | 4102 [4091–4104] | 4086 [4076–4100] |
| BG median [IQR] (mg/dl) | 106.2 [91.3–121.2] | 106.0 [91.4–120.7] | 106.3 [91.8–121.3] | 106.3 [91.7–121.3] |
| BG mean (geometric) [IQR] (mg/dl) | 105.34 [105.28–105.51] | 105.58 [105.51–105.70] | 105.87 [105.74–105.95] | 106.09 [105.99–106.17] |
| BG SD (geometric) (mg/dl) | 20.3 | 20.3 | 20.3 | 20.3 |
| % BG within 80–110 mg/dl [IQR] | 45.37 [45.03–45.53] | 45.82 [45.66–46.42] | 45.5 [45.33–45.85] | 45.60 [45.31–46.22] |
| % BG <80 mg/dl [IQR]] | 12.17 [11.80–12.32] | 11.69 [11.56–11.82] | 11.48 [11.38–11.52] | 11.38 [11.21–11.45] |
| % BG <72 mg/dl [IQR] | 5.98 [5.73–6.02] | 5.57 [5.37–5.70] | 5.34 [5.27–5.53] | 5.01 [4.89–5.22] |
| % BG <40 mg/dl [IQR] | 0.01 [0–0.05] | 0.01 [0–0.02] | 0 [0–0] | 0.04 [0.02–0.05] |
| Num patients <40 mg/dl [IQR] | 1 [0–2] | 1 [0–1] | 0 [0–0] | 1 [1–2] |
| Median insulin rate [IQR] (U/h) | 3.0 [2.0–3.0] | 3.0 [2.0–3.0] | 3.0 [2.0–3.0] | 3.0 [2.0–3.0] |
| Median glucose rate [IQR] (g/h) | 4.6 [3.3–5.9] | 4.6 [3.3–5.9] | 4.6 [3.3–5.9] | 4.6 [3.3–5.9] |
| Number of interventions (where applicable) | 64.5 | 55.8 | 51.0 | 55.0 |
| Per–patient statistics | ||||
| Hours of control [IQR] | 166.0 [70.5–252.7] | 166.0 [71.3–252.2] | 166.0 [70.5–252.0] | 166.0 [71.3– 252.7] |
| Num BG measurements [IQR] | 102.0 [43.5–159.0] | 102.0 [42.3–160.7] | 102.0 [42.5–158.7] | 100.0 [43.0–157.0] |
| BG median [IQR] (mg/dl) | 107.7 [104.3–112.8] | 107.9 [102.4–114.8] | 108.1 [103.7–114.8] | 108.2 [103.9–112.5] |
| BG mean (lognormal) (mg/dl) | 109.1 [101.3–115.3] | 109.1 [101.8–115.1] | 109.5 [101.7–114.6] | 109.4 [101.2–117.8] |
| BG SD (lognormal) (mg/dl) | 20.2 [19.8 –20.4] | 20.1 [19.7–20.5] | 20.2 [19.8–20.4] | 20.2 [19.7–20.6] |
| Time to <140 mg/dl [IQR] (hours) | 0.0 [0.0–3.2] | 0.0 [0.0–3.2] | 0.0 [0.0–3.2] | 0.0 [0.0–3.2] |
| % patients to <140 mg/dl [IQR] | 100 [100–100] | 100 [100–100] | 100 [100–100] | 100 [100–100] |
| Time to <110 mg/dl [IQR] (hours) | 5.0 [1.8–11.2] | 5.0 [2.0–11.2] | 5.0 [1.8–11.2] | 5.0 [1.8–11.2] |
| % patients to <110 mg/dl [IQR] | 100 [100–100] | 100 [100–100] | 100 [100–100] | 100 [100–100] |
| Median insulin rate [IQR] (U/h) | 3.0 [3.0–3.0] | 3.0 [3.0–3.0] | 3.0 [3.0–3.0] | 3.0 [3.0–3.0] |
| Median dextrose rate [IQR] (g/h) | 3.9 [3.3–5.2] | 3.9 [3.3–5.2] | 3.9 [3.1–5.2] | 3.9 [3.3–5.2] |
The median and IQR BG results show no clinically significant difference between the baseline, reduced noise, full noise, and Breton and Kovatchev28 cases. The time in band is reduced by up to 4.5%, and consequently, the <80, <72, and <40 mg/dl bands are slightly increased. Insulin and glucose interventions are unchanged, but this may also be partially a result of the discretization of these interventions in SPRINT.11,24 Per-patient results are similar for each of the cases. Overall, the changes are not clinically significant.
Again in Table 3, the median and IQR BG results show no clinically significant difference between any of the interventions and the baseline. Interventions have not increased time in any band when compared to results with no intervention in Table 2. The number of inter-ventions and hypoglycemic events decreases with larger hypoglycemic interventions, up to a limit. With a large intervention of 25 g, the number of hypoglycemic events increases. This potentially counterintuitive trend continues with 40 g interventions (results not shown). Overall, the interventions have reduced the number of hypo-glycemic events from 1 in 33 patient episodes to 0.
Figures 1–3 illustrate how a patient's BG profile can change when they receive a 3, 12.5, or 25 g glucose intervention as they head toward a hypoglycemic event. The intervention is identified by the vertical bars in the lower plot of each figure, labeled PN dextrose. The shaded band in the upper plot represents the target BG band (80–110 mg/dl). Filtered CGM BG measurements are shown as crosses.
Figure 1.
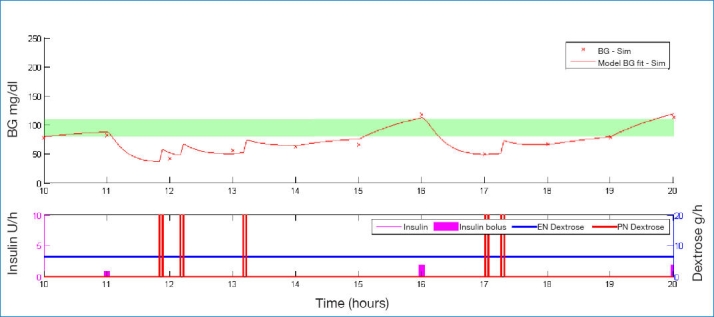
Example of BG profile when intervening with 3 g of glucose.
Figure 3.
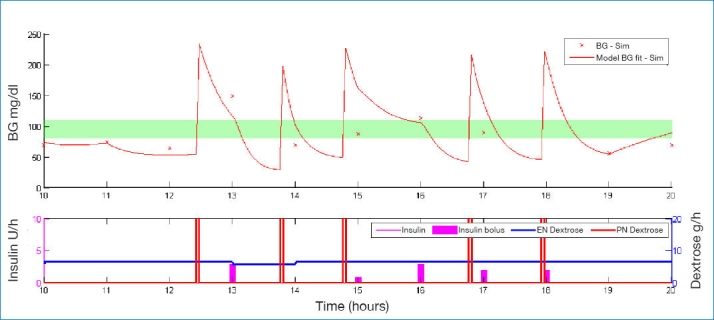
Example of BG profile when intervening with 25 g of glucose.
Figure 2.
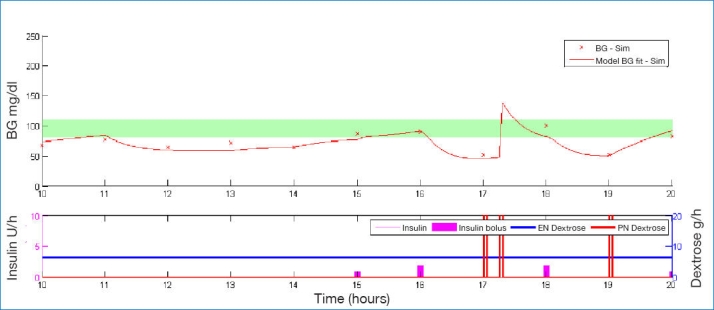
Example of BG profile when intervening with 12.5 g of glucose.
The significantly different-sized steps in BG due to the different interventions show the importance of sizing the intervention appropriately. Too small a dose has little effect and requires an added intervention in the 3 g case of Figure 1. Too large a dose leads to loss of control as in Figure 3. As a form of validation, the size of these glycemic excursions correspond well with intravenous glucosetolerance test data for similar-sized glucose boluses.38,39
Table 3 and Figure 3 further show that an excessive glucose intervention can be as bad for the patient as too small an intervention. The resulting BG is so high the TGC protocol overcompensates with insulin at the next 1–2 hourly intervention and causes a sudden drop, potentially back into a hypoglycemic region. Hence an oversized hypoglycemic intervention can increase variability and (perhaps counterintuitively) increase hypoglycemia due to controller response as well.
The three noise models (two Gaussian models and the Breton and Kovatchev28 model) produced mean absolute percentage errors (MAPEs) on this cohort of 16.0% (full Gaussian), 8.1% (half Gaussian), and 12.2% (Breton and Kovatchev28).
Discussion
Performance
The aims of this in silico study were to show that nursing workload can be reduced, the level of glycemic control maintained, and early hypoglycemic detection implemented using CGM sensors in the ICU, despite potentially high levels of sensor noise in individual measurements. The performance of the CGM sensors in this role was evaluated in silico using Monte Carlo simulations with stochastic CGM noise models and real ICU patient data.
The lack of clinically significant reduction in the BG control metrics shown in Table 2 suggest that the additional noise introduced by the CGM sensors has little effect, at least in the context of the SPRINT protocol. This may be because SPRINT is model-derived and both the inputs and outputs are discretized, so small sensor errors do not generally have a large effect on the protocol-selected insulin and nutrition rates and thus the resulting BG levels. The number of patients experiencing one or more hypoglycemic events (BG ≤40 mg/dl) and the percentage of total BG measurements <40 mg/dl increased when using the simulated CGM sensors to a level that might be considered clinically unacceptable. However, Table 3 shows that using a simple alarm algorithm and appropriately sized glucose intervention can almost eliminate these episodes.
The increase in the number of recorded hypoglycemic episodes with simulated CGM noise could either be due to the added noise causing an underlying normoglycemic level to falsely appear low or adversely affecting the control protocol. However, the similarity in time-in-band results and insulin and nutrition rates seems to suggest that the controller is behaving similarly with the baseline and noisy data. Regardless of the reason for the increase in hypoglycemic events, if CGM sensors were to be used in a clinical situation, the sensor readings would need to be trusted and acted upon. Thus, in addition to hypoglycemia detection, this study also investigated using the CGM BG readings to trigger intravenous glucose boluses to prevent hypoglycemia.
The results in Table 3 show that intervening with a glucose bolus at the onset of potential hypoglycemia has little effect on time in band. The four intervention sizes (3, 6, 12.5, and 25 g) resulted in similar values of around 45.5 ± 0.3%. A separate analysis of the time in band for the entire BG sequence (not just the 1–2 hourly SPRINT measurements) yielded similar results (not shown). All of these results indicate an overall slight increase in variability with increasing sensor noise.
These results (Table 3) outline the importance of sizing the intervention appropriately. Figure 1 shows a typical example of a detected potential hypoglycemic event being counteracted by a 3 g bolus of glucose. The initial glucose bolus was not large enough, so 15–20 minutes later, the patient required a second intervention. Interestingly, at the 25 g infusion, there is a similar trend, as shown in Figure 3. The initial infusion pushes the BG level too high, causing SPRINT to administer too much insulin at the next hour when the patient is already quite sensitive or still has a lot of insulin onboard. This in turn causes the BG to rebound to the point of potential hypoglycemia, requiring another glucose intervention. This potentially counterintuitive trend of increasing interventions and hypoglycemic events continues with 40 g interventions (results not shown) and indicates that the size of the bolus either needs to be carefully selected, maybe on a patient-specific basis, or extra information provided to the control protocol so it can factor in the effect of the bolus at the next intervention.
A final significant result is the reflection on nursing time. Specialized Relative Insulin Nutrition Titration typically requires on average 16 measurements per day at 1.5–2 minutes per measurement (all tasks).11 Assuming four calibration measurements per day, these results would reduce the total measurement burden 75% (12 per day) or 18–24 minutes per patient per day, which is potentially clinically significant in a busy ICU environment.
Some of this potential reduction in clinical burden may be offset by the increase in hypoglycemic episodes triggering alarms and interventions. However, improved alarm algorithms and constantly evolving CGM technology may improve this situation.
Limitations: Clinical
Although the virtual patient simulation method used here is clinically well validated,24,40 this in silico study needs to be confirmed with clinical testing. The BG sequences used to drive SPRINT in this study were model based, not real CGM output data. This analysis provides a strong initial proof of concept; however, testing and validation of the findings in a clinical setting is needed to confirm these results.
Limitations: Signal Processing
Two separate stochastic noise models were used in this study, providing three different CGM sensor noise profiles. The two Gaussian noise profiles are based on data from a study of CGMs in a medical ICU;27 however, the model was created from reported sensor error statistics, and therefore, the time-series information about the errors is lost, and hence they are assumed to be independent. The full-Gaussian noise profile is conservative in that the MAPE is large (16.0%), while the reduced-Gaussian profile may better reflect the magnitude of noise for current sensor technology. The third noise profile was generated using the model of Breton and Kovatchev,28 and while much more complete in terms of modeling glucose diffusion to the interstitium and the interdependence of errors, the model was derived for ambulatory type 1 diabetes patients and is therefore not necessarily the best model for ICU patients.
While not having a validated, ICU-specific CGM noise model, analyzing the results of these three noise profiles shows little difference in performance between them and the baseline, and it is therefore anticipated that real CGM characteristics are captured somewhere between these three simulated models.
True sensor noise characteristics combined with more advanced filtering techniques would likely result in a much cleaner CGM data stream and hence a more reliable method for triggering alarms and interventions. The simple alarm algorithm may also have triggered falsehypoglycemia alarms, furthering the need for a more robust algorithm such as an integral-based method.37,41 Thus a better model would likely improve the perform-ance outcomes and alarm data reported here. Hence these results as presented are potentially conservative.
Calibration drift due to sensor degradation over time was not considered in this study. Without correction, calibration drift will show up as though the actual BG measurements were higher or lower in a relatively consistent manner as the sensor gain drifts.42 This drift would cause the alarm to trigger early (possibly falsely) or late. However, such calibration drift is typically a function of the frequency and quality of calibration measurements, which can likely be controlled more readily in a critical care setting using sensors such as blood gas analyzers. This issue also has not been quantified, to date, in the critical care setting with modern CGM devices.
Summary
Finally, this paper is focused on proof of concept for the integration of CGMs into the ICU. The generally good results seen here with suboptimal filtering and a conservative noise model serve primarily to show that the method is feasible and deserves further direct clinical investigation.
Conclusion
This paper has analyzed in silico the use of CGM sensors with simple filters and hypoglycemia alarms to provide input to the SPRINT TGC protocol. The main results and conclusions include the following:
Continuous glucose monitors, even with significant noise as might (eventually) be found with emerging noninvasive CGM devices, have no significant clinical impact on TGC performance or interventions if relatively simple and common filters are used.
Very simple hypoglycemia alarms can reduce the very low rate of such events (in SPRINT, 2–4% of patients) to zero, although some excessive alarming may also result.
The glucose bolus intervention size is critical. This study found ∼12.5 g to be relatively optimal and that levels of 25–40 g can counterintuitively increase hypoglycemia as the controller (unaltered) seeks to adjust to the sudden BG change. Thus this intervention is also control protocol specific.
The use of CGMs in SPRINT should reduce average nursing burden for measurement up to 75%, potentially saving ∼25–30 minutes per patient per day, which is clinically meaningful in the very busy ICU clinical environment.
All of these results justify clinical testing for validation and highlight the main issues in using CGMs for TGC in critical care.
Acknowledgment
The authors gratefully acknowledge the financial support of a Summer Scholarship 2009–2010 jointly funded by the University of Canterbury and the Tertiary Education Commission of New Zealand and the Tertiary Education Commission of New Zealand Bright Futures Ph.D. Scholarship scheme. Work was performed at the Department of Mechanical Engineering, University of Canterbury, and the Christchurch School of Medicine and Health Sciences, University of Otago.
Abbreviations
- BG
blood glucose
- CGM
continuous glucose monitor
- ICU
intensive care unit
- IQR
interquartile range
- MAPE
mean average percentage error
- SD
standard deviation
- SPRINT
Specialized Relative Insulin Nutrition Titration
- TGC
tight glycemic control
References
- 1.Capes SE, Hunt D, Malmberg K, Gerstein HC. Stress hyper-glycaemia and increased risk of death after myocardial infarction in patients with and without diabetes: a systematic overview. Lancet. 2000;355(9206):773–778. doi: 10.1016/S0140-6736(99)08415-9. [DOI] [PubMed] [Google Scholar]
- 2.Finney SJ, Zekveld C, Elia A, Evans TW. Glucose control and mortality in critically ill patients. JAMA. 2003;290(15):2041–2047. doi: 10.1001/jama.290.15.2041. [DOI] [PubMed] [Google Scholar]
- 3.Krinsley JS. Association between hyperglycemia and increased hospital mortality in a heterogeneous population of critically ill patients. Mayo Clin Proc. 2003;78(12):1471–1478. doi: 10.4065/78.12.1471. [DOI] [PubMed] [Google Scholar]
- 4.McCowen KC, Malhotra A, Bistrian BR. Stress-induced hyper-glycemia. Crit Care Clin. 2001;17(1):107–124. doi: 10.1016/s0749-0704(05)70154-8. [DOI] [PubMed] [Google Scholar]
- 5.Mizock BA. Alterations in fuel metabolism in critical illness: hyper-glycaemia. Best Pract Res Clin Endocrinol Metab. 2001;15(4):533–551. doi: 10.1053/beem.2001.0168. [DOI] [PubMed] [Google Scholar]
- 6.Umpierrez GE, Isaacs SD, Bazargan N, You X, Thaler LM, Kitabchi AE. Hyperglycemia: an independent marker of in-hospital mortality in patients with undiagnosed diabetes. J Clin Endocrinol Metab. 2002;87(3):978–982. doi: 10.1210/jcem.87.3.8341. [DOI] [PubMed] [Google Scholar]
- 7.Van den Berghe G, Wouters P, Weekers F, Verwaest C, Bruyninckx F, Schetz M, Vlasselaers D, Ferdinande P, Lauwers P, Bouillon R. Intensive insulin therapy in the critically ill patients. N Engl J Med. 2001;345(19):1359–1367. doi: 10.1056/NEJMoa011300. [DOI] [PubMed] [Google Scholar]
- 8.Bistrian BR. Hyperglycemia and infection: which is the chicken and which is the egg? JPEN J Parenter Enteral Nutr. 2001;25(4):180–181. doi: 10.1177/0148607101025004180. [DOI] [PubMed] [Google Scholar]
- 9.Van den Berghe G, Wilmer A, Hermans G, Meersseman W, Wouters PJ, Milants I, Van Wijngaerden E, Bobbaers H, Bouillon R. Intensive insulin therapy in the medical ICU. N Engl J Med. 2006;354(5):449–461. doi: 10.1056/NEJMoa052521. [DOI] [PubMed] [Google Scholar]
- 10.Krinsley JS. Effect of an intensive glucose management protocol on the mortality of critically ill adult patients. Mayo Clin Proc. 2004;79(8):992–1000. doi: 10.4065/79.8.992. [DOI] [PubMed] [Google Scholar]
- 11.Lin J, Lee D, Chase JG, Shaw GM, Le Compte A, Lotz T, Wong J, Lonergan T, Hann CE. Stochastic modelling of insulin sensitivity and adaptive glycemic control for critical care. Comput Methods Programs Biomed. 2008;89(2):141–152. doi: 10.1016/j.cmpb.2007.04.006. [DOI] [PubMed] [Google Scholar]
- 12.Mackenzie I, Ingle S, Zaidi S, Buczaski S. Tight glycaemic control: a survey of intensive care practice in large English hospitals. Intensive Care Med. 2005;31(8):1136. doi: 10.1007/s00134-005-2677-2. [DOI] [PubMed] [Google Scholar]
- 13.Schultz MJ, Spronk PE, Moeniralam HS. Tight glycaemic control: a survey of intensive care practice in the Netherlands. Intensive Care Med. 2006;32(4):618–619. doi: 10.1007/s00134-006-0099-4. [DOI] [PubMed] [Google Scholar]
- 14.Gale SC, Gracias VH. Glycemic control needs a standard reference point. Crit Care Med. 2006;34(6):1856–1857. doi: 10.1097/01.CCM.0000220201.72591.43. [DOI] [PubMed] [Google Scholar]
- 15.Meijering S, Corstjens AM, Tulleken JE, Meertens JH, Zijlstra JG, Ligtenberg JJ. Towards a feasible algorithm for tight glycaemic control in critically ill patients: a systematic review of the literature. Crit Care. 2006;10(1):R19. doi: 10.1186/cc3981. [DOI] [PMC free article] [PubMed] [Google Scholar]
- 16.Finfer S, Chittock DR, Su SY, Blair D, Foster D, Dhingra V, Bellomo R, Cook D, Dodek P, Henderson WR, Hébert PC, Heritier S, Heyland DK, McArthur C, McDonald E, Mitchell I, Myburgh JA, Norton R, Potter J, Robinson BG, Ronco JJ NICE-SUGAR Study Investigators. Intensive versus conventional glucose control in critically ill patients. N Engl J Med. 2009;360(13):1283–1297. doi: 10.1056/NEJMoa0810625. [DOI] [PubMed] [Google Scholar]
- 17.Chase JG, Shaw GM, Wong XW, Lotz T, Lin J, Hann CE. Model-based glycaemic control in critical care: a review of the state of the possible. Biomed Signal Processing Control. 2006;1(1):3–21. [Google Scholar]
- 18.Griesdale DE, de Souza RJ, van Dam RM, Heyland DK, Cook DJ, Malhotra A, Dhaliwal R, Henderson WR, Chittock DR, Finfer S, Talmor D. Intensive insulin therapy and mortality among critically ill patients: a meta-analysis including NICE-SUGAR study data. CMAJ. 2009;180(8):821–827. doi: 10.1503/cmaj.090206. [DOI] [PMC free article] [PubMed] [Google Scholar]
- 19.Chase JG, Andreassen S, Jensen K, Shaw GM. Impact of human factors on clinical protocol performance: a proposed assessment framework and case examples. J Diabetes Sci Technol. 2008;2(3):409–416. doi: 10.1177/193229680800200310. [DOI] [PMC free article] [PubMed] [Google Scholar]
- 20.Bhatia A, Cadman B, Mackenzie I. Hypoglycemia and cardiac arrest in a critically ill patient on strict glycemic control. Anesth Analg. 2006;102(2):549–551. doi: 10.1213/01.ane.0000195236.73494.bf. [DOI] [PubMed] [Google Scholar]
- 21.Clayton SB, Mazur JE, Condren S, Hermayer KL, Strange C. Evaluation of an intensive insulin protocol for septic patients in a medical intensive care unit. Crit Care Med. 2006;34(12):2974–2978. doi: 10.1097/01.CCM.0000248906.10399.CF. [DOI] [PubMed] [Google Scholar]
- 22.Braithwaite SS, Edkins R, Macgregor KL, Sredzienski ES, Houston M, Zarzaur B, Rich PB, Benedetto B, Rutherford EJ. Performance of a dose-defining insulin infusion protocol among trauma service intensive care unit admissions. Diabetes Technol Ther. 2006;8(4):476–488. doi: 10.1089/dia.2006.8.476. [DOI] [PubMed] [Google Scholar]
- 23.Carayon P, Gürses AP. A human factors engineering conceptual framework of nursing workload and patient safety in intensive care units. Intensive Crit Care Nurs. 2005;21(5):284–301. doi: 10.1016/j.iccn.2004.12.003. [DOI] [PubMed] [Google Scholar]
- 24.Lonergan T, Le Compte A, Willacy M, Chase JG, Shaw GM, Wong XW, Lotz T, Lin J, Hann CE. A simple insulin-nutrition protocol for tight glycemic control in critical illness: development and protocol comparison. Diabetes Technol Ther. 2006;8(2):191–206. doi: 10.1089/dia.2006.8.191. [DOI] [PubMed] [Google Scholar]
- 25.Krinsley JS. Glycemic variability: a strong independent predictor of mortality in critically ill patients. Crit Care Med. 2008;36(11):3008–3013. doi: 10.1097/CCM.0b013e31818b38d2. [DOI] [PubMed] [Google Scholar]
- 26.Egi M, Bellomo R, Stachowski E, French CJ, Hart G. Variability of blood glucose concentration and short-term mortality in critically ill patients. Anesthesiology. 2006;105(2):244–252. doi: 10.1097/00000542-200608000-00006. [DOI] [PubMed] [Google Scholar]
- 27.Goldberg PA, Siegel MD, Russell RR, Sherwin RS, Halickman JI, Cooper DA, Dziura JD, Inzucchi SE. Experience with the continuous glucose monitoring system in a medical intensive care unit. Diabetes Technol Ther. 2004;6(3):339–347. doi: 10.1089/152091504774198034. [DOI] [PubMed] [Google Scholar]
- 28.Breton M, Kovatchev B. Analysis, modeling, and simulation of the accuracy of continuous glucose sensors. J Diabetes Sci Technol. 2008;2(5):853–862. doi: 10.1901/jaba.2008.2-853. [DOI] [PMC free article] [PubMed] [Google Scholar]
- 29.Klonoff DC. Continuous glucose monitoring: roadmap for 21st century diabetes therapy. Diabetes Care. 2005;28(5):1231–1239. doi: 10.2337/diacare.28.5.1231. [DOI] [PubMed] [Google Scholar]
- 30.Klonoff DC. A review of continuous glucose monitoring technology. Diabetes Technol Ther. 2005;7(5):770–775. doi: 10.1089/dia.2005.7.770. [DOI] [PubMed] [Google Scholar]
- 31.Chee F, Fernando T, van Heerden PV. Closed-loop glucose control in critically ill patients using continuous glucose monitoring system (CGMS) in real time. IEEE Trans Inf Technol Biomed. 2003;7(1):43–53. doi: 10.1109/titb.2003.808509. [DOI] [PubMed] [Google Scholar]
- 32.Chee F, Fernando TL, Savkin AV, van Heeden V. Expert PID control system for blood glucose control in critically ill patients. IEEE Trans Inf Technol Biomed. 2003;7(4):419–425. doi: 10.1109/titb.2003.821326. [DOI] [PubMed] [Google Scholar]
- 33.Clarke WL, Anderson S, Farhy L, Breton M, Gonder-Frederick L, Cox D, Kovatchev B. Evaluating the clinical accuracy of two continuous glucose sensors using continuous glucose-error grid analysis. Diabetes Care. 2005;28(10):2412–2417. doi: 10.2337/diacare.28.10.2412. [DOI] [PubMed] [Google Scholar]
- 34.Chase JG, LeCompte A, Shaw GM, Blakemore A, Wong J, Lin J, Hann CE. A benchmark data set for model-based glycemic control in critical care. J Diabetes Sci Technol. 2008;2(4):584–594. doi: 10.1177/193229680800200409. [DOI] [PMC free article] [PubMed] [Google Scholar]
- 35.Lin J, Lee D, Chase JG, Shaw GM, Le Compte A, Lotz T, Wong J, Lonergan T, Hann CE. Stochastic modelling of insulin sensitivity and adaptive glycemic control for critical care. Comput Methods Programs Biomed. 2008;89(2):141–152. doi: 10.1016/j.cmpb.2007.04.006. [DOI] [PubMed] [Google Scholar]
- 36.Lin J, Lee DS, Chase JG, Hann CE, Lotz T, Wong XW. Stochastic modelling of insulin sensitivity variability in critical care. Biomed Signal Processing Control. 2006;1:229–242. [Google Scholar]
- 37.Pretty CG, Chase JG, Le Compte A, Shaw GM, Signal M. Hypoglycemia detection in critical care using continuous glucose monitors: an in silico proof of concept analysis. J Diabetes Sci Technol. 2010;4(1):15–24. doi: 10.1177/193229681000400103. [DOI] [PMC free article] [PubMed] [Google Scholar]
- 38.Hovorka R, Shojaee-Moradie F, Carroll PV, Chassin LJ, Gowriei J, Jackson NC, Tudor RS, Umpleby AM, Jones RH. Partitioning glucose distribution/transport, disposal, and endogenous production during IVGTT. Am J Physiol Endocrinol Metab. 2002;282(5):E992–E1007. doi: 10.1152/ajpendo.00304.2001. [DOI] [PubMed] [Google Scholar]
- 39.Vicini P, Caumo A, Cobelli C. The hot IVGTT two-compartment minimal model: indexes of glucose effectiveness and insulin sensitivity. Am J Physiol. 1997;273(5 Pt 1):E1024–E1032. doi: 10.1152/ajpendo.1997.273.5.E1024. [DOI] [PubMed] [Google Scholar]
- 40.Chase JG, Shaw GM, Lotz T, LeCompte A, Wong J, Lin J, Lonergan T, Willacy M, Hann CE. Model-based insulin and nutrition administration for tight glycaemic control in critical care. Curr Drug Deliv. 2007;4(4):283–296. doi: 10.2174/156720107782151223. [DOI] [PubMed] [Google Scholar]
- 41.Chase JG, Hann CE, Jackson M, Lin J, Lotz T, Wong XW, Shaw GM. Integral-based filtering of continuous glucose sensor measurements for glycaemic control in critical care. Comput Methods Programs Biomed. 2006;82(3):238–247. doi: 10.1016/j.cmpb.2006.03.004. [DOI] [PubMed] [Google Scholar]
- 42.Kuure-Kinsey M, Palerm CC, Bequette BW. A dual-rate Kalman filter for continuous glucose monitoring. Conf Proc IEEE Eng Med Biol Soc. 2006;1:63–66. doi: 10.1109/IEMBS.2006.260057. [DOI] [PubMed] [Google Scholar]