

Summary
We genetically dissect the contribution of the most prominent downstream translational components of mTOR signaling toward Akt-driven lymphomagenesis. While phosphorylation of rpS6 is dispensable for cancer formation, 4EBP-eIF4E exerts significant control over cap-dependent translation, cell growth, cancer initiation, and progression. This effect is mediated at least in part through 4EBP-dependent control of Mcl-1 expression, a key antiapoptotic protein. By using an active site inhibitor of mTOR, PP242, we show a marked therapeutic response in rapamycin-resistant tumors. The therapeutic benefit of PP242 is mediated through inhibition of mTORC1-dependent 4EBP-eIF4E hyperactivation. Thus, the 4EBP-eIF4E axis downstream of mTOR is a druggable mediator of translational control and Akt-mediated tumorigenesis that has important implications for the treatment of human cancers.
Introduction
The phosphoinositide 3-kinase (PI3K) signaling pathway is one of the most frequently deregulated pathways found in cancer. A major downstream target of PI3K is the serine/threonine kinase Akt (Cantley, 2002). Akt was first identified as an oncogene transduced by a murine retrovirus that induces thymic lymphomas (Staal, 1987). Akt is frequently hyperactivated in human solid tumors and hematologic malignancies (Yuan and Cantley, 2008). The mammalian target of rapamycin (mTOR) kinase is a key downstream transducer of this signaling pathway that links upstream nutrient availability and growth factors to the control of cell growth and protein synthesis (Figure 1A) through phosphorylation of key translational components (Kim et al., 2002; von Manteuffel et al., 1997). The mTOR kinase assembles with either Raptor or Rictor to generate two functionally distinct complexes, mTOR complex 1 and 2 (mTORC1 and mTORC2), respectively (Guertin and Sabatini, 2007). The two most prominent and well-characterized translational regulators activated by the mTOR kinase, downstream of mTORC1, are eIF4E binding proteins 4EBP1, 4EBP2, and 4EBP3 (4EBPs) and ribosomal protein S6 (rpS6) (Figure 2A) (Hay and Sonenberg, 2004). 4EBP1 is the most studied of all 4EBPs and is a known binding partner of eIF4E, a key rate-limiting initiation factor for cap-dependent translation. Phosphorylation of 4EBP1 by mTORC1 leads to its dissociation from eIF4E and allows eIF4E to form an active initiation complex at the 5′ end of mRNAs (Ruggero and Sonenberg, 2005). The phosphorylation of rpS6 has been used extensively as a read out for PI3K-Akt-mTOR activation; however, its function in protein synthesis control is poorly understood (Ruvinsky and Meyuhas, 2006). A growing body of evidence suggests that deregulations in protein synthesis control may be important for tumor formation. For example, eIF4E has been shown to act as an oncogene in vivo in transgenic mice and in adoptive transfer models when overexpressed in combination with Myc (Ruggero et al., 2004; Wendel et al., 2004). In addition, mTORC1 signaling has been shown to be important in Akt-mediated cellular transformation (Skeen et al., 2006) and perturbations in translational control have been observed downstream of oncogenic Akt and Ras signaling (Rajasekhar et al., 2003). While these findings implicate that deregulations in translation control may have a causal effect in tumorigenesis, the extent to which these changes directly contribute to cancer formation and therapeutic response downstream of PI3K-Akt-mTOR signaling remains unresolved.
Figure 1. The Ability of PI3K-Akt-mTOR Signaling to Augment Protein Synthesis Is Necessary for Its Oncogenic Potential.

(A) Schematic representation of the PI3K-Akt-mTOR pathway and the genetic strategy to restore protein synthesis to normal levels using a mouse minute mutant, haploinsufficient for ribosomal protein L24.
(B) Cell size analysis of thymocytes from the indicated genotypes (**p < 0.00001; *p < 0.0009, n > 5/genotype).
(C) Protein synthesis levels in thymocytes measured by [35S]-methionine incorporation and TCA precipitation. The graph represents percentage of increase over WT levels (n = 6/genotype). *p = 0.0006 and **p = 0.008.
(D) Transgenic CMV-Cap-HCV-IRES animals harboring a translational dicistronic luciferase reporter.
(E) CMV-Cap-HCV-IRES mice were crossed with AKTT and cap-dependent translation (Renilla luciferase activity) and IRES-mediated translation (Firefly luciferase activity) were measured (n = 3/genotype, p = 0.004; n.s., no statistical significance).
(F) Kaplan-Meier curve showing lymphoma-free survival in AKTT (n = 19) and AKTT;L24+/− (n = 14) mice (p = 0.0006). Data are presented as the average ± SEM. See also Figure S1.
Figure 2. Phosphorylation of 4EBP1, but Not rpS6, Is Required for Increased Protein Synthesis and Cell Size Control Downstream of Oncogenic Akt Signaling.

(A) Schematic representation of the PI3K-Akt-mTOR pathway and the genetic strategy to specifically inhibit rpS6 phosphorylation or eIF4E hyperactivation.
(B) Representative western blot analysis showing the hyperphosphorylation status of pAkt, p4EBP1, and prpS6 in AKTT thymocytes. Western blot analysis of total Akt, 4EBP1, and rpS6 in AKTT thymocytes is included.
(C) A representative cap-binding assay to analyze eIF4E-eIF4G complex formation in thymocyte cell lysates of WT, AKTT, AKTT;4EBP1M, and 4EBP1M mice and densitometry of eIF4G/eIF4E ratio (n = 3/genotype) (*p < 0.05; n.s., no statistical significance). The eIF4E complex bound to the cap analog m7GTP-sepharose was pulled down and western blotted with antibodies against eIF4G and 4EBP1 revealed the relative amounts of eIF4E-associated proteins. The anti-4EBP1 antibody recognizes both the endogenous 4EBP1 and the 4EBP1M proteins.
(D) Protein synthesis rates in thymocytes derived from AKTT, AKTT;4EBP1M, and AKTT;rpS6P−/− mice were measured by [35S]-methionine incorporation and TCA precipitation represented as percentage of increase over WT levels; *p = 0.0006; **p = 0.001, n > 6/genotype.
(E) Cell size analysis of thymocytes from the indicated genotypes; **p < 0.00001, n = 8; *p < 0.0007, n = 6. Data are presented as the average ± SEM. See also Figure S2.
Significance.
The distinct functional contribution of key translational components activated by the oncogenic PI3K-Akt-mTOR signaling pathway on tumorigenesis remains unresolved. We demonstrate that, surprisingly, while phosphorylation of rpS6 is dispensable for Akt-mediated lymphomagenesis, eIF4E plays a critical function in control of protein synthesis rates, cell growth, and tumorigenesis. eIF4E controls survival of T cell progenitors, at least in part, through translational control of Mcl-1, a key antiapoptotic protein. These findings provide a mechanistic rationale for the therapeutic inefficacy of rapamycin in the treatment of many human cancers. Indeed, we show in vivo that inhibition of the 4EBP1/eIF4E axis is important for the therapeutic efficacy of an ATP active-site inhibitor of mTOR (PP242) in treating rapamycin-resistant tumors.
It has been difficult to genetically and pharmacologically restore increased protein synthesis downstream of oncogenic PI3K-Akt-mTOR signaling to normal levels. Moreover, the specific and relative contribution of the two major downstream translational components, 4EBPs and rpS6, in the multistep process leading to cancer remains poorly understood. This has hindered our understanding of the relevant downstream translational targets of mTORC1 that may be important for therapeutic response. Current inhibitors of mTOR, including rapamycin, a macrolide that inhibits mTORC1 function, and rapamycin analogs (rapalogs), show surprisingly limited clinical efficacy (Guertin and Sabatini, 2009). Importantly, while rapamycin's inhibition of mTORC1 leads to dephosphorylation of rpS6, it does not efficiently target 4EBP1 hyperphosphorylation (Choo et al., 2008). A class of active site inhibitors of mTOR more efficiently block 4EBP-eIF4E hyperactivation and cap-dependent translation, although their therapeutic benefit in PI3K-Akt-mTOR-mediated tumor formation has not been tested in vivo to date (Feldman et al., 2009; Thoreen et al., 2009). In this work, we both genetically and pharmacologically dissect the relevance of increased protein synthesis downstream of oncogenic mTOR signaling in T cell lymphomagenesis and delineate the specific contributions of 4EBPs and rpS6 phosphorylation to this process.
Results
Genetic Rescue of Increased Protein Synthesis to Normal Levels Downstream of Akt Hyperactivation Impairs Cancer Formation
Transgenic mouse models in which the minimal Lck (leukocyte-specific protein tyrosine kinase) promoter is used to drive expression of constitutively activated forms of Akt1, Akt2, or Akt3 in immature T cells develop spontaneous thymic lymphomas (Malstrom et al., 2001; Mende et al., 2001; Tan et al., 2008). Thus, these animals serve as an important in vivo model system to study Akt-mediated tumorigenesis. Mice in which a constitutively active Akt2 is expressed in immature T cells under the Lck promoter (herein referred to as AKTT) (Tan et al., 2008) show an increase in cell size (Figure 1B). We asked whether the Akt-dependent increase in cell size is associated with an increase in general protein synthesis. Thymocytes derived from AKTT mice exhibit an almost 50% increase in protein synthesis compared to wild-type (WT) mice prior to tumor formation, as assessed by [35S]-methionine incorporation (Figure 1C). We further assessed whether Akt-induced protein synthesis increased cap- and/or IRES-dependent translation. To address this question, we have generated CMV-Cap-HCV-IRES transgenic mice that stably express a genetically encoded translational reporter for cap- and IRES-dependent translation in all tissue types (C. Bellodi and D.R., unpublished data). CMV-Cap-HCV-IRES mice express a bicistronic mRNA where the first cistron (Rluc) is translated via cap-dependent translation and the second cistron (Fluc) is translated under a cap-independent mechanism through the Hepatitis C virus (HCV) IRES element. The HCV IRES element provides a general readout of IRES-dependent translation activity and therefore represents a genetic tool to quantify differences in overall IRES-dependent translation initiation in vivo. We observed that Akt-mediated increases in protein synthesis rates are specifically at the level of cap-dependent translation, as we did not observe any difference in IRES-mediated translation in AKTT;CMV-Cap-HCV-IRES transgenic mice in vivo and with an additional bicistronic construct containing a cellular IRES element ex vivo (Figures 1D and 1E and Figure S1A, available online). Thus, increases in cap-dependent translation and cell size are associated with AKT oncogenic activation.
To date, it has been difficult to genetically restore increases in protein synthesis downstream of Akt hyperactivation to normal levels to assess their impact on cancer formation. First described in Drosophila, a class of minute mutants that are haploinsufficient for certain ribosomal proteins show decreases in global protein synthesis rates that are compatible with overall tissue homeostasis (Lambertsson, 1998; Schultz, 1929). Mouse minute mutants, such as ribosomal protein L24+/− mice, are viable (Oliver et al., 2004) and do not show any overt differences in B and T lymphocyte development, growth, and cell division (Barna et al., 2008). L24+/− mice have been successfully used as a genetic tool to restrain increases in protein synthesis in Eμ-Myc mice (Barna et al., 2008). However, lowering protein synthesis rates does not have any effect on tumorigenesis initiated by loss of p53 function (Barna et al., 2008). These findings point to the specificity and differential requirements for increased protein synthesis downstream of oncogenic lesions that directly impinge on translational control as an early mechanism for cellular transformation. By lowering the threshold of protein production in L24+/− mice (Figure S1B), the increased protein synthesis rates and cell size observed in AKTT thymocytes were restored to normal levels in AKTT;L24+/− mice (Figures 1B and 1C). This enabled us to genetically address the extent to which increases in protein synthesis play a causative role in PI3K-Akt-mTOR-mediated tumorigenesis. AKTT mice develop T cell lymphomas with an onset of 3 months of age. The onset of lymphomas in AKTT;L24+/− mice is dramatically delayed in comparison (Figure 1F). Strikingly, 80% of AKTT mice succumb to lymphomas by 150 days, but no AKTT;L24+/− mice develop lymphomas during the same period of time. Most importantly, over 70% of AKTT;L24+/− mice are lymphoma-free. We ruled out the possibility that loss of function of L24 was associated with a cellular stress response that would induce p53 expression, contributing to the enhanced survival of AKTT;L24+/− mice. We did not observe induction of p53 protein levels in lymphocytes from L24+/− and AKTT;L24+/− mice (Figure S1C). In addition, L24 haploinsufficiency does not alter the phosphorylation status of downstream targets of the Akt pathway, either at the steady state or in conjunction with oncogenic Akt signaling (Figure S1D). These genetic results demonstrate that the ability of Akt to augment protein synthesis is necessary for its oncogenic potential.
Genetic Dissection of Translational Components Downstream of mTORC1 Reveals a Critical Function for 4EBPs, but Not rpS6, in Akt-Mediated Tumorigenesis
Having established that control of protein synthesis plays a causal role in PI3K-Akt-mTOR signaling, we next used a series of unique genetic mouse models to assess the role of specific translational components that are directly activated downstream of mTOR oncogenic signaling in cancer initiation. The two most prominent and well-characterized translational regulators activated by the mTOR kinase are the eIF4E binding proteins 4EBP1, 4EBP2, and 4EBP3 and rpS6 (Figure 2A) (Ruggero and Sonenberg, 2005). Of the three 4EBPs, 4EBP1 is the best characterized. AKTT thymocytes display an increase in both rpS6 and 4EBP1 phosphorylation levels as compared to WT controls (Figure 2B). The phosphorylation of 4EBPs by mTOR in response to PI3K activation causes dissociation of the cap-binding protein eIF4E from 4EBPs and stimulates cap-dependent translation. Phosphorylation of rpS6 is achieved by S6 kinases, which are direct targets of mTOR (Kim et al., 2002; Kozma et al., 1990). The role of rpS6 in translational control remains poorly understood (Ruvinsky et al., 2005; Stolovich et al., 2002; Tang et al., 2001). The lack of adequate genetic mouse models has made it difficult to address the relative contribution of rpS6 and eIF4E hyperactivation in translational control and tumorigenesis downstream of oncogenic PI3K-Akt-mTOR signaling. As rpS6 and eIF4E may have constitutive functions in control of protein synthesis required for cell viability and tissue homeostasis, we sought to only selectively restore the consequences of their hyperactivation downstream of mTOR activation. To this end, we used rpS6 phosphorylation-deficient knockin mice (rpS6P−/−) (Ruvinsky et al., 2005) or a mutant 4EBP1 transgenic mouse (see below) to restore rpS6 and eIF4E hyperactivation, respectively, to normal levels downstream of oncogenic PI3K-Akt-mTOR signaling (Figure 2A).
The 4EBP1 protein is directly phosphorylated by mTOR on T37 and T46, which primes subsequent phosphorylation on S65 and T70 (Gingras et al., 1999a, 2001). The phosphorylation of 4EBP1 by mTOR in response to PI3K activation decreases its affinity for eIF4E, allowing eIF4G and associated factors to bind to eIF4E (Brunn et al., 1997; Gingras et al., 1998). An increase in eIF4E bound to eIF4G results in augmented cap-dependent translation as the assembly of this complex triggers the recruitment of the 40S ribosomal subunit to the 5′ cap, thereby initiating cap-dependent translation (Gingras et al., 1999b). To investigate the consequence of eIF4E hyperactivation in AKTT mice, we generated a thymus-specific 4EBP1 phosphorylation-defective transgenic mouse (4EBP1M), where each of the five insulin- and rapamycin-responsive 4EBP1 phosphorylation sites have been mutated to alanine (Figure 2A and Figures S2A–S2C). The binding of 4EBP1 and eIF4G to eIF4E are mutually exclusive, as they compete for the same binding site (Haghighat and Sonenberg, 1997). As such, hypophosphorylated 4EBP1 directly competes with eIF4G for eIF4E binding, while the hyperphosphorylated form is a less efficient competitor. Therefore, as a consequence of Akt hyperactivation, the coexpression of exogenous 4EBP1M is predicted to compensate for the decreased efficiency of the endogenous 4EBP(s) to bind eIF4E (Avdulov et al., 2004).
At first, we analyzed the extent of the interaction between eIF4E and eIF4G in thymocytes derived from AKTT and AKTT; 4EBP1M transgenic mice compared to their respective controls by using a cap pull-down assay (Figure 2C). In this assay, eIF4E present in thymocyte lysates binds tightly to sepharose beads coated with the cap analog 7-methyl GTP (m7GTP), allowing proteins bound to eIF4E to be examined. AKTT thymocytes display hyperphosphorylation of 4EBP1, which is concomitantly associated with an increase in eIF4E-eIF4G complex formation (Figure 2C). Expression of the 4EBP1M transgene in thymocytes derived from AKTT;4EBP1M mice selectively restores the amount of eIF4G bound to eIF4E to normal levels (Figure 2C). Notably, 4EBP1M cells display only a slight decrease in eIF4E-eIF4G complex formation compared to WT cells, indicating that the 4EBP1M transgene selectively inhibits eIF4E hyperactivation downstream of oncogenic Akt signaling but does not perturb steady-state eIF4E activity. This is consistent with the fact that endogenous, hypophosphorylated 4EBP1 and 4EBP2 are both highly expressed in the thymus and that at steady state 4EBP1M competes with both for eIF4E binding (Figure S2D). These results indicate that a balance between endogenous 4EBPs and exogenous 4EBP1M proteins allows for the maintenance of basic cellular functions and does not have a functional impact on cap-dependent translation in a WT background (Figures S1B and S2D). Indeed, 4EBP1M mutant mice do not exhibit decreases in protein synthesis (Figure S1B) and show normal thymopoiesis (Figure S2C). Therefore, the 4EBP1M protein predominantly blocks eIF4E hyperactivation downstream of oncogenic Akt signaling. As such, 4EBP1M mice are an important genetic tool to selectively restrain eIF4E hyperactivation downstream of oncogenic Akt signaling in a tissue-specific manner.
To determine whether phosphorylation of 4EBP1 or rpS6 by the mTOR kinase is directly responsible for augmented protein synthesis downstream of oncogenic Akt signaling, we intercrossed AKTT mice with either 4EBP1M or rpS6P−/− mice. Importantly, phosphorylation-deficient 4EBP1 and/or rpS6 proteins do not exert any dominant-negative effect on mTORC1 or S6 kinase activity, respectively (Figure S2E). The increased rate of protein synthesis in Akt-overexpressing thymocytes prior to tumor formation is significantly rescued in AKTT;4EBP1M mice (Figure 2D). Unexpectedly, despite the fact that rpS6P−/− cells show a 20% reduction in protein synthesis capacity compared to WT thymocytes (Figure S1B), inhibiting phosphorylation of rpS6 does not restore augmented protein synthesis rates downstream of oncogenic Akt signaling. Unexpectedly, and on the contrary, AKTT;rpS6P−/− cells show an even higher rate of protein synthesis compared to AKTT cells (Figure 2D and Discussion). In agreement with these results, increased cell size evident in AKTT thymocytes is restored to normal levels in AKTT;4EBP1M thymocytes, but not in AKTT;rpS6P−/− cells (Figure 2E). These findings demonstrate a dichotomy of the in vivo requirement for phosphorylation of 4EBP1 and/or rpS6 in the control of protein synthesis downstream of oncogenic Akt signaling and they highlight the specificity in quantitative translation control and regulation of cell size mediated by 4EBP1.
These results led us to next assess the physiological relevance of eIF4E-dependent increases in protein synthesis downstream of Akt hyperactivation in tumorigenesis. Notably, the onset of lymphomagenesis in AKTT;4EBP1M mice is dramatically delayed compared to AKTT mice and, most importantly, 60% of AKTT;4EBP1M mice do not develop lymphomas (Figure 3A). Interestingly, within the subset of AKTT;4EBP1M mice that eventually go on to develop lymphomas, increases in protein synthesis are observed in these tumors (Figure S3A). These findings suggest that additional genetic lesions can arise in a subset of AKTT;4EBP1M mice, which lead to increases in protein synthesis and allow for cancer formation. In agreement with the fact that protein synthesis and cell growth are not restrained in AKTT;rpS6P−/− mice, we did not observe any difference in lymphomagenesis between AKTT and AKTT;rpS6P−/− mice (Figure 3B). These results demonstrate that the mTOR-4EBP1-eIF4E arm of Akt signaling is a major and specific effector of protein synthesis control and is critically required for PI3K-Akt-mTOR oncogenic activity. Moreover, while phosphorylation of rpS6 is a commonly used readout of mTOR activation, it is dispensable for Akt-mediated tumorigenesis.
Figure 3. Hyperactivation of eIF4E Is Essential for T Cell Lymphomagenesis Downstream of Oncogenic PI3K-Akt-mTOR Signaling, while Phosphorylation of rpS6 Is Dispensable.

Kaplan-Meier analysis of lymphoma-free survival in two independent cohorts of AKTT (n = 26) and AKTT;4EBP1M (n = 25) mice (A), p = 0.0001, and AKTT (n = 19) and AKTT;rpS6P−/− (n = 18) mice (B), p = 0.3319. See also Figure S3.
Downstream of Oncogenic Akt Signaling, 4EBP-eIF4E Specifically Controls T Cell Progenitor Survival, at Least in Part, through Expression of the Antiapoptotic Protein Mcl-1
We next investigated the cellular consequences of increased eIF4E activity and protein synthesis during Akt-mediated lymphomagenesis. The development of T cell precursors is marked by prescribed changes in the expression of differentiation antigens CD4, CD8, CD44, and CD25, which can be used to divide thymocytes into distinct subsets. Early thymocyte progenitors lack CD4 and CD8 expression and are termed double-negative (DN) cells. The DN stage is subdivided into four categories. The DN1 stage is characterized by surface expression of CD44 (CD44+CD25−). Maturation of this earliest thymocyte subset then proceeds from the DN2 stage (CD44+CD25+) to the DN3 stage (CD44−CD25+) and finally to the DN4 stage (CD44−CD25−) (Shortman and Wu, 1996; Zuniga-Pflucker, 2004). The Lck proximal promoter that drives AKTT and 4EBP1M expression first becomes active at the DN2 stage (Buckland et al., 2000), and therefore the effects of oncogenic Akt must occur at this stage or later. The DN3-4 transition is characterized by a burst of proliferation and survival stimuli, ensuring the subsequent differentiation of DN thymocytes to the CD4+CD8+ double-positive and single-positive stages (Figures S4A and S4B) (Ciofani and Zuniga-Pflucker, 2006). By analyzing the number of individual pretumor T cell precursor subsets, we specifically observed an increase in DN3-4 cells in the thymus of AKTT mice, which was completely restored to normal numbers in AKTT;4EBP1M and AKTT;L24+/− mice, but not in AKTT;rpS6P−/− mice (Figure 4A). In agreement with these findings, while AKTT tumors show an accumulation of cells at various stages of T cell maturation, the DN3-4 cells are the most abundant and the earliest DN cell type to contribute to thymic tumor cellularity (Figures 4B and 4C), and this profile is phenocopied in the subset of AKTT;4EBP1M mice that eventually develop tumors (Figure S3B).
Figure 4. Oncogenic PI3K-Akt-mTOR Signaling Leads to Enrichment of the DN3-4 Thymic Subpopulation, which Is Dependent on eIF4E Hyperactivity.

(A) Percentage of DN3-4 thymocytes (prior to tumor formation compared to total DN thymocytes) in the thymus, as assessed by flow cytometry (n > 5/ genotype) (*p < 0.003; **p < 0.002; and n.s., no statistical significance).
(B) Percentage of DN cell subsets in thymic tumors from AKTT mice (n = 5).
(C) Flow cytometry analysis of all thymocyte subpopulations in thymic tumors from AKTT mice (n = 5). Data are presented as the average ± SEM. See also Figure S4.
We next sought to further understand the cellular mechanism by which the DN3-4 cells accumulate in AKTT mice and whether this effect is dependent on the ability of Akt to augment protein synthesis. To this end, we analyzed programmed cell death, cell proliferation, and differentiation of DN3-4 cells in WT and AKTT mice prior to tumor formation. We observed normal T cell differentiation in AKTT mice in the OP9-DL1 culture system where DN2 cells from AKTT mice progress to the CD4+ and CD8+ single-positive stage (Figures S4A–S4C). Similarly, cell proliferation of DN3-4 cells as well as all other thymic subpopulations was not increased in AKTT cells (Figures S4D and S4E). These results are in agreement with previous findings, which demonstrate that Lck-Akt1 transgenic mice also do not display an in vivo increase in cell proliferation (Malstrom et al., 2001). On the contrary, proliferation of DN3-4 cells is decreased in AKTT cells compared to WT cells and may reflect a tumor-suppressive cellular response to an oncogenic insult (Figure S4D). In addition, despite the fact that AKTT;rpS6P−/− thymocytes show an even further increase in protein synthesis levels compared to AKTT alone, they do not exhibit any proliferative advantage (Figure S4E). There is a stochastic balance between cell death and proliferation during T lymphocyte development, and a background level of cell death is present in all thymocyte subpopulations (Ciofani and Zuniga-Pflucker, 2006; Mao et al., 2007). We next examined cell death in the AKTT lymphoid compartment and observed a specific and marked reduction in programmed cell death in DN3-4 cells that was completely restored to background levels in AKTT;4EBP1M and AKTT;L24+/− mice (Figure 5A). These findings are consistent with the observation that combined loss of Akt1 and Akt2 results in increased cell death of DN3-4 thymocytes (Juntilla et al., 2007). Altogether, these results illustrate the importance of Akt-mediated cell survival as a mechanism for lymphomagenesis at a stage of lymphocyte development that normally relies on Akt for their proper development.
Figure 5. eIF4E Hyperactivation Downstream of Oncogenic PI3K-Akt-mTOR Signaling Impairs Programmed Cell Death of Specific T Cell Precursors, at Least in Part, through Control of Translation of Mcl-1.

(A) Percentage of Annexin V+ DN3-4 cells prior to tumor formation (n > 3 mice/genotype) (*p < 0.001, **p < 0.02, and ***p < 0.003).
(B and C) Analysis of Mcl-1 protein expression levels in total thymocytes. (Right) Representative western blot. (Left) Densitometry analysis (*p = 0.005). All representative western blots were loaded, resolved, and transferred from the same gel.
(D) Percentage of increase of Mcl-1 expression in AKTT and AKTT;4EBP1M in the DN3-4 compartment compared to WT controls (n = 4/genotype) (*p = 0.01).
(E) Fold change of Annexin V+ in DN3-4 cells after knockdown of Mcl-1 (n > 3 mice/genotype) (*p < 0.01 and n.s., no statistical significance). Data are presented as the average ± SEM. See also Figure S5.
To understand the molecular mechanism by which DN3-4 cells from AKTT mice are more resistant to programmed cell death, we undertook a candidate gene approach to examine whether increases in cap-dependent protein translation might alter the posttranscriptional expression of specific antiapoptotic proteins. While we did not detect any changes in the protein expression levels of six important antiapoptotic factors (Figure S5A), we observed that Mcl-1 was specifically upregulated in AKTT cells compared to WT controls at the protein, but not the mRNA level (Figures 5B and Figure S5B). Moreover, Mcl-1 protein degradation is not affected in AKTT thymocytes (Figure S5C). Importantly, Mcl-1 has been shown to be a critical regulator of cell death in early thymocyte progenitors, including DN3-4 cells (Opferman et al., 2003). Mcl-1 has also been reported to be a translationally regulated gene, and its expression is affected by eIF4E phosphorylation in primary fibroblasts and tumors associated with loss of Tsc2 (tuberous sclerosis 2 protein) (Mills et al., 2008). We next tested whether increases in Mcl-1 protein levels downstream of oncogenic Akt signaling are the result of increases in protein synthesis and/or eIF4E hyperactivation. Mcl-1 protein expression is restored to normal levels specifically in AKTT;4EBP1M and AKTT;L24+/−, but not in AKTT;rpS6P−/− (Figures 5B and 5C and Figures S5D and S5E). Furthermore, Mcl-1 is specifically enriched in DN3-4 AKTT thymocytes, which show a cell survival advantage, and this effect is dependent on eIF4E hyperactivation (Figure 5D). Thus, the increase in Mcl-1 by eIF4E is specific to the 4EBP1 arm of oncogenic mTOR and does not rely on rpS6 phosphorylation.
We next asked whether Mcl-1 was functionally important for the increased cell survival observed in AKTT DN3-4 cells. We screened a panel of Mcl-1 shRNAs for a candidate which would reduce Mcl-1 levels by roughly 25% in AKTT thymocytes (Figures S5F and S5G). We observed a significant reversal of the antiapoptotic advantage of AKTT DN3-4 cells upon knockdown of Mcl-1 (Figure 5E). Thus, eIF4E-dependent control of Mcl-1 protein expression confers a cell survival advantage of specific thymocyte progenitors.
eIF4E Hyperactivation Is Important for AKTT-Mediated Tumor Maintenance
We next asked whether the maintenance of AKTT tumors relies on activation of the 4EBP-eIF4E axis. To this end, we induced the expression of the 4EBP1M transgene at 10 weeks of age in AKTT;4EBP1M mice, at which time lymphomas were already evident (Figures 6A and 6B). Subsequently, a cohort of AKTT and AKTT;4EBP1M mice were imaged by MRI to monitor tumor progression. Strikingly, by 14 weeks of age, AKTT mice showed a 5-fold increase in tumor growth, while induction of the 4EBP1M transgene led to a dramatic reduction in tumor size (Figures 6A and 6B). These findings demonstrate that eIF4E hyperactivation plays an important role in tumor maintenance and provide a strong rationale for targeting eIF4E hyperactivation pharmacologically downstream of oncogenic Akt.
Figure 6. eIF4E Hyperactivation Is Important for AKTT Tumor Maintenance.
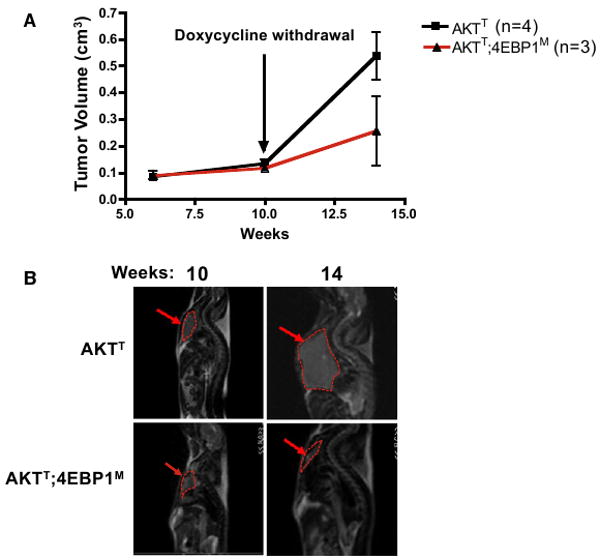
4EBP1M was induced in AKTT;4EBP1M mice at 10 weeks of age.
(A) Average tumor volumes (p < 0.03). Data are presented as the average ± SEM.
(B) AKTT and AKTT;4EBP1M mice that were imaged in a GE 3T MRI at 10 and 14 weeks. Images from the same AKTT and AKTT; 4EBP1M mouse at 10 and 14 weeks.
The Therapeutic Efficacy of an Active Site Inhibitor of mTOR that Efficiently Blocks 4EBP-eIF4E Hyperactivation
As maintenance of AKTT tumors relies on eIF4E hyperactivation, we next extended these genetic findings by conducting a randomized preclinical trial of an mTOR ATP active-site inhibitor (PP242) that efficiently targets 4EBP1 in an AKTT murine allograft model. Traditional allosteric mTOR inhibitors, such as rapamycin and associated rapalogs, have demonstrated limited clinical efficacy (Guertin and Sabatini, 2009). The lack of therapeutic efficacy of rapamycin correlates with only partial inhibition of mTORC1 (Choo et al., 2008). Our genetic findings, which demonstrate an essential role of 4EBP1 in cancer initiation and progression, may provide insight into the limited therapeutic efficiency of rapalogs. In particular, rapamycin leads to dephosphorylation of rpS6, but only minimally affects 4EBP1 phosphorylation. Importantly, a class of active site inhibitors of mTOR, including PP242 and Torin1, more efficiently block eIF4E hyperactivation and cap-dependent translation, although their therapeutic benefit has not been tested in vivo downstream of oncogenic Akt-mTOR activation (Feldman et al., 2009; Thoreen et al., 2009).
We tested PP242 therapeutic benefit in comparison to rapamycin in an AKTT murine allograft model. This allograft approach has a distinct advantage in monitoring for therapeutic response, as tumor growth following administration of therapeutic compounds can be directly visualized. Nude mice injected with pretumor AKTT thymocytes uniformly developed disseminated lymphoma in the lymph nodes, spleen, and liver within 20 days (Figure 7B and data not shown). Baseline measurements of pretreatment tumor areas were obtained on day 17 (prior to initiation of therapy). Mice were randomized into three groups (vehicle control, rapamycin, and PP242) and treatment was initiated 20 days after initial injection of AKTT pretumor cells (Figure 7A and see Experimental Procedures). After 20 days of treatment, all groups maintained body weight demonstrating drug tolerability and lack of noticeable toxicity (Figure 7D). Mice treated with rapamycin mirrored the vehicle-treated cohort with a 3-fold increase in tumor area by the end of the trial (Figures 7B and 7C). Strikingly, PP242-treated mice did not display any tumor growth after 20 days of treatment. In addition, the meta-static potential of the AKTT thymocytes was compromised because, unlike vehicle and rapamycin-treated mice, PP242-treated mice developed no new palpable lymphadenopathy (Figure 7B, insets) and displayed significantly less leukocytosis and splenomegaly (data not shown).
Figure 7. PP242, but Not Rapamycin, Has a Significant In Vivo Anti-Tumor Effect on AKTT Tumor Allografts.

(A) AKTT thymocytes were injected subcutaneously and allowed to form tumors for 20 days. 30 tumor-bearing mice were randomized into three groups of 10: vehicle, 5 mg/kg rapamycin, or 100 mg/kg PP242. Treatments were given 7 days a week for 20 days.
(B) Representative mice from each cohort after 20 days of therapy. Dotted yellow lines, primary tumor; dotted green lines, multiple sites of lymph node metastasis; green arrows (inset), areas of significant cervical lymphadenopathy.
(C) Tumor areas in square millimeters. Black line, vehicle; blue line, rapamycin; red line, PP242.
(D) Mouse weights in grams during the course of treatment. Data are presented as the average ± SEM.
We next assessed the basis for the increased therapeutic efficacy of PP242 compared to rapamycin. We observed a differential effect on downstream translational targets of mTORC1 in vivo (Figure 8A). Moreover, in agreement with in vitro evidence, the mTORC2 target Akt (S473) is also inhibited in vivo (Figure 8A and Discussion) (Feldman et al., 2009). Importantly, while rapamycin only inhibits phosphorylation of rpS6, PP242 also inhibits phosphorylation of 4EBP1 (Figure 8A) and was associated with a significant decrease in protein synthesis (Figure 8B). AKTT allograft tumors treated with PP242 display a strong cytotoxic effect, with a marked increase in apoptotic cell death compared to vehicle- and rapamycin-treated tumors (Figure 8C). Surprisingly, no effect was observed in cell proliferation (Figure 8D).
Figure 8. PP242 Shows a Better Therapeutic Effect Than Rapamycin In Vivo, at Least in Part, through Inhibition of the 4EBP-eIF4E Axis.

(A) Pharmacodynamic analysis of mTOR targets through western blot analysis. Each lane represents one post-treatment tumor 20 days after initiation of therapy.
(B) Protein synthesis levels in tumor thymocytes treated with DMSO, rapamycin (50 nM), and PP242 (2.5 μM) ex vivo for 2 hr measured by [35S]-methionine incorporation and TCA precipitation (n = 6/genotype) (*p = 0.001 and **p = 0.001).
(C) Fold decrease in cell survival compared to WT as determined by propidium iodide/Annexin exclusion (n = 10/cohort) (*p < 0.01 and **p < 0.05).
(D) Cell-cycle analysis of post-treatment tumor samples (n = 3/cohort).
(E) Fold change in live AKTT and AKTT;4EBP1M tumor cells after 24 hr treatment with PP242 (2.5 μM) ex vivo (n = 3) (*p < 0.001; n.s., no statistical significance). Data are presented as the average ± SEM.
We next sought to determine whether 4EBP1 is the relevant PP242 pharmacological target, downstream of mTOR, responsible for PP242-induced cell death of AKTT tumor cells. To this end, we took advantage of the subset of AKTT;4EBP1M that developed T cell lymphomas and treated either AKTT or AKTT; 4EBP1M tumor cells with PP242. Strikingly, AKTT;4EBP1M thymocytes were insensitive to PP242 and were resistant to apoptosis, while the majority of AKTT tumor cells undergo programmed cell death (Figure 8E). Altogether, our genetic and pharmacological results strongly suggest that the 4EBP-eIF4E axis is a major effector of oncogenic mTOR signaling. Moreover, 4EBP1 represents a clinically relevant target for mTOR ATP active site inhibitors that may display greater preclinical efficacy than rapamycin in the treatment of human cancers.
Discussion
Here, we genetically and pharmacologically demonstrate that the 4EBP-eIF4E axis downstream of oncogenic mTOR is a critical mediator of oncogenic Akt signaling and therapeutic response to mTOR ATP active site inhibitors. The fact that the majority of AKTT;L24+/− mice are lymphoma-free when protein synthesis and cell size is genetically restored to normal levels indicates that AKTT tumor cells may be addicted to increases in protein synthesis levels for cancer development. This is in agreement with further genetic dissection of the role of two of the most downstream translational regulators of oncogenic mTOR signaling toward Akt-mediated tumorigenesis. Our findings demonstrate a central role for 4EBP1 in the control of cap-dependent protein synthesis, cell growth, and cell survival downstream of oncogenic Akt signaling. Moreover, we identify a qualitative effect of 4EBP1 on the expression of a specific antiapoptotic protein, Mcl-1, that confers a survival advantage to pretumor Akt-overexpressing DN3-4 progenitor cells. These findings are in agreement with the fact that Mcl-1 is a critical regulator of cell death, specifically in early thymocyte progenitors (Opferman et al., 2003). Moreover, while phosphorylation of rpS6 is extensively used as a read-out of mTORC1 activity, we show here that it is dispensable for transformation downstream of oncogenic Akt signaling in the thymic compartment. Interestingly, despite the fact that AKTT;rpS6P−/− cells display an increase in protein synthesis compared to AKTT thymocytes, this does not translate into an increase in cell size, perhaps because AKTT cells have already reached a maximum size threshold. In addition, in AKTT;rpS6P−/− mice, there is no effect on Mcl-1 protein production compared to AKTT (Figure S5E) and consistently this does not translate into a further increase in cell survival and tumorigenesis (Figures 3B and 5A). Additionally, the phosphorylation of rpS6 may have tissue-specific effects, as it modifies the insulinoma phenotype associated with hyperactivation of Akt in the pancreas (Alliouachene et al., 2008).
The immunosuppressant drug rapamycin is an allosteric partial inhibitor of mTORC1 function that has shown limited therapeutic efficacy in human cancer clinical trials and a modest tissue-specific effect on 4EBP1 phosphorylation downstream of PI3K signaling (Choo et al., 2008; Guertin and Sabatini, 2009). On the contrary, a class of mTOR ATP active-site inhibitors, such as PP242, significantly inhibit 4EBP phosphorylation (Feldman et al., 2009; Thoreen et al., 2009). By conducting a randomized preclinical trial of PP242 in an AKTT murine allograft model, we were able to test the effect of PP242 in a very controlled and genetically relevant tumor cell type in vivo. Mirroring our genetic findings, we show that complete mTOR inhibition increases programmed cell death without significantly affecting cell proliferation. In addition, while rapamycin is able to decrease rpS6 phosphorylation, it is not an efficient inhibitor of 4EBP1 hyperphosphorylation and does not have a therapeutic benefit for the treatment of AKTT tumors (Figures 8A–8D). This is in agreement with our genetic findings showing that rpS6 is dispensable for tumor growth. Importantly, we demonstrate that the apoptotic effect of PP242 is dependent, to a large extent, on eIF4E hyperactivation as AKTT;4EBP1M tumor cells are insensitive to PP242-induced programmed cell death.
PP242 also inhibits mTORC2 kinase activity, thereby decreasing the phosphorylation of Akt (s473) through a positive feedback loop between mTORC2 and Akt. While PP242 inhibits the phosphorylation of Akt, this does not have an effect on the phosphorylation of direct Akt downstream targets, including TSC2, FOXO1/O3a, and GSK3a/b (Feldman et al., 2009). In addition, using Sin1−/− and Rictor−/− mouse embryonic fibroblasts, where the mTORC2 complex is unable to phosphorylate Akt, mTOR ATP active site inhibitors still maintain their full efficacy (Feldman et al., 2009; Thoreen et al., 2009). In combination with our genetic results, these findings support the central role of the 4EBP-eIF4E axis as a vital therapeutic target in Akt-mediated tumors and provide a mechanistic rationale for the therapeutic inefficacy of rapamycin in the treatment of many human cancers. By overcoming the limitations of partial mTOR inhibition with second-generation mTOR ATP active site inhibitors, previously unresponsive Akt-dependent tumors may now exhibit dramatic clinical responses.
Experimental Procedures
Mice and Allograft Model Preparation
TetO-FLAG-4EBP1M mice were generated using a 4EBP1 mutant construct in which all five rapamycin-sensitive 4EBP1 phosphorylation sites (T37, T46, S65, T70, and S82) were mutated to alanine (Mothe-Satney et al., 2000). A FLAG tag was engineered into the 5′ end of the 4EBP1M construct. FLAG-4EBP1M was isolated from its vector by restriction digestion and ligated into the tetO_SB vector (Leenders et al., 2000). The resulting TetO-FLAG-4EBP1M construct was linearized by restriction digestion and microinjected into mouse embryos, which were then implanted into female recipient mice. Founder lines were generated, genotyped, and crossed with WT mice to verify germline transmission. CMV-Cap-HCV-IRES transgenic mice were generated using a pCMV-Myc-RL-HCV-IRES-FL construct. The HCV IRES element (Yoon et al., 2006) was subcloned into pCR 2.1 (Invitrogen), digested with EcoRI, and inserted into a pRF plasmid. The RL-HCV IRES-FL was amplified, digested using BglII and KpnI, and inserted into the pCMV-Myc expression vector. The resulting pCMV-Myc-RL-HCV-IRES-FL was linearized using an Alw44I restriction enzyme and microinjected into mouse embryos, which were then implanted into female recipient mice. Founder lines were generated, genotyped, and crossed with WT mice to verify germline transmission. L24+/− mice were purchased from Jackson Laboratories. Transgenic Lck-Akt2 mice where kindly provided by J.R.T. The rpS6P−/− mice were previously described (Ruvinsky et al., 2005). The Lck-tTA mice were obtained from Taconic (Labrecque et al., 2001). All mice were maintained in the C57/BL6 background. Experiments were performed with 6 week old mice unless stated otherwise. The AKTT allograft model was generated using pretumor transgenic Lck-Akt2 thymocytes, which were dissociated in PBS supplemented with 3% fetal bovine serum (PBS-FBS) and filtered through a 40 μm nylon mesh (BD Biosciences). Thymocytes were then washed in PBS-FBS and pelleted at 300 × g for 5 minutes. 8–12 week old nude mice were injected with 2 × 10⁶ total AKTT thymocytes mixed in a 1:1 ratio of RPMI and matrigel. A volume of 200 ml of the cell milieu was injected per mouse in the right subscapular region subcutaneously. Tumors were allowed to form for 20 days. Length and width caliper measurements were taken every 2 to 3 days. All manipulations involving live mice were approved by the University of California San Francisco Animal Care and Use Committee.
Pharmacological Treatment of AKTT Murine Allograft Model
Thirty allograft mice were generated. All mice developed tumors and were randomized on day 21 to receive vehicle, rapamycin (Wyeth) (5 mg/kg), or PP242 (100 mg/kg) by gavage 7 days per week. PP242 was resuspended in 5% N-Methylpyrrolidone, 15% Polyvinylpyrrolidone, and 80% water. PP242 was administered at 100 mg/kg, based on previous pharmacodynamic studies and Feldman et al. (2009), in nude mice demonstrating effective inhibition of phospho-4EBP1 and phospho-Akt. Cell-cycle analysis in tumor samples was performed by propidium iodide staining as described below.
Analysis of Global Protein Synthesis
Total thymocytes (2 × 10⁶) were methionine starved for 45 min by incubation in 1 ml methionine-free RPMI medium, containing 10% dialyzed FBS. Following starvation, 20 μCi of S35-labeled methionine was added to each sample and the incubation continued for 1 hr. Cells were lysed and 35S-labeled proteins were precipitated using 10% trichloroacetic acid (TCA), dried, and measured in a scintillation counter (Beckman Coulter). Each sample was measured in triplicate. The S35 experiments were controlled by using the same number of cells for each set of experiments. Final comparisons were made between each genotype (AKTT, AKTT;4EBP1M, rpS6P−/−, AKTT; rpS6P−/−, L24+/−, AKTT;L24+/−) compared to the WT control.
Cap-Binding Assay
Total thymocytes were lysed in buffer A [10 mM Tris-HCL (pH 7.6), 140 mM KCl, 4 mM MgCl2, 1 mM DTT, 1 mM EDTA, and protease inhibitors, supplemented with 1% NP-40] and cell lysates (500 μg protein in 500 μl) were incubated overnight at 4°C with 50 μl of the mRNA cap analog m7GTP-sepharose (GE Healthcare) in buffer A, under constant and gentle agitation. The protein complex sepharose beads were washed with buffer A supplemented with 0.5% NP-40 and the eIF4E-associated complex was resolved by SDS-PAGE and western blotting. The following antibodies were used following the manufacturers' instructions: rabbit anti-eIF4G (Cell Signaling), mouse anti-eIF4E (BD Biosciences), and rabbit anti-4EBP1 (Cell Signaling).
Analysis of DN3-4 In Vivo Apoptosis and Characterization of Thymic Tumors
To characterize the percentage of DN3-4 cells, as well as in vivo apoptosis, equal numbers of freshly isolated thymocytes were labeled with APC-Cy7-conjugated anti-CD4 (BD Biosciences), pacific blue-conjugated anti-CD8 (Caltag), and PE-conjugated anti-TCRβ antibodies (BD Biosciences) in PBS-FBS (all antibodies diluted 1:100 v/v). Apoptotic cells were labeled with Annexin V-FITC (BD Biosciences), following the manufacturer's instructions. Negative controls were set up for each sample by omission of Annexin V incubation. Samples (106 cells) were acquired on a BD LSRII flow cytometer. Analysis and quantification were done using the FlowJo software (version 8.7.1). To characterize thymocyte subpopulations in tumors, cells were labeled with APC-Cy7-conjugated anti-CD4 (BD Biosciences), pacific blue-conjugated anti-CD8 (Caltag), FITC-conjugated anti-CD25 (BD Biosciences), APC-conjugated anti-CD44 (BD Biosciences), and PE-conjugated anti-TCRβ antibodies (BD Biosciences). Cells (106) were analyzed as described above.
Cell Sorting and In Vitro Differentiation of Thymocytes
Freshly isolated thymocytes were labeled with biotin-conjugated anti-CD4 and anti-CD8 (BD Biosciences) for 30 min at 4°C, followed by labeling with anti-biotin magnetic beads (Myltenyi Biotec) for 20 min at 4°C. CD4−CD8− DN thymocytes were then isolated using AutoMACS (Myltenyi Biotec), following the manufacturer's instructions. DN cells were then labeled with APC-conjugated anti-CD44 and PE-conjugated anti-CD25 antibodies (BD Biosciences) and CD44+CD25+ (DN2) thymocytes were isolated using a Becton Dickinson FACS DiVa Flow Cytometer & Cell Sorter. DN2 cells were cocultured on OP9-DL1-GFP cells (Schmitt and Zuniga-Pflucker, 2002) for 1 week. Thymocyte subpopulations were then analyzed by flow cytometry as described above, but including incubation of thymocytes with a biotinylated anti-CD45 antibody, followed by Qdot605-conjugated streptavidin. The analysis of thymocyte subsets was done in CD45+GFP− gated cells.
In Vivo Quantification of Cell Proliferation
Mice underwent two intraperitoneal injections (4 hr apart) with 1 mg of BrdU (BD Biosciences) each and thymocytes were collected 12 hr after the second injection. Cells were labeled with APC-Cy7-conjugated anti-CD4 (BD Biosciences), pacific blue-conjugated anti-CD8 (Caltag), and PE-conjugated anti-TCRβ antibodies (BD Biosciences) in PBS-FBS (all antibodies diluted 1:100 v/v). Stained cells were washed, fixed, and processed for flow cytometry using the FITC BrdU Flow kit (BD Biosciences), following the manufacturer's instructions. Cells (106) were analyzed on a BD LSRII flow cytometer and the percentage of BrdU-positive cells was determined using the FlowJo software (version 8.7.1). Negative controls were performed with mice that did not receive BrdU.
Thymocyte Mcl-1 shRNA Knockdown
Single cell suspension generated from either WT or AKTT thymocytes were transfected by electroporation (Amaxa) with an Mcl-1 shRNA (TTTCAAAGATGGCGTAACATTCAAGAGATGTTACGCCATCTTTGAAA) or a scramble shRNA, which was cloned into the RNAi-Ready pSIREN-RetroQ-ZsGreen construct (Clontech). Apoptosis analysis of the DN3-4 subpopulation was acquired by flow cytometry, as described above, 12 hr after transfection. To assess the extent of knockdown, Mcl-1 protein levels were measured in parallel experiments by flow cytometry. To this end, thymocytes were labeled with fluorescent antibodies against CD4, CD8, and TCRß chain (as described above) and fixed with cytofix/cytoperm buffer (BD Biosciences) for 15 min at 4°C. Cells were permeabilized for 20 min and nonspecific binding was blocked by adding normal goat serum (1:20 v/v). Cells were then incubated with a monoclonal rabbit anti-Mcl-1 antibody (Abcam) (1:100 v/v) for 20 min. Cells were incubated with an APC-conjugated goat anti-rabbit antibody (Molecular Probes) (1:200 v/v) for 20 min, washed, and finally resuspended in PBS for analysis on a BD LSRII flow cytometer. Negative controls were generated by omission of the primary antibody and by omission of both primary and secondary antibodies, to account for background signal. Analysis was performed as described above, but with additional gating in GFP+ cells. Mean fluorescence intensity levels corresponding to Mcl-1 expression were generated using the FlowJo software.
Mcl-1 Protein Degradation Assay
WT and AKTT thymocytes were isolated as described above. 5 × 10⁶ cells were resuspended in media and treated with 50 μg/ml of cyclohexamide. Cells were isolated at the indicated time points. Protein lysates were made and resolved by SDS-PAGE followed by transfer onto PVDF as describe above. Densitometry analysis of each western was acquired using the Bio-Rad Molecular Imager Gel Doc XR with Quantity One v.4.6.7 software. Each lane was first normalized to β-actin and then normalized to the no cycloheximide treatment control.
Bicistronic Cap/IRES Luciferase Assay
WT and AKTT thymocytes were isolated as described above. Thymocytes were transfected with the p53 IRES bicistronic vector by electroporation (Amaxa). Cells were collected 24 hr after transfection and Firefly/Renilla activities were quantified using the Optocomp 1 luminometer (MGM Instruments). Bicistronic mRNA levels were normalized by quantitative PCR using Rluc 5′-AACGCGGCCTCTTCTTATTT-3′; 5′-ATTTGCCTGATTTGCCCATA-3′; and Fluc 5′-GAGGTTCCATCTGCAGGTA-3′; 5′-CCGGTATCCAGATCCACAAC-3′ primers. For in vivo analysis of Cap/IRES-induced luciferase activity, thymocytes were isolated from HCV-IRES and AKTT;HCV-IRES mice and luciferase activity was directly quantified as described above.
Statistical Analysis
All data presented as histograms refer to a mean value ± SEM of the total number of animals analyzed across independent experiments. An unpaired, two-tailed t test was used to determine p values for Figures 1 and 2 and 4 and 5 and ANOVA with Bonferroni's or Tukey's post-test was used for Figures 6–8. Statistical analysis of lymphoma-free survival and respective p values were determined using the Logrank test (Figure 3).
Supplementary Material
Acknowledgments
We are indebted to M. Barna for support, critical discussion, and reading of the manuscript; Y. Liu and C. Rommel from Intellikine, Inc. for providing reagents and technical expertise; B. Hann and the University of California San Francisco (UCSF) Preclinical Therapeutics Core for technical assistance; O. Krasnykh for technical assistance; and O.F. Siegel and J.M. Shen for editing the manuscript. We thank J. Kurhanewicz and R. Bok of the Margaret Hart Surbeck Institute for Advanced imaging for technical support and MRI images. This work was supported by the V Foundation for Cancer Research (D.R.), National Cancer Institute grant CA77429 (J.R.T.), National Institutes of Health T32 training grant (A.C.H.), UCSF Prostate Cancer SPORE Career Development Program (M.C.), and the American Italian Cancer Foundation (O.Z.). D.R. is a Leukemia and Lymphoma Society Scholar. A.C.H., M.E.F., K.M.S., and D.R. are inventors of patent applications related to PP242 owned by UCSF and licensed to Intellikine, Inc. K.M.S. is a cofounder and a member of its scientific advisory board.
Footnotes
Supplemental Information: Supplemental Information includes five figures and Supplemental Experimental Procedures and can be found with this article online at doi:10.1016/j.ccr.2010.01.021.
References
- Alliouachene S, Tuttle RL, Boumard S, Lapointe T, Berissi S, Germain S, Jaubert F, Tosh D, Birnbaum MJ, Pende M. Constitutively active Akt1 expression in mouse pancreas requires S6 kinase 1 for insulinoma formation. J Clin Invest. 2008;118:3629–3638. doi: 10.1172/JCI35237. [DOI] [PMC free article] [PubMed] [Google Scholar]
- Avdulov S, Li S, Michalek V, Burrichter D, Peterson M, Perlman DM, Manivel JC, Sonenberg N, Yee D, Bitterman PB, Polunovsky VA. Activation of translation complex eIF4F is essential for the genesis and maintenance of the malignant phenotype in human mammary epithelial cells. Cancer Cell. 2004;5:553–563. doi: 10.1016/j.ccr.2004.05.024. [DOI] [PubMed] [Google Scholar]
- Barna M, Pusic A, Zollo O, Costa M, Kondrashov N, Rego E, Rao PH, Ruggero D. Suppression of Myc oncogenic activity by ribosomal protein haploinsufficiency. Nature. 2008;456:971–975. doi: 10.1038/nature07449. [DOI] [PMC free article] [PubMed] [Google Scholar]
- Brunn GJ, Hudson CC, Sekulic A, Williams JM, Hosoi H, Houghton PJ, Lawrence JC, Jr, Abraham RT. Phosphorylation of the translational repressor PHAS-I by the mammalian target of rapamycin. Science. 1997;277:99–101. doi: 10.1126/science.277.5322.99. [DOI] [PubMed] [Google Scholar]
- Buckland J, Pennington DJ, Bruno L, Owen MJ. Co-ordination of the expression of the protein tyrosine kinase p56(lck) with the pre-T cell receptor during thymocyte development. Eur J Immunol. 2000;30:8–18. doi: 10.1002/1521-4141(200001)30:1<8::AID-IMMU8>3.0.CO;2-8. [DOI] [PubMed] [Google Scholar]
- Cantley LC. The phosphoinositide 3-kinase pathway. Science. 2002;296:1655–1657. doi: 10.1126/science.296.5573.1655. [DOI] [PubMed] [Google Scholar]
- Choo AY, Yoon SO, Kim SG, Roux PP, Blenis J. Rapamycin differentially inhibits S6Ks and 4E-BP1 to mediate cell-type-specific repression of mRNA translation. Proc Natl Acad Sci USA. 2008;105:17414–17419. doi: 10.1073/pnas.0809136105. [DOI] [PMC free article] [PubMed] [Google Scholar]
- Ciofani M, Zuniga-Pflucker JC. A survival guide to early T cell development. Immunol Res. 2006;34:117–132. doi: 10.1385/IR:34:2:117. [DOI] [PubMed] [Google Scholar]
- Feldman ME, Apsel B, Uotila A, Loewith R, Knight ZA, Ruggero D, Shokat KM. Active-site inhibitors of mTOR target rapamycin-resistant outputs of mTORC1 and mTORC2. PLoS Biol. 2009;7:e38. doi: 10.1371/journal.pbio.1000038. [DOI] [PMC free article] [PubMed] [Google Scholar]
- Gingras AC, Kennedy SG, O'Leary MA, Sonenberg N, Hay N. 4E-BP1, a repressor of mRNA translation, is phosphorylated and inactivated by the Akt(PKB) signaling pathway. Genes Dev. 1998;12:502–513. doi: 10.1101/gad.12.4.502. [DOI] [PMC free article] [PubMed] [Google Scholar]
- Gingras AC, Gygi SP, Raught B, Polakiewicz RD, Abraham RT, Hoekstra MF, Aebersold R, Sonenberg N. Regulation of 4E-BP1 phosphorylation: a novel two-step mechanism. Genes Dev. 1999a;13:1422–1437. doi: 10.1101/gad.13.11.1422. [DOI] [PMC free article] [PubMed] [Google Scholar]
- Gingras AC, Raught B, Sonenberg N. eIF4 initiation factors: effectors of mRNA recruitment to ribosomes and regulators of translation. Annu Rev Biochem. 1999b;68:913–963. doi: 10.1146/annurev.biochem.68.1.913. [DOI] [PubMed] [Google Scholar]
- Gingras AC, Raught B, Sonenberg N. Regulation of translation initiation by FRAP/mTOR. Genes Dev. 2001;15:807–826. doi: 10.1101/gad.887201. [DOI] [PubMed] [Google Scholar]
- Guertin DA, Sabatini DM. Defining the role of mTOR in cancer. Cancer Cell. 2007;12:9–22. doi: 10.1016/j.ccr.2007.05.008. [DOI] [PubMed] [Google Scholar]
- Guertin DA, Sabatini DM. The pharmacology of mTOR inhibition. Sci Signal. 2009;2:pe24. doi: 10.1126/scisignal.267pe24. [DOI] [PubMed] [Google Scholar]
- Haghighat A, Sonenberg N. eIF4G dramatically enhances the binding of eIF4E to the mRNA 5′-cap structure. J Biol Chem. 1997;272:21677–21680. doi: 10.1074/jbc.272.35.21677. [DOI] [PubMed] [Google Scholar]
- Hay N, Sonenberg N. Upstream and downstream of mTOR. Genes Dev. 2004;18:1926–1945. doi: 10.1101/gad.1212704. [DOI] [PubMed] [Google Scholar]
- Juntilla MM, Wofford JA, Birnbaum MJ, Rathmell JC, Koretzky GA. Akt1 and Akt2 are required for alphabeta thymocyte survival and differentiation. Proc Natl Acad Sci USA. 2007;104:12105–12110. doi: 10.1073/pnas.0705285104. [DOI] [PMC free article] [PubMed] [Google Scholar]
- Kim DH, Sarbassov DD, Ali SM, King JE, Latek RR, Erdjument-Bromage H, Tempst P, Sabatini DM. mTOR interacts with raptor to form a nutrient-sensitive complex that signals to the cell growth machinery. Cell. 2002;110:163–175. doi: 10.1016/s0092-8674(02)00808-5. [DOI] [PubMed] [Google Scholar]
- Kozma SC, Ferrari S, Bassand P, Siegmann M, Totty N, Thomas G. Cloning of the mitogen-activated S6 kinase from rat liver reveals an enzyme of the second messenger subfamily. Proc Natl Acad Sci USA. 1990;87:7365–7369. doi: 10.1073/pnas.87.19.7365. [DOI] [PMC free article] [PubMed] [Google Scholar]
- Labrecque N, Whitfield LS, Obst R, Waltzinger C, Benoist C, Mathis D. How much TCR does a T cell need? Immunity. 2001;15:71–82. doi: 10.1016/s1074-7613(01)00170-4. [DOI] [PubMed] [Google Scholar]
- Lambertsson A. The minute genes in Drosophila and their molecular functions. Adv Genet. 1998;38:69–134. doi: 10.1016/s0065-2660(08)60142-x. [DOI] [PubMed] [Google Scholar]
- Leenders H, Whiffield S, Benoist C, Mathis D. Role of the forkhead transcription family member, FKHR, in thymocyte differentiation. Eur J Immunol. 2000;30:2980–2990. doi: 10.1002/1521-4141(200010)30:10<2980::AID-IMMU2980>3.0.CO;2-9. [DOI] [PubMed] [Google Scholar]
- Malstrom S, Tili E, Kappes D, Ceci JD, Tsichlis PN. Tumor induction by an Lck-MyrAkt transgene is delayed by mechanisms controlling the size of the thymus. Proc Natl Acad Sci USA. 2001;98:14967–14972. doi: 10.1073/pnas.231467698. [DOI] [PMC free article] [PubMed] [Google Scholar]
- Mao C, Tili EG, Dose M, Haks MC, Bear SE, Maroulakou I, Horie K, Gaitanaris GA, Fidanza V, Ludwig T, et al. Unequal contribution of Akt isoforms in the double-negative to double-positive thymocyte transition. J Immunol. 2007;178:5443–5453. doi: 10.4049/jimmunol.178.9.5443. [DOI] [PubMed] [Google Scholar]
- Mende I, Malstrom S, Tsichlis PN, Vogt PK, Aoki M. Oncogenic transformation induced by membrane-targeted Akt2 and Akt3. Oncogene. 2001;20:4419–4423. doi: 10.1038/sj.onc.1204486. [DOI] [PubMed] [Google Scholar]
- Mills JR, Hippo Y, Robert F, Chen SM, Malina A, Lin CJ, Trojahn U, Wendel HG, Charest A, Bronson RT, et al. mTORC1 promotes survival through translational control of Mcl-1. Proc Natl Acad Sci USA. 2008;105:10853–10858. doi: 10.1073/pnas.0804821105. [DOI] [PMC free article] [PubMed] [Google Scholar]
- Mothe-Satney I, Yang D, Fadden P, Haystead TA, Lawrence JC., Jr Multiple mechanisms control phosphorylation of PHAS-I in five (S/T)P sites that govern translational repression. Mol Cell Biol. 2000;20:3558–3567. doi: 10.1128/mcb.20.10.3558-3567.2000. [DOI] [PMC free article] [PubMed] [Google Scholar]
- Oliver ER, Saunders TL, Tarle SA, Glaser T. Ribosomal protein L24 defect in belly spot and tail (Bst), a mouse Minute. Development. 2004;131:3907–3920. doi: 10.1242/dev.01268. [DOI] [PMC free article] [PubMed] [Google Scholar]
- Opferman JT, Letai A, Beard C, Sorcinelli MD, Ong CC, Korsmeyer SJ. Development and maintenance of B and T lymphocytes requires antiapoptotic MCL-1. Nature. 2003;426:671–676. doi: 10.1038/nature02067. [DOI] [PubMed] [Google Scholar]
- Rajasekhar VK, Viale A, Socci ND, Wiedmann M, Hu X, Holland EC. Oncogenic Ras and Akt signaling contribute to glioblastoma formation by differential recruitment of existing mRNAs to polysomes. Mol Cell. 2003;12:889–901. doi: 10.1016/s1097-2765(03)00395-2. [DOI] [PubMed] [Google Scholar]
- Ruggero D, Sonenberg N. The Akt of translational control. Oncogene. 2005;24:7426–7434. doi: 10.1038/sj.onc.1209098. [DOI] [PubMed] [Google Scholar]
- Ruggero D, Montanaro L, Ma L, Xu W, Londei P, Cordon-Cardo C, Pandolfi PP. The translation factor eIF-4E promotes tumor formation and cooperates with c-Myc in lymphomagenesis. Nat Med. 2004;10:484–486. doi: 10.1038/nm1042. [DOI] [PubMed] [Google Scholar]
- Ruvinsky I, Meyuhas O. Ribosomal protein S6 phosphorylation: from protein synthesis to cell size. Trends Biochem Sci. 2006;31:342–348. doi: 10.1016/j.tibs.2006.04.003. [DOI] [PubMed] [Google Scholar]
- Ruvinsky I, Sharon N, Lerer T, Cohen H, Stolovich-Rain M, Nir T, Dor Y, Zisman P, Meyuhas O. Ribosomal protein S6 phosphorylation is a determinant of cell size and glucose homeostasis. Genes Dev. 2005;19:2199–2211. doi: 10.1101/gad.351605. [DOI] [PMC free article] [PubMed] [Google Scholar]
- Schmitt TM, Zuniga-Pflucker JC. Induction of T cell development from hematopoietic progenitor cells by delta-like-1 in vitro. Immunity. 2002;17:749–756. doi: 10.1016/s1074-7613(02)00474-0. [DOI] [PubMed] [Google Scholar]
- Schultz J. The minute reaction in the development of Drosophila melanogaster. Genetics. 1929;14:366–419. doi: 10.1093/genetics/14.4.366. [DOI] [PMC free article] [PubMed] [Google Scholar]
- Shortman K, Wu L. Early T lymphocyte progenitors. Annu Rev Immunol. 1996;14:29–47. doi: 10.1146/annurev.immunol.14.1.29. [DOI] [PubMed] [Google Scholar]
- Skeen JE, Bhaskar PT, Chen CC, Chen WS, Peng XD, Nogueira V, Hahn-Windgassen A, Kiyokawa H, Hay N. Akt deficiency impairs normal cell proliferation and suppresses oncogenesis in a p53-independent and mTORC1-dependent manner. Cancer Cell. 2006;10:269–280. doi: 10.1016/j.ccr.2006.08.022. [DOI] [PubMed] [Google Scholar]
- Staal SP. Molecular cloning of the akt oncogene and its human homologues AKT1 and AKT2: amplification of AKT1 in a primary human gastric adenocarcinoma. Proc Natl Acad Sci USA. 1987;84:5034–5037. doi: 10.1073/pnas.84.14.5034. [DOI] [PMC free article] [PubMed] [Google Scholar]
- Stolovich M, Tang H, Hornstein E, Levy G, Cohen R, Bae SS, Birnbaum MJ, Meyuhas O. Transduction of growth or mitogenic signals into translational activation of TOP mRNAs is fully reliant on the phosphatidylinositol 3-kinase-mediated pathway but requires neither S6K1 nor rpS6 phosphorylation. Mol Cell Biol. 2002;22:8101–8113. doi: 10.1128/MCB.22.23.8101-8113.2002. [DOI] [PMC free article] [PubMed] [Google Scholar]
- Tan Y, Timakhov RA, Rao M, Altomare DA, Xu J, Liu Z, Gao Q, Jhanwar SC, Di Cristofano A, Wiest DL, et al. A novel recurrent chromosomal inversion implicates the homeobox gene Dlx5 in T-cell lymphomas from Lck-Akt2 transgenic mice. Cancer Res. 2008;68:1296–1302. doi: 10.1158/0008-5472.CAN-07-3218. [DOI] [PubMed] [Google Scholar]
- Tang H, Hornstein E, Stolovich M, Levy G, Livingstone M, Templeton D, Avruch J, Meyuhas O. Amino acid-induced translation of TOP mRNAs is fully dependent on phosphatidylinositol 3-kinase-mediated signaling, is partially inhibited by rapamycin, and is independent of S6K1 and rpS6 phosphorylation. Mol Cell Biol. 2001;21:8671–8683. doi: 10.1128/MCB.21.24.8671-8683.2001. [DOI] [PMC free article] [PubMed] [Google Scholar]
- Thoreen CC, Kang SA, Chang JW, Liu Q, Zhang J, Gao Y, Reichling LJ, Sim T, Sabatini DM, Gray NS. An ATP-competitive mammalian target of rapamycin inhibitor reveals rapamycin-insensitive functions of mTORC1. J Biol Chem. 2009;284:8023–8032. doi: 10.1074/jbc.M900301200. [DOI] [PMC free article] [PubMed] [Google Scholar]
- von Manteuffel SR, Dennis PB, Pullen N, Gingras AC, Sonenberg N, Thomas G. The insulin-induced signalling pathway leading to S6 and initiation factor 4E binding protein 1 phosphorylation bifurcates at a rapamycin-sensitive point immediately upstream of p70s6k. Mol Cell Biol. 1997;17:5426–5436. doi: 10.1128/mcb.17.9.5426. [DOI] [PMC free article] [PubMed] [Google Scholar]
- Wendel HG, De Stanchina E, Fridman JS, Malina A, Ray S, Kogan S, Cordon-Cardo C, Pelletier J, Lowe SW. Survival signalling by Akt and eIF4E in oncogenesis and cancer therapy. Nature. 2004;428:332–337. doi: 10.1038/nature02369. [DOI] [PubMed] [Google Scholar]
- Yoon A, Peng G, Brandenburg Y, Zollo O, Xu W, Rego E, Ruggero D. Impaired control of IRES-mediated translation in X-linked dyskeratosis congenita. Science. 2006;312:902–906. doi: 10.1126/science.1123835. [DOI] [PubMed] [Google Scholar]
- Yuan TL, Cantley LC. PI3K pathway alterations in cancer: variations on a theme. Oncogene. 2008;27:5497–5510. doi: 10.1038/onc.2008.245. [DOI] [PMC free article] [PubMed] [Google Scholar]
- Zuniga-Pflucker JC. T-cell development made simple. Nat Rev Immunol. 2004;4:67–72. doi: 10.1038/nri1257. [DOI] [PubMed] [Google Scholar]
Associated Data
This section collects any data citations, data availability statements, or supplementary materials included in this article.