

Abstract
The CN vibrations of two aromatic nitriles, cinnamonitrile, PhCH=CH-CN and benzonitrile, PhCN, representative of components of common enzyme inhibitors, are examined by two dimensional infrared spectroscopy. In methanol, these spectra display cross peaks between the two CN components whose evolution exposes the few picosecond (4.5 ps for CIN and 5.3 ps for BN) equilibrium dynamics of hydrogen bond making and breaking. The main features of the 2D IR spectra are reproduced by simulations only with exchange incorporated. The lowest free energy state is the non-hydrogen bonded form. Both alkyl and aryl nitriles have now shown this picosecond exchange process.
1. Introduction
The vibrational spectra of nitriles have been useful as probes of the local structures [1–5], electric fields [6–9], and solvent dynamics [10–12]. These localized –C ≡ N transitions are sharp enough that small changes in frequency can be readily quantified. Furthermore, nitriles are readily introduced into proteins [7,8,13] and peptides [3,4,14] where they have transitions that are considerably removed from the peptide backbone infrared absorption. The physical origins of the nitrile peak shifts and line shapes have been examined theoretically [15–18]. For protein studies, the ability to connect the spectral shapes and frequencies of vibrational probes to specific structural and dynamical features remains an important challenge. The 2D IR experiments can help to clarify these processes and advance the applicability of nitriles as probes.
Nitrile groups are also integral components of numerous non-nucleoside anti-AIDS drugs which bind to reverse transcriptase (RT) inhibitors that have been discovered and structurally characterized by Arnold and coworkers [19,20]. Two dimensional infrared (2D IR) spectroscopy has been used to track frequency fluctuations and polarity differences of the drug binding sites [12]. One of the enzyme inhibitors has two aromatic arms, one consisting of a benzonitrile and the other a cinnamonitrile. The inhibitors of HIV-1 RT bind in a hydrophobic pocket between two β-sheets [21] and the motions of the drug and the nearby residues in the pocket have significant biological interest. The FTIR and 2D IR of the CN vibrations exhibit spectral diffusion in response to these polarity fluctuations in the pockets. In the present work the 2D IR of models representing the two arms of these drugs is reported along with the kinetics of their hydrogen bond making and breaking from 2D IR exchange studies.
The two dimensional infrared spectroscopy (2D IR) is ideally suited to investigate the frequency fluctuations, dynamic exchange processes and vibrational frequency autocorrelation functions. The influence of water hydrogen bond dynamics on solute vibrational modes and structure have been examined previously by nonlinear IR spectroscopy and correlated to the frequency fluctuations of solute vibrational modes for many systems [10,11,22–27]. 2D IR echo spectroscopy has been employed to measure the hydrogen-bond making and breaking for the system acetonitrile in methanol [10,11] by monitoring the exchange kinetics of such echo signals. Hamm and coworkers have used 2D IR pump/probe methods [28] to follow the delay time dependence of the H-bond kinetics of an amide mode in methanol which has also been examined by molecular dynamics simulations [23,29]. Other types of systems undergoing exchange have been reported using 2D IR echo spectroscopy involving molecules undergoing complexation, reversible isomerization or fluctionality [30–32], and there have been considerable advances in the theory of spectral diffusion of molecules and ions in water [29,33,34]. Another advantage of 2D IR is that it can identify the origins of features in linear IR spectra. Many reports can be found regarding the asymmetry or shoulders of unknown origin in the vibrational lineshapes of nitriles. Such spectral features have sometimes been attributed to anharmonic coupling [35] but linear IR spectra of molecules in condensed phases are unable to provide definitive proof of this conclusion. The distinction between exchange and anharmonic coupling is clear in 2D IR spectra because the latter introduces cross peaks that are present independently of the exchange kinetics.
Vibrational chemical exchange becomes observable in 2D IR when the vibrational frequencies of two or more chemical species at equilibrium have spectrally distinct transitions. The nonlinear and linear spectra depend critically on the relative values of the exchange rate constant, and the difference in frequency between the two exchanging states. In slow exchange two transitions appear at different frequencies, while very fast exchange results in a single time-averaged peak at the weighted average of the frequencies. 2D IR techniques have been shown to be successful in establishing exchange processes on the picosecond timescale that have not been accessible by other methods [10,11,30–32].
In the present work, the H-bond exchange dynamics of the CN stretching mode is reported for two aromatic nitriles in methanol where two vibrational transitions are observed when only one nitrile vibration, the CN stretch, is predicted from computations and simple force fields of the isolated molecule. Eaton and coworkers [1] had suggested that the lower frequency component corresponds to a nitrile environment of self-associated methanol. The higher frequency band coincides with the peak of nitrile in water and has been attributed to a hydrogen bonded form in methanol. Some of the inferences from FTIR experiments can be directly verified by means of nonlinear 2D IR experiments and the equilibrium kinetics can be accessed as has been shown previously for acetonitrile [10]. An important question is how the equilibrium dynamics depends on the molecular structure of the nitrile, and how general is this display of H-bond dynamics in the vibrational spectrum.
2. Experimental section
Benzonitrile (BN), Ph-CN (>99%), and cinnamonitrile (CIN), Ph-CH=CH-CN (97%), were purchased from Aldrich and used without further purification. The linear IR spectra were recorded using a Nicolet 6700 spectrometer.
The 2D IR spectra were obtained by exciting the sample with three pulses having energy of ca. 400 nJ and pulsewidths of ca. 100 fs. The time interval between the first two pulses (τ) is the coherence time that between the second and third the waiting or population time, T, and t is the detection interval. The local oscillator was used to heterodyne the signal in a phase matched direction, −k1+k2+k3. Rephasing and nonrephasing data were obtained from coherence time scans with k1 arriving earlier and later than k2, respectively. The transient grating data was obtained by fixing the coherence time at zero and scanning k3 and the local oscillator by equal amounts. All of the 2D IR spectra were obtained by sampling the coherence time from −6 ps to 6 ps in steps of 2 fs. After appropriate Fourier transforms along the coherence and detection axes they are plotted as ωτ vs.ωt for fixed T in a standard manner [36]. The three excitation and detected fields were chosen to have parallel polarization in the experiments.
3. Results
Linear IR spectroscopy of nitriles
Figure 1 shows the FTIR spectra in various solvents. The peak extinction coefficient is 193±30 M−1cm−1 for benzonitrile and 315±30 M−1cm−1 for cinnamonitrile in THF. The vibrational bandwidths vary from 7–10 cm−1. These spectra clearly show the obvious asymmetry of the transition in methanol compared to that in other solvents, although the bands have some slight asymmetry in all media. The methanol spectra consist of a peak close to that found in acetone or THF that we will refer to as the F-peak and a region, H, at about 6 cm−1 to higher frequency close to the band in water. The integrated areas of these regions are designated Fint and Hint. The F and H states will be shown from the 2D IR to be in dynamic equilibrium but the equilibrium number densities are not simply given by the areas under the FTIR components. Nevertheless the ratio of these areas constrains the equilibrium constants. The Hint/Fint ratio is 1.0±0.1 for CIN, such that setting the integrated absorption to be proportional to a transition dipole squared yields the equilibrium constant Keq as . The analysis is more complex for BN since the FTIR does not fit to two underlying states. The estimate based on Lorentz profiles of one F and two H states is Hint/Fint = 0.87±0.3. It will be seen later that fitting FTIR to the 2D IR derived line shape functions predicts a different value for this ratio.
Figure 1.
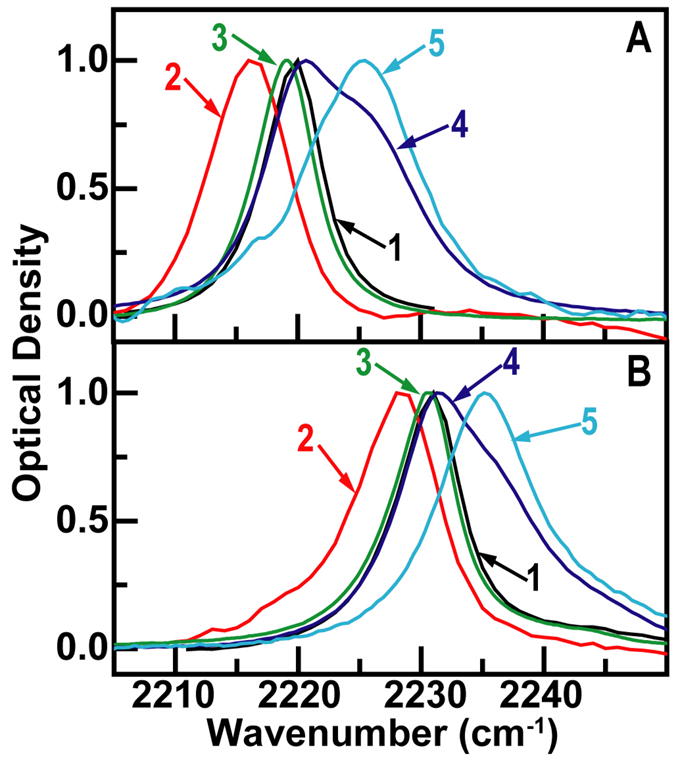
FTIR spectra of (a) cinnamonitrile and (b) benzonitrile scaled to be unity at the peaks. The solvents are acetone (1), DMSO (2), THF (3), methanol (4) and water (5).
We also report values for the squared transitions dipoles of BN and CIN in THF of 0.007±0.002 D2 and 0.010±0.002 D2 respectively. The transition dipole of BN in water of 0.013±0.003 D2 is substantially larger than in THF, in agreement with previous reports [37]. The solubility of CIN in water is too low for an accurate measurement. The integrated absorptions in methanol which clearly have overlapping peaks in both examples, gives population weighted averages of the squared transition dipoles of the underlying H and F components of 0.010±0.002 D2 (BN) and 0.016±0.003 D2 (CIN). The transition dipoles to the F and H states are constrained by the integrated FTIR measurements in methanol. Assuming a two state equilibrium and neglecting frequency factors, the integrated linear absorptions in methanol are the weighted average, , where the α’s are the fractional equilibrium populations. When combined with the Hint/Fint ratios, this weighted average leads to for BN for which there are at least two peaks in the distribution as discussed above. The H and F components of the weighted average are both equal to 0.008 D2 within experimental error for CIN.
2D IR spectroscopy of nitriles
The 2D IR spectra of BN and CN are shown in Figure 2. Each spectrum at T=0 shows two main transitions that have opposite signs. These correspond to the 0–1 and 1–2 vibrational transition regions and are separated by the diagonal anharmonicity of 22 cm−1. At later waiting time the shapes of the spectra are totally altered by the appearance of a lobe in the region of {ωτ, ωt} = {2234,2244} for BN and {ωτ, ωt} = {2221,2232}for CIN. These lobes indicate the presence of underlying cross peaks that have developed during the waiting time. The results are qualitatively similar to those seen for acetonitrile [10] and the assessment is confirmed by detailed fitting of the spectral shapes as discussed below and by simulations. In the spectra of cinnamonitrile displayed in Figure 2 the diagonal 2D IR spectra at T=0 clearly show the two bands at ωτ that are evident from the linear IR. This is further illustrated by the traces of the 2D IR spectra along the diagonal line {ωτ = ωt}shown in Figure 3. At later T values the cross peak, {ωτ, ωt} = {2221,2232}, corresponding to excitation of the lower frequency component F and probing the H distribution is again very clear from Figure 2d. The other cross peak, caused by excitation of H and probing F is less apparent but its presence is strongly indicated by its effect on canceling the 1–2 transition signal in the region {2230,2216}. These same features are not so visually apparent in the spectra of BN but they are present nevertheless as reproduced by quantitative analysis. A close inspection of the 2D IR spectra in Figure 2 shows that there is a hint of a cross peak even at T=0. We have ascertained by fitting that this small (2–5%) signal is a result of the picosecond dynamics occurring during the finite pulse widths of ca. 100 fs used in the experiments. For a kinetic analysis it is necessary to know the population relaxation, T1, times of the nitrile modes that are undergoing exchange. We carried out transient grating experiments to evaluate these relaxation parameters. The grating spectrum involves fixing the coherence time and measuring the Fourier transform along the detection axis at various values of the waiting time. These experiments showed similar T1 times of ca. 3 ps for both the nitriles consistent with previous work on nitriles where the T1 was between 1.4 and 5 ps [10,12,38]. The transient grating spectrum of the nitriles in methanol gave no sign of any significant difference between the population relaxation time of the two components of the IR absorption band, so in the analysis we will assume they are identical. If the T1 times are T1H and T1F, significant errors are introduced in the analysis of the 2D IR exchange kinetics only for waiting times longer than T1AT1B/(T1A−T1B) which is ca. 12 ps if the lifetimes differ by 20%. The kinetic data were obtained by subtracting the scaled T=0 diagonal spectral shape from those at later T. This procedure allowed quantitative determination of the relative signal strength of the cross peak, SFH, separately from the diagonal peak, SFF, and the ratio of these signals SFH/SFF is plotted versus waiting time in Figure 4.
Figure 2.

2D IR absorptive spectra in methanol of benzonitrile (a and b) and cinnamonitrile (c and d) at T=0 and T=6 ps.
Figure 3.

Trace along diagonals ωτ = ωt of the 2D IR absorptive spectra at T=0 (see Figure 2). (a) cinnamonitrile (A) and benzonitrile (B) in methanol. The two traces are scaled to have the same peak value. (b) Simulated diagonal traces of cinnamonitrile 2D IR for various equilibrium constants (solid colored lines) compared with experiment (dashed line)
Figure 4.

Waiting time, T, dependence of the relative peak height SFH of the 2D IR cross peaks to those of the diagonal peaks SFF for (A) cinnamonitrile (filled circles are data and full line is least squares fit) and (B) benzonitrile (squares are data and dashed line is least squares fit).
4. Discussion
When fast chemical processes result in the interchange of populations of structures having different vibrational frequencies, the kinetics of the interchange appears in 2D IR signals. An analysis of these changes yields the equilibrium kinetics. In the present examples the nitriles are considered to form two distributions of vibrational frequencies, one where they are mainly free (F) and the other, at higher frequency, where they are mainly hydrogen bonded (H) to methanol molecules. When there is an equilibrium, F ⇄ H, between these two types of nitriles, with equilibrium constant Keq = kFH/kHF, cross peaks between the separated H and F species vibrational transitions will appear in 2D IR if the H and F exchange occurs during the population period of the 2D IR sequence. We note again this 2D IR experiment describes a measurement of kinetics at equilibrium and does not require that the system be perturbed from equilibrium by the pulses. The Liouville paths that contribute to the photon echo and nonrephasing signals in our simulation shown in Figure 5 are of the type: {(01)H|(11)H ⇄ (11)F|(10)H/F} and {(01)H|(00)H ⇄ (00)F|(10)H/F} where (ab)C represents a coherence ab in species C. In the foregoing examples a coherence (01)H is introduced into the H-species by the first pulse in the sequence. The second pulse generates a population (11)H or (00)H which may undergo dynamic exchanges with (11)F or (00)F. Finally the signal field is generated by a third pulse that forms the detected coherence in either of the species. These terms are modified by the kinetic factor PHH as described below if H is the detected population and by PHF when F is detected after some exchanges have occurred. Also included are the two quantum terms such as {(01)H|(11)H ⇄ (11)F|(1+1,1)H/F} involving V=2 states, again with factors PHH or PHF depending on the kinetic outcome in the population period. An analogous set of diagrams consider the evolution to begin in state F. The spectral diffusion appears naturally in our simulation from those molecules that survive an exchange step during the measurement, such as the echo {(01)|(11)|(10)}H where the same H-bonded molecule undergoing spectral diffusion senses all four photon interactions. It is assumed that the spectral diffusion does not alter the magnitude of the integrated 2D IR diagonal signals which are considered to change only because of exchange and population relaxation processes and not because of changes in transition dipole with frequency (Condon approximation). The diagonal signal SHH for the H form at a given point in the two dimensional space has a T dependent shape with the content where RHH (ωτ, ωt;T) is a 2D IR spectral shape factor arising from all the pathways contributing at that point including spectral diffusion. The cross peak signal SHF in the same notation is . Each of these signals is associated with the relevant transition dipoles and the conditional probabilities PHH(T), PHF(T), PFH(T) or PFF(T) arising from kinetic equations, where PHF(T) is the probability of measuring the F population after time T if the system started out in H. For the case that the T1 times of the two species are equal these factors are:
| (1.1) |
| (1.2) |
with the other two probabilities obtained by interchanging H and F. The relaxation rate is kR =kHF +kFH. The ratio of the diagonal and cross peak signal areas is independent of T1 and is a simple function of the exchange rate. Figure 4 shows the fits of the experimental data to these kinetics. The best fit results for kR are reasonable given the poor signal to noise resulting from there being overlapping peaks. We find kR =0.19 ps−1 and 0.22 ps−1 for BN and CIN respectively by incorporating values of the transition dipoles and the equilibrium constant that were justified from the following analysis of the dephasing and 2D IR spectra.
Figure 5.

Simulation of the 2D IR spectra of cinnamonitrile. (a) kHF=kFH=0, T=0; (b) kHF=kFH=0, T=6 ps; c) kHF+kFH=0.3 ps−1, T=0 (d) kHF+kFH=0.3 ps−1, T=6 ps. The parameters of the frequency distribution dynamics are as described in the text.
2D IR spectra were simulated for CIN in accordance with the foregoing Liouville paths and standard methods [21] using a frequency correlation function: 〈ω(t)ω(0)〈 = γδ(t) + σ2 + Δ2e−t/τ which includes a motionally narrowed contribution (γ), a fixed inhomogeneous part (σ) and spectral diffusion expressed by two parameters Δ and τ. Simulations were performed at waiting times T = 0 and 6 ps by variations in the lineshape parameters and the exchange rate, with the assumption that the exchange destroys the frequency correlation. The results are shown in Figure 5. Figures 5a and 5b show the results with no exchange and Figures 5c and 5d with exchange rates of kHF + kFH=0.30 ps−1. For reasons given below, the ratio of transition dipole moments of the two CIN species was taken as . The population lifetimes for both the species were considered equal to 3.5 ps. For a two state model of exchange, a molecule in state H (or F) may or may not undergo jumps to and from F (or H) in the waiting time. The probability that a molecule in state F doesn’t jump in time t gave the fraction of PFF undergoing spectral diffusion. It was evaluated from a random telegraph signal model for which the distribution is an exponentially decaying function of kHF (or kFH). The best parameters that give an adequate fit for the linear spectrum and reproduce the principal experimental features of the 2D IR spectra are: γF = 0.18; γH = 0.19; σF = 0.37; σH = 0.41; ΔF = 0.14; ΔH = 0.35; (all in ps−1) and τF = 2.1; τH = 2.6; (in ps). The general features of the 2D IR spectra are captured by this correlation function and the simulated spectra (5a and b compared with 5c and d) illustrate clearly that the 2D IR shape is dominated by the effects of exchange which creates the asymmetric shape due to the evolution of strong underlying cross peaks. It is also apparent from the simulation that the transitions are undergoing spectral diffusion in addition to exchange. The spectral diffusion causes the peaks to be significantly more rounded after a waiting time. The spectral diffusion times τH and τF are conjectured to arise from field fluctuations at the CN of CIN caused by varying configurations of H-bonds between methanol molecules not H bonding to the solute. The parameters of this simulation were not found by detailed least square fitting to the data but rather they are intended to verify, for typical conditions, that the observed spectra are largely shaped by exchange after waiting times of a few picoseconds.
The foregoing choice of equilibrium constant can be justified from the dipole ratios found from the comparison of FTIR and 2D IR, based on the 2D IR spectrum amplitude depending on the transition dipole to a higher power than does the FTIR [10]. We have found that simulations of the trace of the 2D IR spectrum at T=0 along its diagonal line ωt = ωτ is extremely sensitive to the choice of Keq within the bounds of the parameters from FTIR. Figure 3 shows the simulated diagonal traces of the CIN 2D IR spectrum at T=0 for various values of Keq using as input the FTIR experimental equality . It is quite apparent from the fits that the equilibrium constant is less than unity: the favored value is Keq = 0.875. This result implies that the hydrogen bonded state has the larger free energy and the larger transition dipole: . The F and H transitions of BN are not so well separated as those of CIN so a detailed simulation is not justified. Nevertheless the general features are the same as those found for CIN. In particular relative strengths of the two apparent peaks in the experimental diagonal trace seen in Figure 3 for BN indicate that its equilibrium constant is again less than unity: the estimate for the dipole ratio from the experimental FTIR and the 2D IR trace is , which is an average over the double peaked H distribution discussed above. The results for both BN and CIN suggest that the transition dipole is increased upon formation of the hydrogen bond and that in both cases the F state is more stable than the H state.
This information regarding the time scales of the picosecond equilibrium dynamics of the nitriles with methanol is not available from linear spectroscopy which nevertheless could in principle access the equilibrium constants from temperature dependence studies. The 2D IR clearly exposes the presence of picosecond equilibrium exchanges of dominantly two states. The inverse exchange rates are 5.3 ps and 4.5 ps for BN and CIN respectively. It is confirmatory of the fact that the two populations seen in linear spectroscopy as a peak and a shoulder are exchanging on the few picoseconds time scale in a process initiated by hydrogen bond breaking in methanol [10,30]. The evolution of the cross peaks in 2D IR due to exchange is easily distinguishable from anharmonic coupling of a single vibrator, which would give a cross peak even at T=0, a well known property of coupled anharmonic oscillators [39]. In the present examples there are no cross peaks formed at T=0 except those attributable to the finite width of the excitation pulses, so anharmonic coupling is not the explanation of the vibrational peaks in methanol. The use of the 〈zzzz〉 polarization condition in the experiment [40] is only adequate to the extent the H and F states have similar orientational relaxation for the motion of the CN axis in the laboratory frame during the T period. This condition is unlikely to be upheld exactly since the hydrogen bond would be expected to restrict the angular motion of the nitrile group and the ratio SFH/SFF during the T period will depend on motions of the two states undergoing interchange kinetics [41]. The systematic early time deviations of the observed and calculated signal ratios as functions of T (Figure 3) may be a result of the different reorientational dynamics for the two states. Future experiments that refine these kinetic data will be required to establish the orientational relaxation associated with each of the H and F states.
This work is another example of how the shapes of linear infrared spectral transitions do not provide sufficient information to deduce the dynamics of the underlying vibrational frequency distributions. Simple models such as homogeneous decay, Voigt profiles or inhomogeneous gaussian distributions simply do not capture the time dependence of the vibrational frequencies, the spectral diffusion or the possible underlying exchange kinetics. For example the results of Figure 5c and 5d could not be reproduced with Bloch dynamics for any choices of parameters. This difficulty is most pronounced in hydrogen bonding solvents where the solvent-solute geometries can result in significant frequency shifts and fluctuations in transition dipole moment [17,42,43]. Furthermore the underlying vibrational frequency distributions are not likely to be Gaussian [44]. These factors caution against using peak positions as quantitative measures of the polarity or other characteristics of the solvent in the absence of detailed empirical correlations, since what is observed as the peak frequency can be a weighted average over non-gaussian frequency distributions. The nitrile group vibration is a case in point. Alkyl and aromatic nitriles show one almost symmetric band in water but an asymmetric non-gaussian band in methanol. The asymmetry in methanol has now been shown in three cases, acetonitrile[10], benzonitrile, and cinnamonitrile, to be caused by distributions of hydrogen bonded structures exchanging on the picosecond time scale; analogous configurations are presumably present but more rapidly averaged in liquid water where the H-bond network is three dimensional.
The vibrational frequencies associated with the F and H states are consistent with trends predicted by computations using Gaussian03. For both compounds the nitrile mode is strongly localized on the CN group and its frequency increases by ca. 9 ± 1 cm−1 on H-bonding to one methanol or one water molecule in a close to linear CN…HO configuration. The observed shifts between the H and F fundamentals and the V=0 to V=1 transitions are 5.3 cm−1 and 6.1 cm−1 for BN and CIN respectively. The squared transition dipole is predicted by Gaussian03 to increase by a factor of ca. 2 on hydrogen bonding to one water or methanol molecule in the aforementioned configuration which is a greater increase than found from the analysis of either CIN and BN. If the results from the 2D IR diagonal traces were discounted the weighted average from the linear spectra would admit a two fold increase of transition dipole on hydrogen bonding if the H-transition dipole were chosen to be the same as that measured in water but this choice renders the equilibrium constants to be inconsistent with the 2D IR diagonal traces shown in Figure 4.
There are some intrinsic difficulties in obtaining highly accurate parameters from these experiments. From the observation of spectral diffusion by 2D IR we know that any fits used in the FTIR analysis could involve a severe approximation. Also the long tails to higher frequency in the FTIR spectra in Figure 1a show that a symmetric two-state distribution of hydrogen bonded states is an oversimplified model, especially in the case of BN. The bands in the multiple peaked H-distribution of BN overlap too much for a definitive set of values to be deduced so an average value is given. As indicated earlier, the best fits minimally require three peaked distributions in the case of BN. The predictions of transition dipole moments from the 2D IR are also made approximate because the F and H contributions to the 2D IR spectrum cannot be rigorously separated although they are clearly evident from the diagonal traces.
The free energy difference between the H and F structures (Keq in the range of unity) is a few tenths of kBT. The characteristic lifetimes of the H-bonds in liquid methanol have been obtained from a number of molecular dynamic simulations. These simulations of H-bond breaking and making in methanol give times in the range of 2–5 ps [45–47] which agree with measurements on neat methanol clusters in CCl4 [30]. Recent simulations indicate that these times are widely distributed [48]. The exchange times (4.5 and 5.3 ps) we report here and also those for acetonitrile [10] are somewhat longer than the methanol H-bond breaking times, suggesting that there are barriers to forming H-bonds to the nitrile in the range of ca 2KBT.
Acknowledgments
The research was supported by NIH and NSF and instrumentation developed at the Research Resource (NIH RR03148). We thank Dr. Yung Sam Kim for helpful discussions.
References
- 1.Eaton G, Penanunez AS, Symons MCR. J Chem Soc-Faraday Trans I. 1988;84:2181. [Google Scholar]
- 2.Fawcett WR, Liu GJ, Kessler TE. J Phys Chem. 1993;97:9293. [Google Scholar]
- 3.Getahun Z, Huang CY, Wang T, De Leon B, DeGrado WF, Gai F. J Am Chem Soc. 2003;125:405. doi: 10.1021/ja0285262. [DOI] [PubMed] [Google Scholar]
- 4.Tucker MJ, Getahun Z, Nanda V, DeGrado WF, Gai F. J Am Chem Soc. 2004;126:5078. doi: 10.1021/ja032015d. [DOI] [PubMed] [Google Scholar]
- 5.Krummel AT, Zanni MT. J Phys Chem B. 2008;112:1336. doi: 10.1021/jp711558a. [DOI] [PubMed] [Google Scholar]
- 6.Andrews SS, Boxer SG. J Phys Chem A. 2000;104:11853. [Google Scholar]
- 7.Suydam IT, Boxer SG, Park ES, Romanova ZS. Biophys J. 2002;82:38A. [Google Scholar]
- 8.Suydam IT, Boxer SG. Biophys J. 2005;88:159A. [Google Scholar]
- 9.Fafarman AT, Webb LJ, Chuang JI, Boxer SG. J Am Chem Soc. 2006;128:13356. doi: 10.1021/ja0650403. [DOI] [PMC free article] [PubMed] [Google Scholar]
- 10.Kim YS, Hochstrasser RM. Proc Natl Acad Sci U S A. 2005;102:11185. doi: 10.1073/pnas.0504865102. [DOI] [PMC free article] [PubMed] [Google Scholar]
- 11.Kim YS, Hochstrasser RM. J Phys Chem B. 2006;110:8531. doi: 10.1021/jp060935n. [DOI] [PMC free article] [PubMed] [Google Scholar]
- 12.Fang C, Bauman JD, Das K, Remorino A, Arnold E, Hochstrasser RM. Proc Natl Acad Sci U S A. 2008;105:1472. doi: 10.1073/pnas.0709320104. [DOI] [PMC free article] [PubMed] [Google Scholar]
- 13.Schultz KC, Supekova L, Ryu YH, Xie JM, Perera R, Schultz PG. J Am Chem Soc. 2006;128:13984. doi: 10.1021/ja0636690. [DOI] [PubMed] [Google Scholar]
- 14.Mukherjee S, Chowdhury P, DeGrado WF, Gai F. Langmuir. 2007;23:11174. doi: 10.1021/la701686g. [DOI] [PubMed] [Google Scholar]
- 15.Choi JH, Oh KI, Lee H, Lee C, Cho M. J Chem Phys. 2008;128:8. doi: 10.1063/1.2844787. [DOI] [PubMed] [Google Scholar]
- 16.Oh KI, Choi JH, Lee JH, Han JB, Lee H, Cho M. J Chem Phys. 2008;128 doi: 10.1063/1.2904558. [DOI] [PubMed] [Google Scholar]
- 17.Lindquist BA, Corcelli SA. J Phys Chem B. 2008;112:6301. doi: 10.1021/jp802039e. [DOI] [PubMed] [Google Scholar]
- 18.Lindquist BA, Haws RT, Corcelli SA. J Phys Chem B. 2008 doi: 10.1021/jp804900u. [DOI] [PubMed] [Google Scholar]
- 19.Das K, Lewi PJ, Hughes SH, Arnold E. Prog Biophys Mol Biol. 2005;88:209. doi: 10.1016/j.pbiomolbio.2004.07.001. [DOI] [PubMed] [Google Scholar]
- 20.Das K, Bauman JD, Clark AD, Frenkel YV, Lewi PJ, Shatkin AJ, Hughes SH, Arnold E. Proc Natl Acad Sci U S A. 2008;105:1466. doi: 10.1073/pnas.0711209105. [DOI] [PMC free article] [PubMed] [Google Scholar]
- 21.Jacobomolina A, Ding JP, Nanni RG, Clark AD, Lu XD, Tantillo C, Williams RL, Kamer G, Ferris AL, Clark P, Hizi A, Hughes SH, Arnold E. Proc Natl Acad Sci U S A. 1993;90:6320. doi: 10.1073/pnas.90.13.6320. [DOI] [PMC free article] [PubMed] [Google Scholar]
- 22.Hamm P, Lim M, Hochstrasser RM. Phys Rev Lett. 1998;81:5326. [Google Scholar]
- 23.Woutersen S, Mu Y, Stock G, Hamm P. Chem Phys. 2001;266:137. [Google Scholar]
- 24.Zanni MT, Asplund MC, Hochstrasser RM. J Chem Phys. 2001;114:4579. [Google Scholar]
- 25.Park J, Ha JH, Hochstrasser RM. J Chem Phys. 2004;121:7281. doi: 10.1063/1.1792612. [DOI] [PubMed] [Google Scholar]
- 26.DeCamp MF, DeFlores L, McCracken JM, Tokmakoff A, Kwac K, Cho M. J Phys Chem B. 2005;109:11016. doi: 10.1021/jp050257p. [DOI] [PubMed] [Google Scholar]
- 27.Kuo CH, Vorobyev DY, Chen JX, Hochstrasser RM. J Phys Chem B. 2007;111:14028. doi: 10.1021/jp076503+. [DOI] [PubMed] [Google Scholar]
- 28.Hamm P, Lim MH, Hochstrasser RM. J Phys Chem B. 1998;102:6123. [Google Scholar]
- 29.Kwac K, Lee H, Cho MH. J Chem Phys. 2004;120:1477. doi: 10.1063/1.1633549. [DOI] [PubMed] [Google Scholar]
- 30.Zheng J, Kwak K, Asbury J, Chen X, Piletic IR, Fayer MD. Science. 2005;309:1338. doi: 10.1126/science.1116213. [DOI] [PubMed] [Google Scholar]
- 31.Scheurer C, Steinel T. Chem Phys Chem. 2007;8:503. doi: 10.1002/cphc.200600765. [DOI] [PubMed] [Google Scholar]
- 32.Cahoon JF, Sawyer KR, Schlegel JP, Harris CB. Science. 2008;319:1820. doi: 10.1126/science.1154041. [DOI] [PubMed] [Google Scholar]
- 33.Schmidt JR, Corcelli SA, Skinner JL. J Chem Phys. 2004;121:8887. doi: 10.1063/1.1791632. [DOI] [PubMed] [Google Scholar]
- 34.Li SZ, Schmidt JR, Piryatinski A, Lawrence CP, Skinner JL. J Phys Chem B. 2006;110:18933. doi: 10.1021/jp057568k. [DOI] [PubMed] [Google Scholar]
- 35.Nyquist RA. Appl Spec. 1990;44:1405. [Google Scholar]
- 36.Kim YS, Wang J, Hochstrasser Robin M. J Phys Chem B. 2005;109:7511. doi: 10.1021/jp044989d. [DOI] [PubMed] [Google Scholar]
- 37.Huang CY, Wang T, Gai F. Chem Phys Lett. 2003;371:731. [Google Scholar]
- 38.Kurochkin DV, Naraharisetty SRG, Rubtsov IV. Proc Natl Acad Sci U S A. 2007;104:14209. doi: 10.1073/pnas.0700560104. [DOI] [PMC free article] [PubMed] [Google Scholar]
- 39.Woutersen S, Hamm P. J Phys-Condes Matter. 2002;14:R1035. [Google Scholar]
- 40.Hochstrasser RM. Chem Phys. 2001;266:273. [Google Scholar]
- 41.Cross AJ, Waldeck DH, Fleming GR. J Chem Phys. 1983;78:6455. [Google Scholar]
- 42.Castner EW, Maroncelli M. J Mol Liq. 1998;77:1. [Google Scholar]
- 43.Schmidt JR, Corcelli SA, Skinner JL. J Chem Phys. 2005;123 doi: 10.1063/1.1961472. [DOI] [PubMed] [Google Scholar]
- 44.Kim YS, Hochstrasser RM. J Phys Chem B. 2007;111:9697. doi: 10.1021/jp074267x. [DOI] [PubMed] [Google Scholar]
- 45.Haughney M, Ferrario M, McDonald IR. J Phys Chem. 1987;91:4934. [Google Scholar]
- 46.Matsumoto M, Gubbins KE. J Chem Phys. 1990;93:1981. [Google Scholar]
- 47.Pagliai M, Cardini G, Righini R, Schettino V. J Chem Phys. 2003;119:6655. [Google Scholar]
- 48.Sharma R, Chakravarty C, Milotti E. J Phys Chem B. 2008;112:9071. doi: 10.1021/jp802085v. [DOI] [PubMed] [Google Scholar]