Abstract
Huntington's disease (HD) is a neurodegenerative disorder previously thought to be of primary neuronal origin, despite ubiquitous expression of mutant huntingtin (mHtt). We tested the hypothesis that mHtt expressed in astrocytes may contribute to the pathogenesis of HD. To better understand the contribution of astrocytes in HD in vivo, we developed a novel mouse model using lentiviral vectors that results in selective expression of mHtt into striatal astrocytes. Astrocytes expressing mHtt developed a progressive phenotype of reactive astrocytes that was characterized by a marked decreased expression of both glutamate transporters, GLAST and GLT-1, and of glutamate uptake. These effects were associated with neuronal dysfunction, as observed by a reduction in DARPP-32 and NR2B expression. Parallel studies in brain samples from HD subjects revealed early glial fibrillary acidic protein expression in striatal astrocytes from Grade 0 HD cases. Astrogliosis was associated with morphological changes that increased with severity of disease, from Grades 0 through 4 and was more prominent in the putamen. Combined immunofluorescence showed co-localization of mHtt in astrocytes in all striatal HD specimens, inclusive of Grade 0 HD. Consistent with the findings from experimental mice, there was a significant grade-dependent decrease in striatal GLT-1 expression from HD subjects. These findings suggest that the presence of mHtt in astrocytes alters glial glutamate transport capacity early in the disease process and may contribute to HD pathogenesis.
INTRODUCTION
Huntington's disease (HD) is a genetically dominant neurodegenerative disorder characterized by psychiatric symptoms, progressive chorea and cognitive decline, with marked neuropathological involvement of the basal ganglia (1). HD is caused by the expansion of a polyglutamine repeat in the protein huntingtin (Htt). Wild-type and mutant Htt (mHtt) are expressed in many cell types. Although abnormalities in peripheral tissues have been recently reported in HD (2), the most striking changes are found within the neostriatum, in which there is gross atrophy of the caudate nucleus and putamen accompanied by marked neuronal loss (3). In particular, striatal GABAergic, medium-sized, spiny projection neurons (MSNs) are affected early and most severely in the disease (4,5). The mechanisms causing mHtt gain and/or loss-of-function remain unclear and include transcriptional modulation, protein aggregation, proteosomal dysfunction, axonal transport deficit, mitochondrial dysregulation, and excitotoxicity (6,7). Despite the fact that MSNs are the primary neostriatal target of the mutation, the selective expression of mHtt in MSNs does not induce significant locomotor deficits and striatal neuropathology, suggesting that cell–cell interactions are necessary for striatal pathogenesis to occur (8). In particular, corticostriatal glutamatergic inputs may play a key role (9). In addition, glial cells and notably astrocytes could also be involved in pathological cell–cell interactions. Astrocytes via their glutamate transporters GLAST and GLT-1 regulate extracellular glutamate levels (10), neuronal transmission (11) and energy metabolism (12). Alteration of these functions has long been suggested to contribute to the pathophysiology of HD. Mutated Htt is expressed in all glial cells, but very little is known regarding their possible function. Original neuropathological analyses of post-mortem brains of HD patients revealed astrogliosis of increasing magnitude in the course of the disease (3). As in many other neurodegenerative diseases, it has been proposed that these glial changes mainly reflect a response to neuronal death and/or dysfunction. However, recent in vitro evidence suggests that expression of mHtt in astrocytes may directly affect astrocyte function, exacerbating the dysfunction of vulnerable striatal neurons (13). To better understand the contribution of astrocytes in HD in vivo, we developed a novel mouse model using lentiviral vectors that results in selective expression of mHtt into striatal astrocytes. Astrocytes expressing mHtt progressively developed a reactive phenotype and showed a marked decreased expression of both glutamate transporters and a reduction in glutamate uptake. These effects were associated with neuronal dysfunction, as observed by a reduced DARPP-32 and NR2B expression, two markers of MSNs. Consistent with the above findings, a comprehensive histological analysis revisiting potential astrocyte reactivity in post-mortem brains of HD patients showed the presence of astrogliosis in Grade 0 caudate nucleus and validated the co-localization of mHtt in astrocytes along with a grade-dependent reduction in GLT-1. These results collectively suggest that mHtt activates astrocytes and impairs their function, reducing glutamate uptake and contributing to striatal dysfunction in HD.
RESULTS
Selective expression of mHtt in neurons and astrocytes of mice striatum using two different lentiviruses
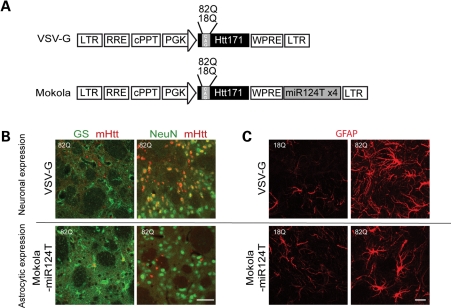
Four weeks after injection of lentiviral vectors encoding the first 171 amino acids of the human Htt with 82 glutamines (Htt171-82Q) in adult mouse striatum, mHtt aggregates were detected by immunofluorescence on brain coronal sections. These aggregates co-localized with the neuronal nucleus marker NeuN (Fig. 1B), but not with the astrocytic marker GS, using the G protein envelope of the vesicular stomatitis virus (VSV-G)-pseudotyped lentiviral vector. However, when the Mokola-pseudotyped lentiviral vector including the four copies of the miR124T was injected into mouse striatum, fewer aggregates were observed and they co-localize with GS and not with NeuN (Fig. 1B). The results show that these gene transfer systems allow for a selective expression of a short fragment of mHtt in either striatal neurons or astrocytes. We also present evidence that the Mokola-miR124T lentiviral vector did not transduce microglia using an antibody directed against Iba1 (data not shown).
Figure 1.
Characterization of the mouse model expressing Htt171-82Q in astrocytes. (A) Scheme of the proviral vector form of lentiviral vector modified to carry the four copies of the miRNA target sequences (miR124T). Lentiviral vectors were pseudotyped with VSV-G or Mokola. (B) Double immunofluorescent staining with either GS (green) and Huntingtin-2B4 (red) or with NeuN (green) and 2B4 (red) confirmed that the lentiviral vector pseudotyped with VSV-G induced the expression of mHtt (observed as aggregates) in NeuN-positive neurons and not in GS-positive astrocytes, whereas the vector pseudotyped with Mokola and including miR124T induced the expression of mHtt in GS-positive astrocytes and not in NeuN-positive neurons. (C) When Htt171-82Q is expressed in neurons, astrocytes adopt the prototypical features of reactive astrocytes. Expression of Htt171-82Q in astrocytes leads also to a marked increase in GFAP expression but the cells do not lose their domain organization. Scale bars (B), 50 µm (C) 20 µm.
We next studied the consequence of such expression on astrocyte reactivity using immunofluorescent staining of glial fibrillary acidic protein (GFAP). Neuronal expression of Htt171-82Q led to a marked increase in GFAP immunostaining, with astrocytes adopting the prototypical features of reactive astrocytes (Fig. 1C). Selective expression of Htt171-82Q into astrocytes also induced an increase in GFAP expression. No astrocyte activation was noted when Htt171-18Q was expressed into neurons or astrocytes, suggesting that such activation was not due to the infection of cells by a lentiviral vector. This result indicates that expression per se of Htt171-82Q into astrocytes alters their phenotype. We therefore studied the time course of the morphological changes induced by Htt171-82Q into astrocytes.
Expression of Htt171-82Q in astrocytes changes their morphology
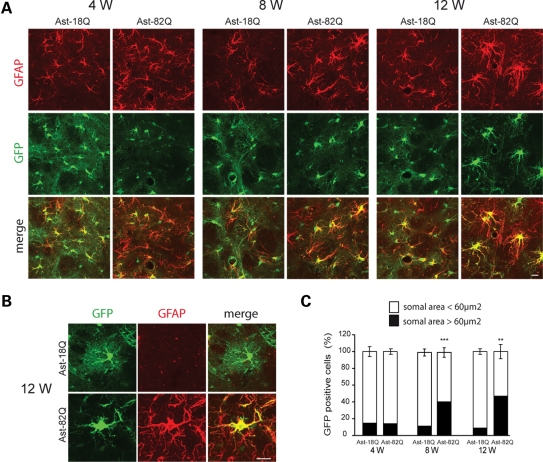
To better characterize the morphological changes and to follow the fine astrocytic processes that are not stained by GFAP, we co-injected a Mokola-pseudotyped lentiviral vector encoding green fluorescent protein (GFP) with the Mokola-pseudotyped vector encoding Htt171-82Q or 18Q. As previously noted with a VSV-G-pseudotyped vector (14), we observed that the injection of two different Mokola-pseudotyped vectors co-infected the majority of astrocytes within the injected region (data not shown). At 4 weeks after injection, GFP expression revealed the astrocytic processes, including the fine distal arbors (Fig. 2A), as we reported previously (15). Four to 12 weeks after intrastriatal injection, GFAP staining increased in astrocytes expressing Htt171-82Q, when compared with those expressing Htt171-18Q. Since reactive astrocytes are characterized by hypertrophy (16), we measured the somal area of astrocytes expressing GFP at 4, 8 and 12 weeks after lentiviral vectors injection. At all time points, the vast majority of astrocytes (85%) expressing Htt171-18Q displayed a somal area <60 µm2 with only a small fraction (15%) having an area >60 µm2. The proportion of larger astrocytes (somal area >60 µm2) significantly increased up to 47% at 12 weeks when they expressed Htt171-82Q (Fig. 2B). Since resting astrocytes can proliferate after injury (17), we counted the total number of dividing cells in the entire neostriatum at 12 weeks. We did not observe significant proliferation, since the total number of 5-bromo-2-deoxyuridine (BrdU)-incorporating cells was not statistically different between 18 and 82Q (672 ± 86 versus 593 ± 71 cells). We did note, however, a mild but significant decrease of the number of GFP-positive astrocytes at 12 weeks (mean number of cells per field: 12.7 ± 1.2 for 18Q versus 9.1 ± 1.1 for 82Q, P = 0.041).
Figure 2.
Time course of the morphological changes in astrocytes expressing mHtt. (A) Increase in GFAP immunostaining (red) in astrocytes co-infected with Htt171-82Q or 18Q and GFP (green) at 4- to 12-week post-injection. (B) At 12 weeks, astrocytes expressing mHtt become hypertrophic with larger processes and withdraw most of their finer processes. (C) Quantification of the somal area of GFP-positive astrocytes. At 4, 8 and 12 weeks, the vast majority of the astrocytes expressing Htt171-18Q have a somal area <60 µm2. The proportion changes with time for astrocytes expressing Htt171-82Q, and at 12 weeks, half of the astrocytes have a somal area >60 µm2 (Student's paired t-test versus respective 18Q control, ***P < 0.001; **P < 0.01). Scale bars 20 µm.
Htt171-82Q in astrocytes decreases the expression and function of astrocytic glutamate transporters
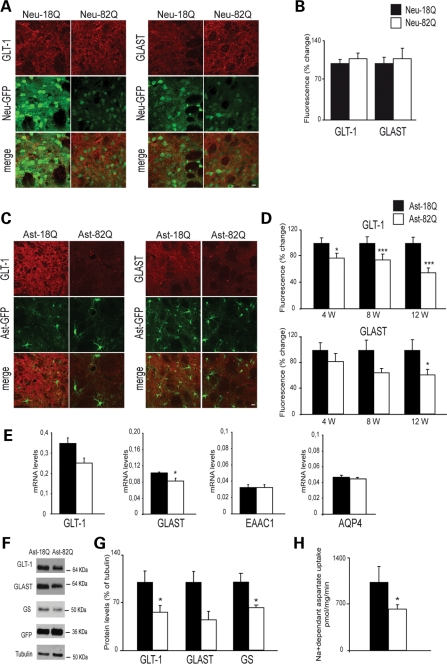
Dysfunction of glutamate transport has been reported in different mouse models of HD. Whether this finding is indirectly linked to neuronal dysfunction or a direct consequence of the expression of mHtt into astrocytes has not been determined in vivo. We injected mice with a mixture of selected lentiviral vectors that allow for a restricted expression of mHtt and GFP into either neurons or astrocytes. At selected time points after injection, either immunofluorescence staining was performed on striatal sections or fresh GFP-positive striatal tissues were collected and analyzed. Six weeks after injection of the VSV-G-pseudotyped lentiviral vector, the immunofluorescence staining of GLAST and GLT-1 did not change when Htt171-82Q was expressed into neurons. This result suggests that glutamate transport is not altered by neuronal Htt171-82Q (Fig. 3A and B). We next studied brain samples from mice injected with the Mokola-miR124T lentiviral vector, allowing for specific astrocytic targeting. Quantification of the immunofluorescence staining of GLT-1 showed a significant and progressive decrease reaching a maximum at 12-week post-injection (−45%). Immunofluorescence staining of GLAST also decreased, but the effect was only statistically significant 12-week post-injection (−38%; Fig 3C and D). These changes were not the consequence of a global astrocytic dysfunction, since the expression of S100β quantified by immunofluorescence was not modified by Htt171-18Q (data not shown). Twelve-week post-injection, real-time quantitative polymerase chain reaction (RT-qPCR) performed from striatal GFP-positive samples showed a decrease in GLT-1 and GLAST mRNA levels in the Htt171-82Q-injected side compared with Htt171-18Q (28 and 20% respectively; Fig. 3E). mRNA levels of the neuronal glutamate transporter EAAC1 and of the astrocytic aquaporin 4 (AQP4) did not change. Using primers that recognize both mouse and human Htt, we were able to show that the mRNA level of Htt171-82Q was 2.4 times greater than the endogenous level of Htt (0.038 ± 0.004 versus 0.017 ± 0.001, P < 0.01, Student's t-test), indicating that the effects we observed were not the consequence of a massive overexpression of Htt171-82Q into astrocytes. We also performed immunoblotting (Fig. 3F and G) on fresh samples from the GFP-positive area 12 weeks after lentiviral vector injection. Densitometric analysis of GLT-1 and GLAST signals showed a respective decrease of 44 and 55% (Fig. 3E). Expression of glutamine synthetase (GS) was also significantly decreased by 38%. Finally, 3H-d-aspartate uptake performed on synaptosomal fractions 12-week post-injection revealed a functional loss of glial transporters by ∼40% (Fig. 3H). Together, these results suggest that glutamate transport dysfunction is a direct consequence of Htt171-82Q in astrocytes.
Figure 3.
(A and B) Expression of Htt171-82Q in neurons does not change the level of expression of astrocytic glutamate transporters GLT-1 and GLAST. Immunostaining of GLT-1 or GLAST was performed 6 weeks after injection of VSV-G-Htt171-18Q or 82Q in mice striatum (n = 5; Student's paired t-test, P = 0.53 and 0.69, respectively). (C) mHtt in astrocytes decreases the expression and function of glutamate transporters GLAST and GLT-1. Immunofluorescence of GLT-1 and GLAST in the area expressing Htt171-82Q compared with the area expressing Htt171-18Q at 12 weeks. (D) Htt171-82Q significantly decreases the expression of GLT-1 at all time points and of GLAST only at 12 weeks (n = 6 at each time points; Student's paired t-test; *P < 0.05; ***P < 0.001). (E) RT-qPCR of GLT-1, GLAST, EAAC1 and AQP4 on striatal GFP-positive area at 12 weeks relative to cyclophiline mRNA level (n = 5; Student's paired t-test, *P < 0.05). (F and G) Quantification of immunoblots confirmed the decreased expression of both GLT-1 and GLAST and showed a significant decrease in GS. (Student's paired t-test, n = 8, 5 and 8, respectively). (H) 3H-aspartate uptake on synaptosomes from GFP-positive striatal samples. Expression of Htt171-82Q significantly decreases glutamate uptake (−39%) at 12 weeks (Student's t-test, *P = 0.02).
Overexpression of GLT-1 partly rescues the astrocyte phenotype
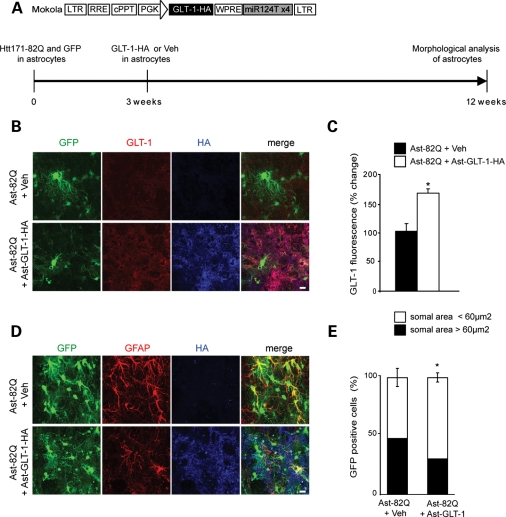
To determine whether the loss of glutamate transport capacity by Htt171-82Q-expressing astrocytes was directly detrimental to their phenotypic changes, we overexpressed GLT-1, using the Mokola-miR124T lentiviral vector, in astrocytes expressing Htt171-82Q. Nine weeks after injection, the expression of GLT-1 was increased by 64% and the proportion of reactive astrocytes (somal area >60 µm2) was significantly decreased from 48–30% (Fig. 4). This result suggests that overexpression of GLT-1 partially rescued astrocyte dysfunction.
Figure 4.
Overexpression of GLT-1 improves mHtt-induced morphological changes of astrocytes. (A) Scheme of the proviral vector form of the lentiviral vector modified to carry the four copies of the miRNA target sequences and encoding GLT-1-HA. A lentiviral vector encoding GLT-1-HA or PBS–BSA was injected 3 weeks after Htt171-82Q + GFP in the same injection site and morphological analysis was performed 9 weeks after. (B and C) In the area immunopositive for HA (blue) and GFP, GLT-1 expression is significantly increased by 64% (n = 4, Student's paired t-test, *P = 0.013). (D) GFAP immunostaining decreases when GLT-1 is overexpressed in mHtt-transduced astrocytes. (E) Quantification of GFP-positive somal area in the HA-positive area 9 weeks after GLT-1 overexpression shows that the proportion of astrocytes with somal area >60 µm2 decreases from 48 to 30% (Student's t-test, *P = 0.028). Scale bars 10 µm.
Htt171-82Q in astrocytes decreases the expression of DARPP-32 and NR2b in neurons
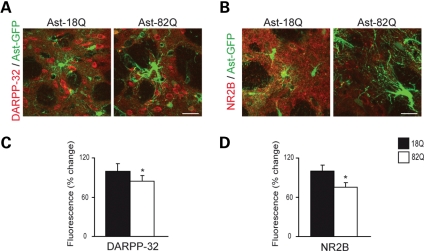
Dopamine and adenosine 3′,5′-monophosphate-regulated phosphoprotein (32 kDa) (DARPP-32), is highly enriched in striatal medium spiny neurons. Its down-regulation is an early marker of neuronal dysfunction in HD (18,19). NMDAR-NR2B subunits are a major NR2 subunit predominantly expressed extrasynaptically by these striatal medium spiny neurons (20,21). We observed a significant decrease in the immunofluorescence staining of DARPP-32 and NR2B 12 weeks after the expression of Htt171-82Q into astrocytes (−15 and −25% versus Htt171-18Q, respectively, P < 0.05) (Fig. 5). These results indicate that Htt171-82Q-induced astrocyte dysfunction can impact neuronal function.
Figure 5.
mHtt in astrocytes decreases the expression of neuronal markers DARPP-32 and NR2B. Twelve weeks after selective co-transduction of Htt171-82Q + GFP in astrocytes in vivo, expression of DARPP-32 (A, C) and NR2B (B, D) was significantly decreased by 15 and 25%, respectively (Student's paired t-test, *P = 0.046, *P = 0.029). Scale bars 20 µm.
Grade-dependent increased GFAP immunoexpression in human HD striatum
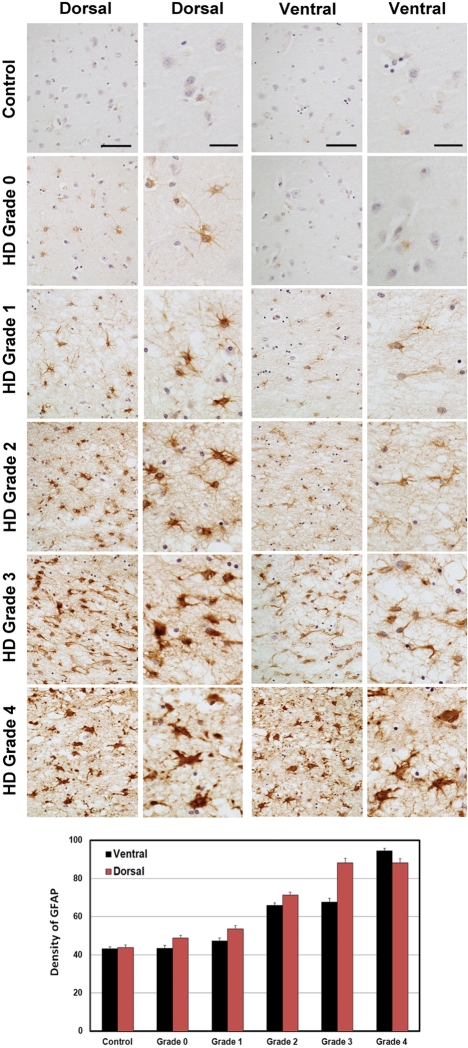
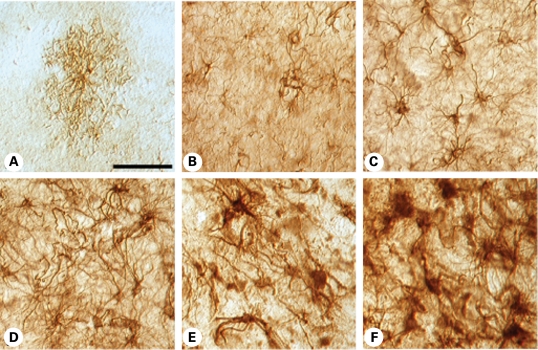
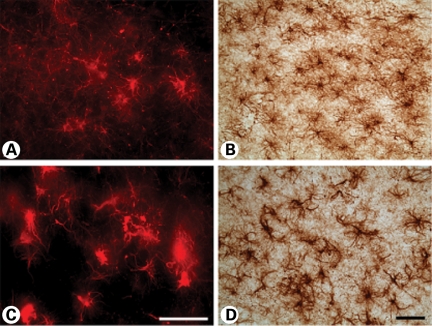
Since our data obtained in the mouse model suggest that astrocytic mHtt alters the phenotype of astrocytes, we sought to re-evaluate the time course of the GFAP immunoexpression in 10 µm paraffin-embedded human HD neostriatal specimens by using well-defined HD stages, particularly Grade 0 patients. Immunoexpression of GFAP was present in the neostriatal specimens in all grades of severity (0–4) from HD subjects (Fig. 6). GFAP expression became increasingly more intense with a greater number of astrocytes expressing GFAP, with increasing grade of severity. As previously reported, reactive astrocytosis was first present in the dorsal striatum and coursed to the ventral striatum in a dorso-ventral gradient with greater disease progression (3). We observed the presence of fibrillary astrocytosis in the dorsal striatum in Grade 0 HD subjects. There was a significant grade-dependent increase in GFAP immunoreactivity first present in Grade 0 specimens with a continued increase in GFAP expression through Grade 4 specimens, when compared with normal control tissues (control versus G1, P < 7 × 10⁻⁴; control versus G2, P < 8 × 10⁻¹⁰; control versus G3, P < 6 × 10⁻¹⁰; control versus G4, P < 1 × 10⁻¹⁰). In addition, densitometric analysis showed significant differences between dorsal and ventral regions within each grade (G1, P < 0.0214; G2, P < 9.7 × 10⁻⁵; G3, P < 5.5 × 10⁻⁶; G4, P < 0.0282). Although qualitative data from the two Grade 0 HD cases may be too small for a meaningful interpretation, these cases are very rare pathological samples and may provide pathophysiological direction in HD and, as such, these findings warrant attention. GFAP immunostaining in 50 µm-thick free-floating tissue sections confirmed our findings of increased fibrillary astrocytosis in Grade 0 HD striatal specimens, in comparison to non-neurological control specimens (Fig. 7). Astroglial morphological changes occurred as fibrillary astrogliosis became more fulminant with disease severity, with greater immunoreactive intensity, a thickened more tortuous arborization and increased somal size (Fig. 7). Using Nomarski optics, we show that in normal control specimens, astrocytes were lightly immunostained and presented with abundant short thin branches and a lace-like pattern that formed rounded arborizations. In Grade 0 cases, increased immunointensity occurred in astrocytes, with the absence of the fine lace-like appearance. Markedly increased changes in astrocytes occurred with greater disease severity, until the dysmorphic reactive astroglia became almost unrecognizable in the most severe grade (Fig. 7). Although fibrillary astrocytosis was present in both the caudate nucleus and the putamen in all grades, these morphological changes were more prominent in the putamen, in contrast to the caudate nucleus, particularly with regard to somal size and arbor thickness (Fig. 8). This finding suggests a different degenerative process in these areas of the neostriatum.
Figure 6.
Representative GFAP immunohistochemistry–hematoxylin-stained paraffin sections from the caudate nucleus in non-neurological control, Grade 0, Grade 1, Grade 2, Grade 3 and Grade 4 HD subjects. The array of photomicrographs for each specimen group shows the ventral-most caudate nucleus and dorsal-most caudate nucleus at low and high power. There was increased reactive astrocytosis starting in the dorsal segment of Grade 0 cases with a dorso-ventral progression of greater immunoreactive astrocyte activity with severity of disease. Densitometric analysis showed significant differences between grades and between dorsal and ventral regions within each grade. The magnification bars in the low-power columns are 100 and 25 µm in the high-power columns for the dorsal and ventral areas, respectively.
Figure 7.
Nomarski optics using GFAP immunohistochemistry in thick (50 µm) tissue sections from the caudate nucleus in non-neurological control (A), Grade 0 (B), Grade 1 (C), Grade 2 (D), Grade 3 (E) and Grade 4 (F) HD subjects. Normal astrocytes present as faintly GFAP-stained cells with a short lace-like branching pattern distributed symmetrically around the cell soma. With increasing disease progression, there was greater GFAP immunoreactivity, twisting and thickened arbors, with larger somal size. The degree of astrogliosis became so great as to mask their individual appearance. The magnification bar in (A) represents 100 µm and is the same in all photomicrographs.
Figure 8.
Immunohistochemistry and immunofluorescence microscopy of the medial area of caudate nucleus (A and B) and putamen (C and D) in a Grade 3 subject. The degree of astroglial dysmorphology was greater in the putamen than in the caudate nucleus, with thickened and tortuous arbors along with increased somal size. The magnification bar in (C) and (D) represents 100 µm.
Co-localization of GFAP and Htt immunoexpression in striatal astroglia
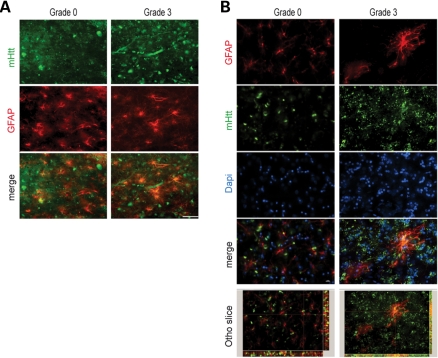
Combined immunofluorescence of GFAP and Htt in graded cases from HD subjects showed co-localization in all grades of HD severity (Fig. 9). Two-dimensional immunofluorescence showed marked co-localization of each protein in severe grade cases, with moderate co-localization in lower grade cases, especially Grade 0. In order to ensure the validity of our findings, we performed confocal analysis of tissue specimens. These studies were consistent with the two-dimensional interpretation (Fig. 9). Htt/GFAP co-localization in striatal grey matter from Grade 0 HD is a novel finding and suggests that the presence of Htt aggregates in astroglia is an early and progressive event that may be associated with the pathophysiology of the disease.
Figure 9.
Combined GFAP and huntingtin immunofluorescence in the medial caudate nucleus in Grade 3 and Grade 0 HD subjects. Two-dimensional analysis showed overlap of each of the antisera (GFAP, red; huntingtin green; and merged figures, yellow) (A). Confocal immunofluorescence of Grade 0 and Grade 3 showed definitive co-localization throughout the tissue specimens (B). The magnification bar represents 20 µm.
Down-regulation of GLT-1 immunoexpression in striatal specimens from HD subjects
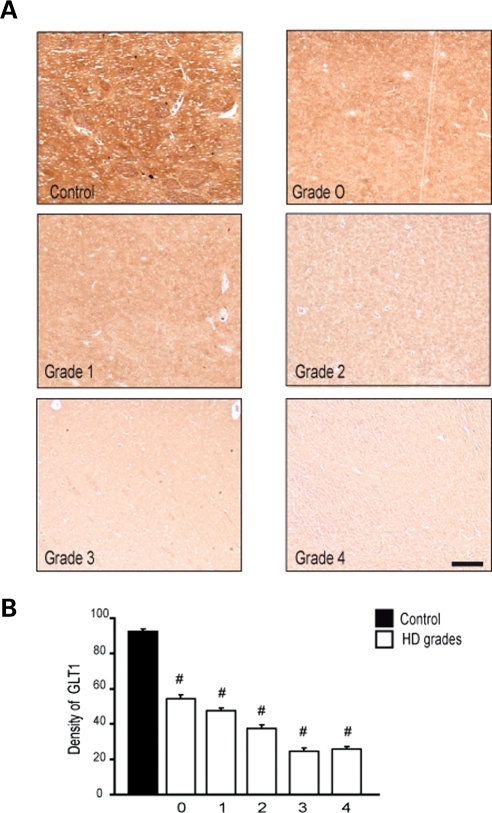
In conjunction with the experiments reported above in mice expressing Htt171-82Q in astrocytes only, we performed an immunohistochemical analysis of GLT-1 in neostriatal specimens from HD subjects. There was a grade-dependent loss of GLT-1 present in Grade 0 specimens with a continued loss of tissue protein expression through Grade 4 specimens, when compared with normal control specimens (control versus G1, P < 9 × 10⁻⁶; control versus G2, P < 9 × 10⁻⁶; control versus G3, P < 9 × 10⁻⁶; control versus G4, P < 9 × 10⁻⁶) (Fig. 10).
Figure 10.
Immunohistochemical expression of GLT-1 in the caudate nucleus from control and Grade 0–4 HD tissue specimens showed marked reduction of GLT-1 in a grade-dependent manner from HD tissue specimens, in comparison to age-matched normal control specimens (A). Densitometric analysis of GLT-1 immunofluorescence showed significant grade-dependent reductions in GLT-1, with significant differences between grades (B). The magnification bar represents 200 µm.
DISCUSSION
Non-cell autonomous degeneration is now thought to operate in an increasing number of neurodegenerative diseases, including polyQ repeat disorders (22). In addition to neuron–neuron interactions, neuron-glial cell and in particular neuron-astrocyte cross-talk are implicated in some degenerative processes (23). Animal models developed to evaluate the contribution of astrocytes are usually obtained by driving the expression of the mutant protein with the specific astrocytic promoter gfa2, a 2.2 kDa human GFAP promoter (24,25). This promoter contains regulatory elements activated during astrogliosis (26) and, as such, expression levels of the transgene may depend on the phenotype of the astrocyte. We have employed a different gene transfer strategy using our newly developed lentiviral vector (15) to express the first 171 amino acids of the human Htt with normal (18) or expanded (82) glutamine repeat into striatal astrocytes, under the control of the mouse phosphoglycerate kinase 1 promoter. This experimental approach led to the expression of Htt171-82Q or 18Q in a select subpopulation of striatal astrocytes. On the basis upon our recent observation (15), we assumed that ∼37 500 astrocytes were transduced by a single injection of 3 µl of the Mokola-miR124T lentiviral vector. Of interest, ∼3400 neurons were also transduced, despite a decreased expression in the transgene by >50% due to the repression induced by the mir124T (15). We, therefore, concluded that the residual expression of Htt171-82Q into neurons using Mokola-miR124T lentiviral vector was negligible. At 4 weeks after injection, mHtt aggregates were observed in astrocytes and not in neurons, confirming the selectivity of the viral vector. The fact that mHtt can form aggregates in astrocytes is supported by previous observations of glial aggregates in R6/2 mice expressing HD exon 1 protein and Hdh CAG(150) knock-in mice expressing full-length mHtt (13). We also observed co-localization of Htt and GFAP in striatal astrocytes from HD subjects. Although similar findings have been previously reported (13), they have not been observed in the striatal grey matter or in low-grade specimens from HD patients. Htt/GFAP co-localization in Grade 0 HD is a novel finding and suggests that the presence of Htt in astroglia is an early and progressive event that may be associated with the pathophysiology of the disease.
In response to CNS pathology, astrocytes undergo a characteristic change in appearance, hypertrophy of their soma and cellular processes, a phenomenon referred to as reactive gliosis (16). During chronic diseases, reactive astrocytes are evenly distributed and have randomly orientated processes, a reversible phenomenon called isomorphic gliosis. Original neuropathological analyses of post-mortem brains of HD patients have revealed reactive gliosis starting in Grade 1 specimens and with increasing magnitude in the pathological grades of the disease (3). As in many other neurodegenerative diseases, it has been proposed that these glial changes are secondary to neuronal dysfunction and death. In the present studies, we observed an increased GFAP expression in the dorsal striatum in each Grade 0 HD subject. Such early activation suggests that mHtt in astrocytes may contribute to these phenotypic changes via intrinsic mechanisms. This hypothesis is corroborated by our observation in mice expressing mHtt only in striatal astrocytes that display a reactive phenotype at 8 weeks after injection, despite the absence of a marked neuronal dysfunction or death at this time. Activation of astrocytes was directly linked to Htt171-82Q expression since no changes were observed with Htt171-18Q. This result suggests that reactive gliosis may be the result of an intrinsic reaction of astrocytes expressing mutant proteins. We cannot rule out the alternative hypothesis that the gliosis-like changes in mHtt-expressing astrocytes also results from disturbances in extracellular glutamate load that in turn lead to the astrogliotic changes. Although the correlation between increased astrogliosis and neuronal loss has long been a favored topic of discussion in HD, much less attention has been brought forth with regard to the differential expression of disease severity between the caudate nucleus and the putamen. There has been some suggestion that preferential putaminal degeneration may be more fulminant in HD (27,28). Our findings of greater astroglial hypertrophy and dysmorphology in the putamen versus the caudate nucleus in the same cases is consistent with these reports. Our results also suggest that such differential vulnerability may be due to a higher susceptibility of putaminal HD astrocytes.
It has long been hypothesized that excessive glutamatergic signaling in the neostriatum may contribute to the pathophysiology of HD (29,30). Recent experimental evidence demonstrates that the deafferentation of corticostriatal and nigrostriatal pathways in the neostriatum of HD mice mitigates striatal stress and neurodegeneration, ameliorating neuropathological sequelae (9). Accordingly, neurons expressing high levels of NMDA receptors are lost early in the striatum of individuals affected with HD (31,32). In particular, mutant Htt protein aggregation may result in impaired mitochondrial function (33) and increases the sensitivity of neurons to excitotoxicity associated with the stimulation of NMDA receptors harboring the NR2B subunits (21). Indeed, degeneration is exacerbated in Hdh CAG(150) knock-in mice overexpressing NR2B (34).
Astrocytic uptake of glutamate and the conversion of glutamate to glutamine is the predominant mechanism of inactivation of glutamate once released in the synaptic cleft. This uptake involves two transporters, GLT-1 and GLAST, GLT-1 being predominantly expressed in the striatum (10). We report, herein, that expression of a short N-terminal fragment of mHtt into striatal astrocytes is sufficient to decrease the expression of both glutamate transporters in a time-dependent manner. Expression levels of both mRNAs were also reduced, but less markedly, suggesting that transcriptional and post-translational mechanisms mediated by polyglutamine-expanded huntingtin may contribute to the decreased expression of GLAST and GLT-1 proteins. Such an effect was associated with a significant reduction of glutamate uptake capacity by striatal synaptosomes and with a decrease in GS expression. No change was observed when Htt171-82Q was expressed in striatal neurons. Together, these data suggest that the global impairment of the mechanisms responsible for glutamate inactivation may be linked to the expression of polyQ-expanded Htt in astrocytes and not in neurons, as recently observed in transgenic mice that express mutant N-terminal htt fragments under the GFAP promoter (35).
Our results are consistent with a previously reported decrease in GLT-1 in R6/2 transgenic mice (36,37) and these findings may be due to the glial expression of mHtt. We also show that the loss of GLT-1 protein is an early event in human disease pathogenesis, showing a significant reduction in Grade 0 HD human specimens, with a continued grade-dependent loss of tissue protein expression of GLT-1 in Grade 4 HD. This result suggests that our findings in mice expressing the short N-terminal fragment of Htt parallel those observed by the expression of the full-length Htt protein. As we also observed in mice, such decreases may result from transcriptional dysregulation, since GLT-1 mRNA has previously been shown to be reduced in HD patients in more advanced grades (38). The impairment of glutamate transport and recycling capacity was associated with a significant decrease in the expression of two neuronal markers, DARPP-32 and NR2B in our mouse model, indicating that the selective expression of mHtt into astrocytes is sufficient to alter neuronal function. DARPP-32 is an early marker of striatal neuron dysfunction and is down-regulated by 4 weeks after expression of mHtt into neurons (19) and in pre-symptomatic transgenic HD mice (18,39). In these HD mice, the loss of DARPP-32 is a consequence of transcriptional dysregulation via the interaction of neuronal mHtt with the transcription factor Sp1 (40). The NR2B subunit is a key mediator of the excitotoxic damage elicited by mHtt expression (30). NR2B-type NMDARs predominate at extra-synaptic sites on the plasma membrane and are linked to pathways involved in cell death (41). Their expression is altered in different models of HD mice (42) and in human HD samples (38). Of interest, increased activity of calpain was recently suggested to contribute to the loss of NR2B-containing surface receptors (43). Our result, however, identifies other mechanisms, likely involving dysregulation of extracellular glutamate buffering, which could contribute to the decreased expression of DARPP-32 and NR2B in HD.
Impaired astrocytic glutamate uptake is recognized as a critical pathophysiological event in a number of neurodegenerative diseases, including amyotrophic lateral sclerosis, spinocerebellar ataxia type 7, some tauopathies and HD (22). As such, these findings have implications for the development of potential new therapies. Increasing the activity of glial transporters may therefore represent an obvious strategy. In the present study, selective gene transfer of GLT-1 into striatal astrocytes ameliorates the phenotype of astrocytes, but it remains to be determined whether such an approach could slow disease progression in transgenic HD mice. Of great interest, the β-lactam antibiotic ceftriazone that up-regulates GLT-1 expression (44) ameliorates disease phenotype in HD mice (45). Our study highlights the need for a therapeutic approach targeting both neurons and glial cells in the context of HD.
MATERIALS AND METHODS
Animals
Seven-week-old male C57Bl6 mice (weight, 20 g; Charles River, France) were used in this study. All experimental procedures were performed in strict accordance with the recommendations of the European Commission (86/609/EEC) concerning the care and use of laboratory animals.
Lentiviral vectors
To target the expression of mHtt into neurons, we used our previously described self-inactivated lentiviral vectors pseudotyped with VSV-G and encoding the first 171 amino acids of the human huntingtin gene (htt) with 18 or 82 CAG repeats under the control of the mouse phosphoglycerate kinase 1 promoter (19). To target the expression of the transgene into astrocytes, we used our more recently developed vector (15). This lentiviral vector is pseudotyped with the G protein envelope of the Mokola lyssaviruses which displays a preferential natural tropism toward astrocytes. To increase its selectivity, we used the microRNA (miRNA) regulation pathway (46). To avoid expression of the transgene in neurons, four copies of a natural target sequence of the specific neuronal miR124 (miR124T) were inserted after the woodchuck posttranscriptional regulatory element (Fig. 1A). For the visualization of individually labeled cells, we also used a lentiviral vector encoding GFP as described previously (15). Mouse GLT-1 cDNA (pcDNA3-myc-GLT-1 plasmid kindly provided by Dr K. Tanaka) was inserted in the Mokola-pseudotyped lentiviral vector including four copies of miR124T. The hemaglutinin (HA) Tag (epitope YPYDVPDYA) was inserted in N-terminus to distinguish its expression from the endogenous GLT-1. Lentiviral vectors were produced in 293T cells, using a four-plasmid system, as previously described (47). The vectors were resuspended in 1% bovine serum albumin (BSA) in phosphate-buffered saline (PBS) and the virus particle content was determined by p24 antigen ELISA (RETROtek, Gentaur, Kampenhout, Belgium). The stocks were stored at −80°C until use.
Stereotaxic injections of lentiviral vectors
Mice were anesthetized with a mixture of ketamine (100 mg/kg) and xylazine (10 mg/kg). Lentiviral vectors encoding the htt gene with 18Q (wild type) or 82Q (mutated) were mixed in PBS–1% BSA with vectors encoding GFP (3/1) to reach a final concentration of 130 ng p24/µl. Suspensions of lentiviral vectors were injected into the striatum, using a 34 G blunt-tip needle linked to a Hamilton syringe by a polyethylene catheter. A total volume of 3 µl was injected at 0.2 µl/min. The stereotaxic coordinates were: anteroposterior, +1 mm; lateral, ±1.8 mm from the bregma; and ventral, −2.5 mm from the dura, with tooth bar set at 0 mm. At the end of the injection, the needle was left in place for 5 min before being slowly removed. The skin was sutured and mice were allowed to recover.
Real-time quantitative polymerase chain reaction
One millimeter-thick fresh brain slices were obtained using a mouse brain matrix and 1.2 mm diameter punches were sampled from the GFP-positive area under a fluorescent microscope and were quickly frozen in dry ice and stored at −80°C. Total RNAs were extracted using a guanidinium thiocyanate-based and phenol method. RT reaction was performed on 400 ng of total RNA using Superscript II reverse transcriptase (Invitrogen, Cergy, France) followed by treatment with RNase H. Three nanograms of random-primed cDNAs were processed for RT-qPCR using Mastercycler® ep realplex (Eppendorf, Le Pecq, France), and PCR products were quantified by measuring SYBR green fluorescent dye incorporation. Values obtained for GLT-1, GLAST, EAAC1 and AQP4 were normalized to cyclophilin A expression (Table 1). All experiments were carried out in triplicates for each sample.
Table 1.
Oligonucleotide sequences used for RT-qPCR
| GLAST-F | TCTCCAGTCTCGTCACAGGAATG |
| GLAST-R | TGCCAATCACCACAGCAATG |
| GLT1-F | GGCAATCCCAAACTCAAGAAGC |
| GLT1-R | GTCACTGTCTGAATCTGCTGGAAAC |
| EAAC1-F | ATGTGCTACATGCCGATTGG |
| EAAC1-R | CTCAGGACAGTGGCCATGTAAA |
| AQP-4-F | TTGGACCCGCAGTTATCATG |
| AQP-4-R | GCGACGTTTGAGCTCCACAT |
| Htt-F | CCGCTGCACCGACCAAAGAA |
| Htt-R | ATTTCTGAGAGACTGTGCCA |
| CYCLO-F | ATGGCAAATGCTGGACCAAA |
| CYCLO-R | GCCTTCTTTCACCTTCCCAAA |
Immunoblotting
Fresh samples of striatal GFP-positive area were obtained as mentioned above and were homogenized into 30 µl of lysis buffer [50 mm Tris–HCl, pH 7.4, 100 mm NaCl, 1% SDS, and protease inhibitor cocktail (1:200; Roche, Basel, Switzerland)]. Total protein content was determined with the BCA Protein Assay Reagent (Thermo Scientific, Waltham, MA, USA), according to the manufacturer's instructions, and 15 or 20 µg of total homogenate protein was subjected to SDS–PAGE (4% stacking and 10% running gels) and transferred onto nitrocellulose membranes. Membranes were blocked by incubation for 1 h with 5% non-fat milk powder in 25 mm Tris, pH 7.4, 150 mm NaCl and 0.1% Tween 20 (TBST buffer). Membranes were incubated overnight at 4°C with GLT-1, GLAST (rabbit; 1:5000, Frontier Sciences, Ishikari, Hokkaido, Japan), GFP (rabbit, 1:100, Ozyme, Montigny le Bretonneux, France), tubulin (mouse; 1:10 000; Sigma-Aldrich, St Louis, MO, USA) or GS antibodies (mouse, 1:2000, BD Biosciences, Franklin Lakes, NJ, USA). Membranes were washed and incubated with peroxidase-conjugated secondary antibody (1:5000) for 1 h. Chemiluminescence reaction was carried out (ECL kit, GE Healthcare, Uppsala, Sweden) and revealed using Kodak BioMax ML film or CCD imaging system Fusion Fx7. Optical density of immunoblots was measured using a computer-based image analysis system (MCID Analysis, St Catharines, Ontario, Canada).
Immunofluorescence and image analysis
Following an overdose of sodium pentobarbital, mice were perfused transcardially with 4% paraformaldehyde (PFA) in PB 0.1 m. Brains were post-fixed by incubation in the same solution overnight and cryoprotected by incubation in a 30% sucrose solution during 48 h. Floating coronal brain sections (40 µm) were cut on a freezing microtome, collected serially (interspace 240 or 280 µm), and stored at −20°C in a storing solution containing ethylene glycol, glycerol and PB 0.1 m, until analysis. Sections were blocked and incubated overnight at 4°C with a solution containing the primary antibody in 10% Normal goat serum (NGS) 0.1 m PBS. The primary antibodies used were: GFAP-Cy3 (1:500 GA-5 clone, mouse, Sigma-Aldrich), GS (1:3000, rabbit, Sigma-Aldrich), GLAST or GLT-1 (1:5000, rabbit, Frontier Sciences), Huntingtin 2B4 (1:600, mouse, Chemicon, Billerica, MA, USA), HA (1:1000, mouse, Covance, Princeton, NJ USA), S100β (1:3000, mouse, Sigma-Aldrich), neuronal nuclear protein (NeuN; 1:500, mouse, Chemicon), BrdU (1:100, rat, Sigma-Aldrich), NMDAε2 (NR2B, goat, 1:50, Santa Cruz Biotechnology, Santa Cruz, CA, USA). They were then incubated for 1 h at room temperature with fluorescent secondary antibodies diluted at 1:500 (anti-rabbit AlexaFluor 594, anti-mouse AlexaFluor 488; anti-rat AlexaFluor 594, anti-mouse AlexaFluor 633; Invitrogen). The sections were mounted in FluorSave reagent (Calbiochem, Merck, Darmstadt, Germany), covered with a cover slip and analyzed with confocal microscopy (LSM 510, Zeiss, Le Pecq, France) using a ×63 objective. Stack images were taken in the GFP-positive area using the same settings for all conditions. The fluorescence intensity of GLAST and GLT-1 staining was measured using Morpho Expert software (Explora Nova, La Rochelle, France). Somata of astrocytes were extracted by thresholding using Morpho Expert software and their cross-section areas were measured and classified into two categories: ≤60 and >60 µm2 [corresponding to a mean diameter of ∼9 µm, the typical diameter of quiescent astrocytes (48)].
BrdU incorporation
Mice were injected with BrdU (Sigma, France) during 3 consecutive days (one intraperitoneal injection/day, 50 mg/kg, 0.1 m NaOH in saline). Mice were then perfused with 4% PFA in PB 0.1 m and sections were processed as described above. Immunostaining of BrdU was performed on brain sections after the following specific pre-treatment: 5 min in 3% H2O2, 10% methanol in 0.1 m PBS. Sections were rinsed, incubated 30 min in 2 N HCl, 0.5% Triton X-100 in 0.1 m PBS at 37°C and washed in 0.1 m borate buffer (pH 8.6). Then sections were processed as described above.
3H-Aspartate uptake on synaptosomes
Tritiated [3H]-d-aspartate uptake assays into synaptosomes were performed according to (49). Fresh samples of striatal GFP-positive area were obtained as mentioned above and were homogenized with a glass–glass homogenizer in ice-cold isolation medium (310 mm sucrose and 10 mm HEPES, pH 7.4), followed by centrifugation at 1000g for 5 min. The supernatant was collected and centrifuged at 20 000g for 20 min to obtain the crude synaptosomal P2 pellet. Protein concentration was determined by BCA kit (Thermo Scientific). P2 pellet were resuspended at a protein concentration of 0.75 µg/µl in either HEPES-buffered saline (10 mm HEPES, 5 mm Tris base, 140 mm NaCl, 2.5 mm KCl, 1.2 mm CaCl2, 1.2 mm MgCl2, 1.2 mm K2HPO4 and 10 mm glucose, pH 7.4) for the specific uptake or in HEPES-buffered Na+ free (HB-Na+ free) (10 mm HEPES, 5 mm Tris base, 140 mm choline-Cl, 2.5 mm KCl, 1.2 mm CaCl2, 1.2 mm MgCl2, 1.2 mm K2HPO4 and 10 mm glucose, pH 7.4) for the non-specific uptake. Synaptosomal pellets (23 µg each) were incubated 7 min with 100 µM d-aspartate and 0.25 µCi d-3H-aspartate at room temperature. Reactions were terminated by filtration followed by rapid washing with ice-cold HB-Na+ free. Radioactivity retained on the filters was determined by scintillation counting. In all uptake experiments, the radioactivity retained after incubation in HB-Na+ free was used to correct all data to represent Na+-dependent uptake.
Human brain tissue specimens
Post-mortem striatal tissue specimens from 25 adult-onset HD patients (2 Grade 0 subjects; 3 Grade 1 cases, 5 Grade 2 cases, 9 Grade 3 cases and 6 Grade 4 cases; mean age of death, 66.7 years; range, 59–70 years) and 8 age-matched patients without any known neurological symptoms (mean age, 68.9 years; range 60–78 years) were dissected fresh and placed in cold (4°C) 2% PFA–lysine–periodate solution for 24–36 h. Brain tissue specimens were collected at the Bedford Veterans Administration Medical Center Brain Tissue Archive. The post-mortem intervals did not exceed 18 h (mean time, 12.2 h; range, 4–18 h) and were similar for controls and HD patients. CAG repeat length analysis was performed on the HD specimens (mean number of CAG repeats, 43.8). The range of CAG repeats in the adult-onset HD patients was 41–48. Each HD patient had been clinically diagnosed based on known family history and phenotypic symptoms of HD. The diagnosis of HD was confirmed by neuropathological examination and graded by severity (3). Fixed striatal tissue blocks were rinsed in 0.1 m sodium phosphate buffer, and placed in cold cryoprotectant in increasing concentrations of 10 and 20% glycerol, 2% DMSO solution for 24–36 h. Frozen serial sections of the striatal tissue blocks from the anterior commissure to the rostral extent of the globus pallidus were cut at 50 µm intervals in the coronal plane and placed within a six-well collection container. The cut sections were stored in 0.1 m sodium phosphate buffer with 0.08% sodium azide at 4°C for subsequent immunocytochemistry, immunofluorescence and combined immunofluorescence methods for GFAP, GLT-1 and huntingtin antibodies. Contiguous tissue blocks were processed for paraffin embedding and specimens were cut at 10 µm and subsequently stained for GFAP and hematoxylin. Tissue sections were examined using a Nikon Eclipse E800 microscope with a Spot RT digital camera using light, Nomarski, and fluorescent optics.
Immunocytochemistry
Immunohistochemical localization of antibodies to GFAP (1:500 GA-5 clone, mouse, Sigma), GLT-1 (1:5000, rabbit, Frontier Sciences) and Huntingtin 2B4 (1:600, mouse, Chemicon) was performed by using a conjugated second antibody method. Tissue sections from human striatum were pre-incubated in an absolute methanol and 0.3% hydrogen peroxide solution for 30 min, washed (three times) in PBS (pH 7.4) for 10 min each, placed in 10% NGS (GIBCO) for 1 h, incubated free-floating in primary antiserum at room temperature for 12–18 h (all dilutions of primary antisera above included 0.08% Triton X-100 and 2% NGS), washed (three times) in PBS for 10 min each, placed in horse radish peroxidase-conjugated goat anti-rabbit IgG (1:300 in PBS, Boehringer Mannheim, Indianapolis, IN, USA) or goat anti-mouse IgG (1:300 in PBS, Boehringer Mannheim), washed (three times) in PBS for 10 min each and reacted with 3,3′-diaminobenzidine HCl (1 mg/ml) in Tris–HCl buffer with 0.005% hydrogen peroxide. Specificity for the antisera used in this study was examined in each immunochemical experiment to assist with interpretation of the results. This examination was accomplished by using blocking peptides or by omission of the primary antibody to determine the amount of background generated from the detection assay.
Fluorescent immunocytochemistry
Immunofluorescence for GFAP and mHtt was performed on human striatal HD and normal control tissue specimens. Immunofluorescence was performed as described previously (50). Striatal sections were incubated with anti-mHtt antibody (1:500, mouse, Chemicon) in Tris–HCl buffer containing 0.3% Triton X-100 for 24–72 h at 4°C. Sections were then rinsed (three times) in PBS, incubated in the dark with horse anti-mouse FITC conjugate for 2 h at 20°C (Boehringer Mannheim; 1:200), rinsed (three times) in PBS and incubated with Cy3-conjugated anti-GFAP (1:500 GA-5 clone, mouse, Sigma) for 24–72h at 4°C. Sections were wet-mounted and coverslipped with 50% glycerol. Identical microscopic fields were immediately photographed with a Nikon Eclipse E800 fluorescent microscope, delineating the location of GFAP and mHtt immunoreactivities within the same striatal section. The fields were merged and co-localization was analyzed.
Confocal image analysis
Digital imaging analysis was performed and images were captured at 0.25 µm intervals, and stacks were deconvoluted with a constrained iterative algorithm, using a cooled charge-coupled device camera (Retiga-2000R: Q-Imaging). Optical sections were captured using NIS-Elements AR (Nikon Instruments Inc, Melville, NY, USA) and processed using a 3D deconvolution module. The spatial distribution of Htt and GFAP in the caudate nucleus from HD subjects was determined using confocal microscopy and an image analysis program (Auto Quant 3D, MediaCybernetics, Inc., Bethesda, MD, USA). We analyzed a series of 15–20 confocal layers representing fluorescence data from striatal astrocytes and subsequently developed an abstract image that provided the results.
Quantification
Densitometric analysis of GFAP and GLT-1 immunofluorescence was performed with the experimenter blinded to disease conditions on multiple rendered images selected by the imaging software system from human caudate nucleus using Image-Pro Plus (MediaCybernetics, Inc.), using inverted microscopic images to measure the intensity of immunostaining.
Statistical analysis
Results are expressed as mean values ± SEM. Statistical analysis included paired (for left–right comparisons) and non-paired Student's t-test. The partition ratio obtained from somal area values (i.e. proportion) was normalized using the arcsine transformation before performing paired Student's t-test (51). Neuropathological data were compared by ANOVA followed by post hoc Dunnett's test (Statistica, Statsoft, France). The significance level was set at P < 0.05.
FUNDING
This work was supported by CEA, CNRS, National Institutes of Health Grants NS045806 and NS058793, and the Veterans Administration. The research leading to these results has received funding from the European Community's Seventh Framework Programme FP7/2007-2013 under grant agreement no. HEALTH-F5-2008-222925. Funding to pay the Open Access Charge was provided by CEA.
ACKNOWLEDGEMENTS
The authors acknowledge the expert technical assistance provided by Diane Houitte, Marion Chaigneau, Charlène Josephine, Carole Malgorn, Dr Carole Escartin and Dr Marie-Claude Gaillard. We thank Dr Séverine Boillée for critical reading of the manuscript.
Conflict of Interest statement. None declared.
REFERENCES
- 1.Vonsattel J.P., DiFiglia M. Huntington disease. J. Neuropathol. Exp. Neurol. 1998;57:369–384. doi: 10.1097/00005072-199805000-00001. [DOI] [PubMed] [Google Scholar]
- 2.van der Burg J.M., Bjorkqvist M., Brundin P. Beyond the brain: widespread pathology in Huntington's disease. Lancet Neurol. 2009;8:765–774. doi: 10.1016/S1474-4422(09)70178-4. doi:10.1016/S1474-4422(09)70178-4. [DOI] [PubMed] [Google Scholar]
- 3.Vonsattel J.P., Myers R.H., Stevens T.J., Ferrante R.J., Bird E.D., Richardson E.P., Jr Neuropathological classification of Huntington's disease. J. Neuropathol. Exp. Neurol. 1985;44:559–577. doi: 10.1097/00005072-198511000-00003. doi:10.1097/00005072-198511000-00003. [DOI] [PubMed] [Google Scholar]
- 4.Ferrante R.J., Kowall N.W., Beal M.F., Richardson E.P., Jr, Bird E.D., Martin J.B. Selective sparing of a class of striatal neurons in Huntington's disease. Science. 1985;230:561–563. doi: 10.1126/science.2931802. doi:10.1126/science.2931802. [DOI] [PubMed] [Google Scholar]
- 5.Ferrante R.J., Kowall N.W., Richardson E.P., Jr Proliferative and degenerative changes in striatal spiny neurons in Huntington's disease: a combined study using the section-Golgi method and calbindin D28k immunocytochemistry. J. Neurosci. 1991;11:3877–3887. doi: 10.1523/JNEUROSCI.11-12-03877.1991. [DOI] [PMC free article] [PubMed] [Google Scholar]
- 6.Gil J.M., Rego A.C. Mechanisms of neurodegeneration in Huntington's disease. Eur. J. Neurosci. 2008;27:2803–2820. doi: 10.1111/j.1460-9568.2008.06310.x. doi:10.1111/j.1460-9568.2008.06310.x. [DOI] [PubMed] [Google Scholar]
- 7.Bossy-Wetzel E., Petrilli A., Knott A.B. Mutant huntingtin and mitochondrial dysfunction. Trends Neurosci. 2008;31:609–616. doi: 10.1016/j.tins.2008.09.004. [DOI] [PMC free article] [PubMed] [Google Scholar]
- 8.Gu X., Andre V.M., Cepeda C., Li S.H., Li X.J., Levine M.S., Yang X.W. Pathological cell-cell interactions are necessary for striatal pathogenesis in a conditional mouse model of Huntington's disease. Mol. Neurodegener. 2007;2:8. doi: 10.1186/1750-1326-2-8. doi:10.1186/1750-1326-2-8. [DOI] [PMC free article] [PubMed] [Google Scholar]
- 9.Stack E.C., Dedeoglu A., Smith K.M., Cormier K., Kubilus J.K., Bogdanov M., Matson W.R., Yang L., Jenkins B.G., Luthi-Carter R., et al. Neuroprotective effects of synaptic modulation in Huntington's disease R6/2 mice. J. Neurosci. 2007;27:12908–12915. doi: 10.1523/JNEUROSCI.4318-07.2007. doi:10.1523/JNEUROSCI.4318-07.2007. [DOI] [PMC free article] [PubMed] [Google Scholar]
- 10.Danbolt N.C. Glutamate uptake. Prog. Neurobiol. 2001;65:1–105. doi: 10.1016/s0301-0082(00)00067-8. doi:10.1016/S0301-0082(00)00067-8. [DOI] [PubMed] [Google Scholar]
- 11.Oliet S.H., Piet R., Poulain D.A. Control of glutamate clearance and synaptic efficacy by glial coverage of neurons. Science. 2001;292:923–926. doi: 10.1126/science.1059162. doi:10.1126/science.1059162. [DOI] [PubMed] [Google Scholar]
- 12.Voutsinos-Porche B., Bonvento G., Tanaka K., Steiner P., Welker E., Chatton J.Y., Magistretti P.J., Pellerin L. Glial glutamate transporters mediate a functional metabolic crosstalk between neurons and astrocytes in the mouse developing cortex. Neuron. 2003;37:275–286. doi: 10.1016/s0896-6273(02)01170-4. doi:10.1016/S0896-6273(02)01170-4. [DOI] [PubMed] [Google Scholar]
- 13.Shin J.Y., Fang Z.H., Yu Z.X., Wang C.E., Li S.H., Li X.J. Expression of mutant huntingtin in glial cells contributes to neuronal excitotoxicity. J. Cell Biol. 2005;171:1001–1012. doi: 10.1083/jcb.200508072. doi:10.1083/jcb.200508072. [DOI] [PMC free article] [PubMed] [Google Scholar]
- 14.Régulier E., Pereira de Almeida L., Sommer B., Aebischer P., Deglon N. Dose-dependent neuroprotective effect of ciliary neurotrophic factor delivered via tetracycline-regulated lentiviral vectors in the quinolinic acid rat model of Huntington's disease. Hum. Gene. Ther. 2002;13:1981–1990. doi: 10.1089/10430340260355383. doi:10.1089/10430340260355383. [DOI] [PubMed] [Google Scholar]
- 15.Colin A., Faideau M., Dufour N., Auregan G., Hassig R., Andrieu T., Brouillet E., Hantraye P., Bonvento G., Deglon N. Engineered lentiviral vector targeting astrocytes in vivo. Glia. 2009;57:667–679. doi: 10.1002/glia.20795. doi:10.1002/glia.20795. [DOI] [PubMed] [Google Scholar]
- 16.Escartin C., Bonvento G. Targeted activation of astrocytes: a potential neuroprotective strategy. Mol. Neurobiol. 2008;38:231–241. doi: 10.1007/s12035-008-8043-y. doi:10.1007/s12035-008-8043-y. [DOI] [PubMed] [Google Scholar]
- 17.Buffo A., Rite I., Tripathi P., Lepier A., Colak D., Horn A.P., Mori T., Gotz M. Origin and progeny of reactive gliosis: a source of multipotent cells in the injured brain. Proc. Natl Acad. Sci. USA. 2008;105:3581–3586. doi: 10.1073/pnas.0709002105. doi:10.1073/pnas.0709002105. [DOI] [PMC free article] [PubMed] [Google Scholar]
- 18.Bibb J.A., Yan Z., Svenningsson P., Snyder G.L., Pieribone V.A., Horiuchi A., Nairn A.C., Messer A., Greengard P. Severe deficiencies in dopamine signaling in presymptomatic Huntington's disease mice. Proc. Natl Acad. Sci. USA. 2000;97:6809–6814. doi: 10.1073/pnas.120166397. doi:10.1073/pnas.120166397. [DOI] [PMC free article] [PubMed] [Google Scholar]
- 19.de Almeida L.P., Ross C.A., Zala D., Aebischer P., Deglon N. Lentiviral-mediated delivery of mutant huntingtin in the striatum of rats induces a selective neuropathology modulated by polyglutamine repeat size, huntingtin expression levels, and protein length. J. Neurosci. 2002;22:3473–3483. doi: 10.1523/JNEUROSCI.22-09-03473.2002. [DOI] [PMC free article] [PubMed] [Google Scholar]
- 20.Landwehrmeyer G.B., Standaert D.G., Testa C.M., Penney J.B., Jr, Young A.B. NMDA receptor subunit mRNA expression by projection neurons and interneurons in rat striatum. J. Neurosci. 1995;15:5297–5307. doi: 10.1523/JNEUROSCI.15-07-05297.1995. [DOI] [PMC free article] [PubMed] [Google Scholar]
- 21.Zeron M.M., Hansson O., Chen N., Wellington C.L., Leavitt B.R., Brundin P., Hayden M.R., Raymond L.A. Increased sensitivity to N-methyl-d-aspartate receptor-mediated excitotoxicity in a mouse model of Huntington's disease. Neuron. 2002;33:849–860. doi: 10.1016/s0896-6273(02)00615-3. doi:10.1016/S0896-6273(02)00615-3. [DOI] [PubMed] [Google Scholar]
- 22.Lobsiger C.S., Cleveland D.W. Glial cells as intrinsic components of non-cell-autonomous neurodegenerative disease. Nat. Neurosci. 2007;10:1355–1360. doi: 10.1038/nn1988. doi:10.1038/nn1988. [DOI] [PMC free article] [PubMed] [Google Scholar]
- 23.Maragakis N.J., Rothstein J.D. Mechanisms of disease: astrocytes in neurodegenerative disease. Nat. Clin. Pract. Neurol. 2006;2:679–689. doi: 10.1038/ncpneuro0355. doi:10.1038/ncpneuro0355. [DOI] [PubMed] [Google Scholar]
- 24.Forman M.S., Lal D., Zhang B., Dabir D.V., Swanson E., Lee V.M., Trojanowski J.Q. Transgenic mouse model of tau pathology in astrocytes leading to nervous system degeneration. J. Neurosci. 2005;25:3539–3550. doi: 10.1523/JNEUROSCI.0081-05.2005. doi:10.1523/JNEUROSCI.0081-05.2005. [DOI] [PMC free article] [PubMed] [Google Scholar]
- 25.Custer S.K., Garden G.A., Gill N., Rueb U., Libby R.T., Schultz C., Guyenet S.J., Deller T., Westrum L.E., Sopher B.L., et al. Bergmann glia expression of polyglutamine-expanded ataxin-7 produces neurodegeneration by impairing glutamate transport. Nat. Neurosci. 2006;9:1302–1311. doi: 10.1038/nn1750. doi:10.1038/nn1750. [DOI] [PubMed] [Google Scholar]
- 26.Brenner M., Kisseberth W.C., Su Y., Besnard F., Messing A. GFAP promoter directs astrocyte-specific expression in transgenic mice. J. Neurosci. 1994;14:1030–1037. doi: 10.1523/JNEUROSCI.14-03-01030.1994. [DOI] [PMC free article] [PubMed] [Google Scholar]
- 27.Rosas H.D., Goodman J., Chen Y.I., Jenkins B.G., Kennedy D.N., Makris N., Patti M., Seidman L.J., Beal M.F., Koroshetz W.J. Striatal volume loss in HD as measured by MRI and the influence of CAG repeat. Neurology. 2001;57:1025–1028. doi: 10.1212/wnl.57.6.1025. [DOI] [PubMed] [Google Scholar]
- 28.Kipps C.M., Duggins A.J., Mahant N., Gomes L., Ashburner J., McCusker E.A. Progression of structural neuropathology in preclinical Huntington's disease: a tensor based morphometry study. J. Neurol. Neurosurg. Psychiatry. 2005;76:650–655. doi: 10.1136/jnnp.2004.047993. doi:10.1136/jnnp.2004.047993. [DOI] [PMC free article] [PubMed] [Google Scholar]
- 29.McGeer E.G., McGeer P.L. Duplication of biochemical changes of Huntington's chorea by intrastriatal injections of glutamic and kainic acids. Nature. 1976;263:517–519. doi: 10.1038/263517a0. doi:10.1038/263517a0. [DOI] [PubMed] [Google Scholar]
- 30.Fan M.M., Raymond L.A. N-Methyl-d-aspartate (NMDA) receptor function and excitotoxicity in Huntington's disease. Prog. Neurobiol. 2007;81:272–293. doi: 10.1016/j.pneurobio.2006.11.003. doi:10.1016/j.pneurobio.2006.11.003. [DOI] [PubMed] [Google Scholar]
- 31.Young A.B., Greenamyre J.T., Hollingsworth Z., Albin R., D'Amato C., Shoulson I., Penney J.B. NMDA receptor losses in putamen from patients with Huntington's disease. Science. 1988;241:981–983. doi: 10.1126/science.2841762. doi:10.1126/science.2841762. [DOI] [PubMed] [Google Scholar]
- 32.Albin R.L., Young A.B., Penney J.B., Handelin B., Balfour R., Anderson K.D., Markel D.S., Tourtellotte W.W., Reiner A. Abnormalities of striatal projection neurons and N-methyl-d-aspartate receptors in presymptomatic Huntington's disease. N. Engl. J. Med. 1990;322:1293–1298. doi: 10.1056/NEJM199005033221807. [DOI] [PubMed] [Google Scholar]
- 33.Damiano M., Galvan L., Deglon N., Brouillet E. Mitochondria in Huntington's disease. Biochim. Biophys. Acta. 2009;1802:52–61. doi: 10.1016/j.bbadis.2009.07.012. [DOI] [PubMed] [Google Scholar]
- 34.Heng M.Y., Detloff P.J., Wang P.L., Tsien J.Z., Albin R.L. In vivo evidence for NMDA receptor-mediated excitotoxicity in a murine genetic model of Huntington disease. J. Neurosci. 2009;29:3200–3205. doi: 10.1523/JNEUROSCI.5599-08.2009. doi:10.1523/JNEUROSCI.5599-08.2009. [DOI] [PMC free article] [PubMed] [Google Scholar]
- 35.Bradford J., Shin J.Y., Roberts M., Wang C.E., Li X.J., Li S. Expression of mutant huntingtin in mouse brain astrocytes causes age-dependent neurological symptoms. Proc. Natl Acad. Sci. USA. 2009;106:22480–22485. doi: 10.1073/pnas.0911503106. doi:10.1073/pnas.0911503106. [DOI] [PMC free article] [PubMed] [Google Scholar]
- 36.Behrens P.F., Franz P., Woodman B., Lindenberg K.S., Landwehrmeyer G.B. Impaired glutamate transport and glutamate-glutamine cycling: downstream effects of the Huntington mutation. Brain. 2002;125:1908–1922. doi: 10.1093/brain/awf180. doi:10.1093/brain/awf180. [DOI] [PubMed] [Google Scholar]
- 37.Estrada-Sanchez A.M., Montiel T., Segovia J., Massieu L. Glutamate toxicity in the striatum of the R6/2 Huntington's disease transgenic mice is age-dependent and correlates with decreased levels of glutamate transporters. Neurobiol. Dis. 2009;34:78–86. doi: 10.1016/j.nbd.2008.12.017. doi:10.1016/j.nbd.2008.12.017. [DOI] [PubMed] [Google Scholar]
- 38.Arzberger T., Krampfl K., Leimgruber S., Weindl A. Changes of NMDA receptor subunit (NR1, NR2B) and glutamate transporter (GLT1) mRNA expression in Huntington's disease—an in situ hybridization study. J. Neuropathol. Exp. Neurol. 1997;56:440–454. doi: 10.1097/00005072-199704000-00013. doi:10.1097/00005072-199704000-00013. [DOI] [PubMed] [Google Scholar]
- 39.Slow E.J., van Raamsdonk J., Rogers D., Coleman S.H., Graham R.K., Deng Y., Oh R., Bissada N., Hossain S.M., Yang Y.Z., et al. Selective striatal neuronal loss in a YAC128 mouse model of Huntington disease. Hum. Mol. Genet. 2003;12:1555–1567. doi: 10.1093/hmg/ddg169. doi:10.1093/hmg/ddg169. [DOI] [PubMed] [Google Scholar]
- 40.Luthi-Carter R., Hanson S.A., Strand A.D., Bergstrom D.A., Chun W., Peters N.L., Woods A.M., Chan E.Y., Kooperberg C., Krainc D., et al. Dysregulation of gene expression in the R6/2 model of polyglutamine disease: parallel changes in muscle and brain. Hum. Mol. Genet. 2002;11:1911–1926. doi: 10.1093/hmg/11.17.1911. doi:10.1093/hmg/11.17.1911. [DOI] [PubMed] [Google Scholar]
- 41.Hardingham G.E., Bading H. The Yin and Yang of NMDA receptor signalling. Trends Neurosci. 2003;26:81–89. doi: 10.1016/S0166-2236(02)00040-1. doi:10.1016/S0166-2236(02)00040-1. [DOI] [PubMed] [Google Scholar]
- 42.Fan M.M., Fernandes H.B., Zhang L.Y., Hayden M.R., Raymond L.A. Altered NMDA receptor trafficking in a yeast artificial chromosome transgenic mouse model of Huntington's disease. J. Neurosci. 2007;27:3768–3779. doi: 10.1523/JNEUROSCI.4356-06.2007. doi:10.1523/JNEUROSCI.4356-06.2007. [DOI] [PMC free article] [PubMed] [Google Scholar]
- 43.Cowan C.M., Fan M.M., Fan J., Shehadeh J., Zhang L.Y., Graham R.K., Hayden M.R., Raymond L.A. Polyglutamine-modulated striatal calpain activity in YAC transgenic huntington disease mouse model: impact on NMDA receptor function and toxicity. J. Neurosci. 2008;28:12725–12735. doi: 10.1523/JNEUROSCI.4619-08.2008. doi:10.1523/JNEUROSCI.4619-08.2008. [DOI] [PMC free article] [PubMed] [Google Scholar]
- 44.Rothstein J.D., Patel S., Regan M.R., Haenggeli C., Huang Y.H., Bergles D.E., Jin L., Dykes Hoberg M., Vidensky S., Chung D.S., et al. Beta-lactam antibiotics offer neuroprotection by increasing glutamate transporter expression. Nature. 2005;433:73–77. doi: 10.1038/nature03180. doi:10.1038/nature03180. [DOI] [PubMed] [Google Scholar]
- 45.Miller B.R., Dorner J.L., Shou M., Sari Y., Barton S.J., Sengelaub D.R., Kennedy R.T., Rebec G.V. Up-regulation of GLT1 expression increases glutamate uptake and attenuates the Huntington's disease phenotype in the R6/2 mouse. Neuroscience. 2008;153:329–337. doi: 10.1016/j.neuroscience.2008.02.004. doi:10.1016/j.neuroscience.2008.02.004. [DOI] [PMC free article] [PubMed] [Google Scholar]
- 46.Brown B.D., Gentner B., Cantore A., Colleoni S., Amendola M., Zingale A., Baccarini A., Lazzari G., Galli C., Naldini L. Endogenous microRNA can be broadly exploited to regulate transgene expression according to tissue, lineage and differentiation state. Nat. Biotechnol. 2007;25:1457–1467. doi: 10.1038/nbt1372. doi:10.1038/nbt1372. [DOI] [PubMed] [Google Scholar]
- 47.Hottinger A.F., Azzouz M., Deglon N., Aebischer P., Zurn A.D. Complete and long-term rescue of lesioned adult motoneurons by lentiviral-mediated expression of glial cell line-derived neurotrophic factor in the facial nucleus. J. Neurosci. 2000;20:5587–5593. doi: 10.1523/JNEUROSCI.20-15-05587.2000. [DOI] [PMC free article] [PubMed] [Google Scholar]
- 48.Bushong E.A., Martone M.E., Jones Y.Z., Ellisman M.H. Protoplasmic astrocytes in CA1 stratum radiatum occupy separate anatomical domains. J. Neurosci. 2002;22:183–192. doi: 10.1523/JNEUROSCI.22-01-00183.2002. [DOI] [PMC free article] [PubMed] [Google Scholar]
- 49.Dunlop J., Beal McIlvain H., She Y., Howland D.S. Impaired spinal cord glutamate transport capacity and reduced sensitivity to riluzole in a transgenic superoxide dismutase mutant rat model of amyotrophic lateral sclerosis. J. Neurosci. 2003;23:1688–1696. doi: 10.1523/JNEUROSCI.23-05-01688.2003. [DOI] [PMC free article] [PubMed] [Google Scholar]
- 50.Holbert S., Dedeoglu A., Humbert S., Saudou F., Ferrante R.J., Neri C. Cdc42-interacting protein 4 binds to huntingtin: neuropathologic and biological evidence for a role in Huntington's disease. Proc. Natl Acad. Sci. USA. 2003;100:2712–2717. doi: 10.1073/pnas.0437967100. doi:10.1073/pnas.0437967100. [DOI] [PMC free article] [PubMed] [Google Scholar]
- 51.Zar J. Biostatistical Analysis. New Jersey: Prentice-Hall; 1984. [Google Scholar]


