Abstract
L-β-methylamino-alanine (BMAA) has been proposed as a worldwide contributor to neurodegenerative diseases, including Parkinson-dementia complex (PDC) of Guam and Alzheimer’s disease (AD). Recent conflicting reports of the presence of this amino acid in human brain from patients affected by these diseases have made it necessary to develop methods that provide unambiguous detection in complex samples. Comprehensive two-dimensional gas chromatography coupled with time-of-flight-mass-spectrometry analysis (GC × GC-TOFMS) followed by a targeted Parallel Factor Analysis (PARAFAC) deconvolution method has been used recently in metabolomic investigations to separate, identify, and quantify components of complex biological specimens. We have extended and applied this methodology to the toxicological problem of detecting BMAA in extracts of brain tissue. Our results show that BMAA can be isolated from closely eluting compounds and detected in trace amounts in extracts of brain tissue spiked with low levels of this analyte, ranging from 2.5 ppb to 50 ppb, with a limit of detection (LOD) of 0.7 ppb. This new method was sufficiently sensitive to detect BMAA in cerebral extracts of mice fed BMAA. This optimized approach was then applied to analyze tissue from humans; however, no BMAA was detected in the brain extracts from controls or patients with PDC or AD. Our results demonstrate the application of multidimensional chromatography-mass spectrometry methods and computational deconvolution analysis to the problem of detecting trace amounts of a potential toxin in brain extracts from mice and humans.
Keywords: L-β-methylamino-alanine (BMAA), Parkinson’s Disease, Guam, cycad toxins
1. Introduction
Amyotrophic lateral sclerosis and Parkinson dementia complex (ALS/PDC) are a unique combination of diseases that were described in the early 1950’s on the island of Guam. ALS/PDC has been the focus of intense investigation because it shares features that are characteristic of other neurodegenerative diseases that occur commonly but separately throughout the world: ALS, Parkinson’s disease (PD), and Alzheimer’s disease (AD). Despite these efforts, ALS/PDC continues to defy explanation and is now thought to derive from the interaction of poorly defined genetic susceptibilities and some environmental exposure(s) [1]. While rates of ALS have declined among the native Guamanian population, and are now at levels comparable to the rest of the world [2], however PDC still remains a significant health problem [3,4]. Investigations that help identify possible contributors to this disease are important not only to the Chamorro population on Guam but have the potential to help elucidate contributing causes to neurodegenerative diseases worldwide.
One compound that has gained the most attention as a potential environmental contributor to ALS/PDC is L-β-methylamino-alanine (BMAA), which was first was discovered in 1967 by Arthur Bell [5] and isolated from the seeds of cycads [6]. BMAA is a non-proteogenic amino acid present in cycad plants, and is hypothesized to accumulate in this plant through a symbiotic relationship between cycad roots and cyanobacteria [7,8]. While Bell and colleagues showed the BMAA administration produced neurotoxic effects in chicks, the symptoms resulting from BMAA exposure were acute, and did not fit the model of a progressive, delayed-onset neurodegenerative disease. Further studies showed that administration of BMAA to other species did not produce neurotoxic effects or disease progression consistent with ALS/PDC [9]. Thus, although no exact animal model of ALS or PDC has been created through feeding primates or rodents BMAA [9,10], there remains speculation that BMAA may in fact be central to these unusual diseases found on Guam, as well as other more common neurological disorders. BMAA has been identified in cycad flour, a dietary staple for the Chamorro population, however levels of BMAA in this food source are low, and proposed toxicity through this source is questionable [11]. The postulated route of ingestion has been proposed to be through bioamplification in bats that inhabit Guam, and through cyanobacteria present around the world [7,12]. Some have reported identification of BMAA in human brain tissue, not only from individuals from Guam with PDC, but also in the brain of patients who died of AD in western Canada [13,14]. However, these results have not been replicated in other studies of optimally preserved human brain regions from Guamanians with PDC, patients with AD from western U.S.A., or their respective clinical controls by either fluorescent HPLC [15] or a novel stable isotope dilution assay using gas chromatography (GC)-mass spectrometry (MS) with selected ion monitoring [16]. Furthermore, several other groups have not been able to detect BMAA in human samples [17,18], or even detect BMAA in certain cyanobacteria using sophisticated analytical methods [18,19]. Interestingly, these results bring up an important point: the possibility that BMAA has been misidentified in samples because of its similarity to other amino acids, in particular, 2,3-diaminobutyric acid [19]. In addition, recent results from animal models suggest that the toxin contributing to ALS/PDC might indeed come from cycads, but may not be BMAA [20,21].
In an effort to shed some light on some of these conflicting findings, we developed a new sensitive method for analysis of brain samples. Although GC/MS provides high sensitivity for analysis, separation often is not ideally achieved in more complex mixtures. Multi-dimensional chromatography methods used in tandem with mass spectrometry, in particular comprehensive two-dimensional gas chromatography coupled with time-of-flight-mass-spectrometry analysis (GC × GC-TOFMS), have been developed to address this issue [22–30]. When coupled to computational deconvolution analysis this technique becomes a powerful tool for identifying and quantifying trace analytes in complex mixtures [3–36]. Indeed, the benefits of GC × GC-TOFMS are increased sensitivity and increased specificity to separate the target analyte from interfering compounds. Two-dimensional separation of complex mixtures can be achieved by employing a long non-polar column in the first dimension and a second shorter polar column for the second dimension of separation. The result is a two dimensional plot of analytes mapped out in the separation space. Representative separations for this report are shown in Fig. 1, for both mouse and human cerebrum samples. The use of a TOFMS provides mass spectra and gives the third dimension of data. In the present study, data analysis was performed using PARAFAC, whereby the PARAFAC algorithm was incorporated into an in-house developed software package. Utilization of PARAFAC addresses the potential problem of overlapping peaks at low signal-to-noise ratio (S/N). The PARAFAC algorithm is based on a partial least squares method [31] and mathematically resolves the analyte of interest from closely eluting and/or overlapped interferent peaks. Using these tools we developed a new method to address the problem of identification and quantification of BMAA in complex human samples. We optimized this method by analyzing brain samples that had been spiked with known levels of BMAA, i.e., applied the standard addition method. We then used this optimized approach to identify and quantify BMAA in brain extracts from mice exposed to BMAA in their food for one month [10]. Finally, we employed this new method to investigate extracts of human brain from Guam and the United States.
Figure 1.
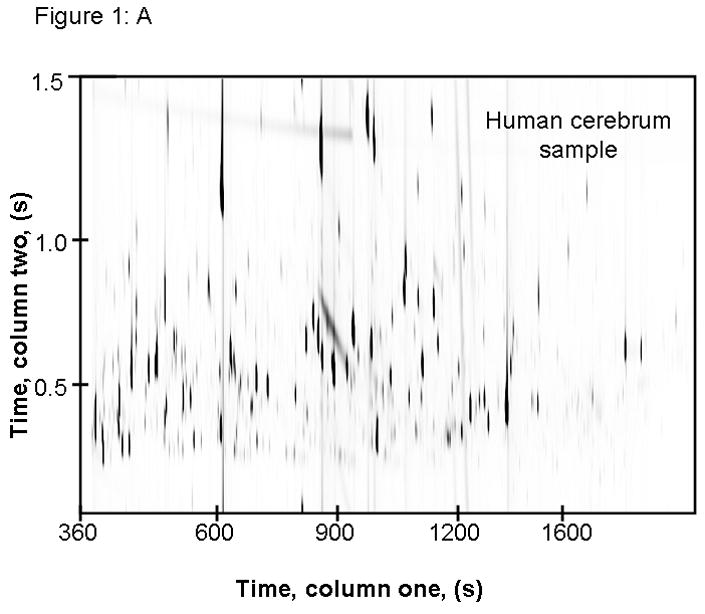
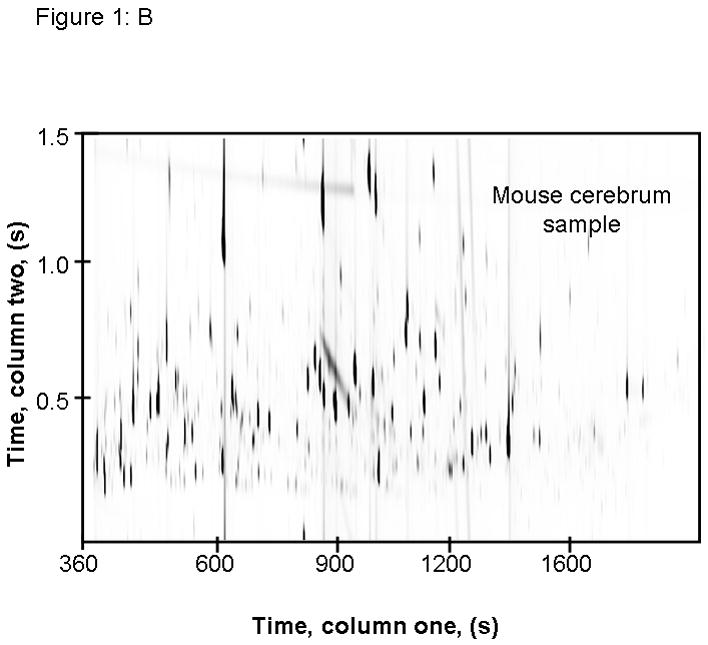
This image shows raw GC × GC-TOFMS data of m/z 73 from extracted cerebrum samples from (A) human and (B) mouse. These data demonstrate the importance of comprehensive separation, as resolution of co-eluting compounds can be achieved by two dimensional chromatography.
2. Experimental
2.1 Experimental Design
We made standard samples of BMAA spiked into brain at low concentrations, not previously detectable using our stable isotope dilution GC/MS assay [16]. Following analysis of these standards, this method was used to study cerebrum obtained from mice that were fed either a control diet or a diet including BMAA at a dose of 28 mg/kg body weight, levels that would mimic proposed environmental levels. Physiologic studies of these mice showed that there were no detectable behavioral differences between animals fed a control diet or the BMAA-containing diet [10]. Upon the completion of the behavioral studies, these mice were sacrificed, and cerebrum was flash frozen until analysis. Liver samples from these mice were analyzed previously using our stable isotope dilution GC/MS assay and BMAA was readily detectable in those liver samples only from mice fed BMAA but none of the mice fed control diet; we were unable to detect BMAA in cerebrum of mice fed BMAA [16].
2.2 GCxGC-TOF-MS Parameters and Sample Preparation
2.2.1 Chemicals and Reagents
For GC × GC-TOFMS sample preparation, derivatization chemistry was applied to make the samples amenable to gas phase analysis. Reagent grade pyridine was purchased from Sigma Aldrich, St Louis, MO. The trimethylsilation reagent (TMS) [N, O-bis(trimethylsilyl)trifluoroacetamide (BSTFA) + trimethylchlorosilane (TMCS)], 99:1) and methoxyamine hydrochloride were both obtained from Sigma Aldrich, St. Louis, MO. Millipore (Millipore Corp, Bedford, MA, USA) purified water was used in the preparation of 1 M hydrochloric acid, used for tissue extractions.
2.2.2 Tissue Sample Preparation
Mouse brain and human brain tissue samples were extracted as described previously [16]. Briefly, thawed brain samples were subjected to extraction 1 M HCl and ultrasonically disrupted. Samples were centrifuged at 25,000 g for 20 min and a repeat extraction was performed on the remaining pellet. The supernatant was then subjected to extraction with chloroform and then the aqueous portion was saved and stored at −80 ºC. Approximately 100 μl of extract was transferred into glass GC vial inserts and evaporated to dryness. Samples for GC × GC-TOFMS analysis were prepared using the standard protocol developed in-house [33–36].
2.2.3 Derivatization Protocol
Methoxylamine hydrochloride (Sigma Aldrich, St. Louis MO) was dissolved in pyridine (reagent grade, Sigma Aldrich) at a concentration of 20 mg/ml. Using a Hamilton syringe, 30 μl of this reagent was added to the dried-down samples. After the methoximation reagent was added to the samples, they were placed in an oven for 90 min at 30 ºC. Following this step, samples are derivatized using TMS and then incubated for 60 min at 60 ºC. Samples are run on the GC × GC-TOFMS within 24 h of derivatization.
2.2.4 Instrument Information and Conditions
GC × GC-TOFMS analyses were performed using a LECO Pegasus III time-of-flight mass spectrometer with the 4D upgrade (LECO Corp., St. Joseph, MI, USA). The first dimension column (column 1) was a 20 m Rtx-5 capillary column with an internal diameter of 250 μm and a film thickness of 0.5 μm, and the second dimension column (column 2) was a 2 m Rtx-200 with a 180 μm internal diameter and 0.2 μm film thickness (both columns from Restek, Bellefonte, PA, USA). The two columns were joined by a cryogenic modulator with a modulation period of 1.5 s with a pulse time of 0.40 s. Ultra high purity helium was used as the carrier gas at constant flow mode of 1 ml/min. Samples injections of 1 μl were made in triplicate in split-less mode via an Agilent 7683 autosampler. The inlet temperature was set at 280 °C. The temperature program used for column 1 began at 60 °C with a hold time of 0.25 min, then increased at 8 °C/min to 280 °C with a hold time at 280 °C for 10 min. Column 2 was held in a separate oven which was initially set at 70 °C and followed the same temperature program as column 1. The electron impact (EI) ion source temperature was set to 250 °C. Mass spectra were collected from m/z 40 to 500 at 100 spectra/s with a 300 s solvent delay.
Data were collected with the LECO ChromaTOF software v 3.32 (LECO, St. Joseph, MI, USA). Standards of authentic BMAA were run and a Matlab-based non-targeted PARAFAC method was used to extract peak profiles and a deconvoluted mass spectrum, which was used as the library spectrum for subsequent data analysis, shown in Fig. 2. For this study, a target PARAFAC method was applied, and was developed in-house and has been used in several published metabolomics studies [31–35,37]. The target PARAFAC method deconvolutes overlapping peaks to isolate the target analyte for identification and quantification. The deconvoluted mass spectrum from the non-target method was then applied to a target PARAFAC program to create a search template for BMAA.
Figure 2.
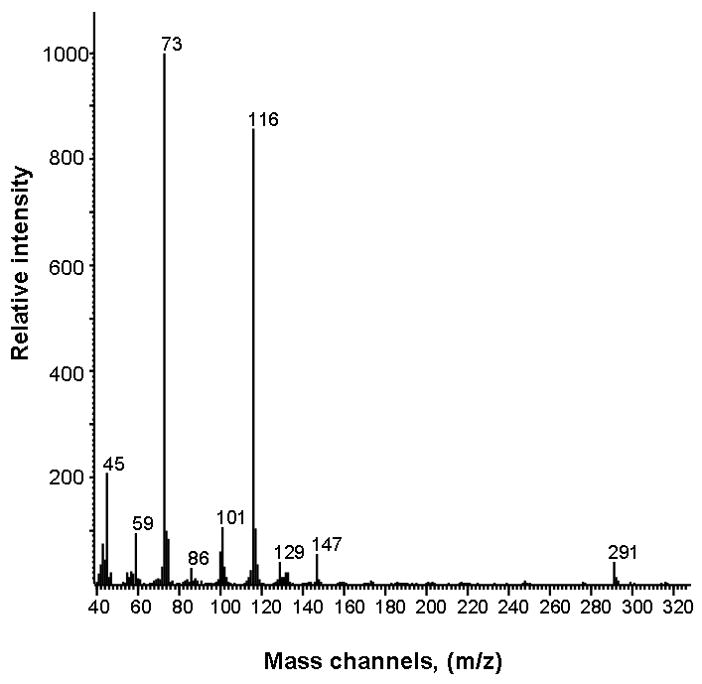
Electron impact ionization mass spectrum of derivatized BMAA.
2.3 Calibration Curve Sample Preparation
Calibration standards were run to examine the limit of detection (LOD) for BMAA spiked into human cerebral cortical extracts. Tissue samples were extracted as described above and BMAA was added to achieve final concentrations ranging from 2.5 ppb to 50 ppb (ng/mL), plus a matrix blank. The resulting calibration data is summarized in Fig. 3. The lower three standards, display the exquisite sensitivity of this method, and are at concentrations that are not within the dynamic range of the previously published stable isotope dilution GC-MS assay [16]. Standards of BMAA were run without brain matrix to determine retention times following sample runs. Reagent blanks were run to verify there was no carryover in any samples. Fragmentation patterns of BMAA were determined using this new mass spectral analysis and, in order to optimize the sensitivity and selectivity of the method, the top 15 most abundant mass channels at or above an m/z of 100 were selected to perform PARAFAC searches. The mass channels included in this analysis were: m/z 100, 101, 102, 103, 114, 115, 116, 117, 118, 129, 131, 132, 133, 291, and 292. Mass channels 73 and 147 were excluded from this template because although they can be associated with metabolites of interest, they can also be non-specific fragments due to reagent artifacts.
Figure 3.
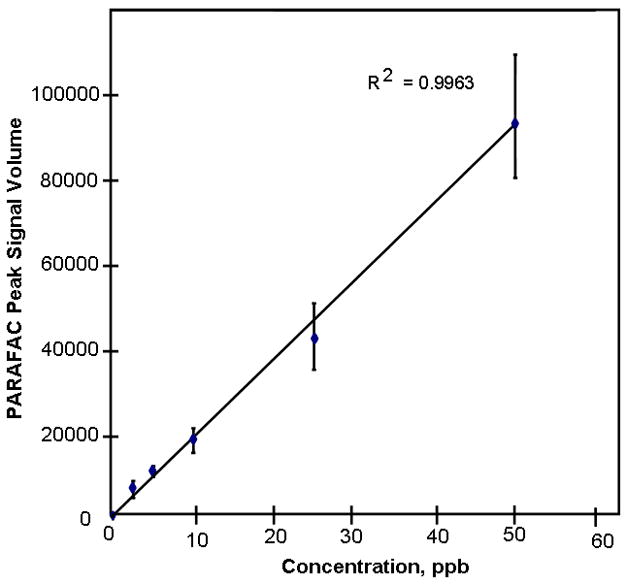
Calibration curve obtained by standard addition method of spiking L-beta methylamino alanine (BMAA) into human cerebrum extracts.
2.4 PARAFAC Analysis and Template Development
PARAFAC template development was done as described in prior reports [31,32], with the number of factors chosen so that splitting (i.e., over fitting of the data) did not occur [31]. In previous reports, mass spectral match values for a positive identification can range from 800 to 900. For this analysis a selected library mass spectrum, comprised of 15 mass channels specific to BMAA, was used to identify BMAA in samples. Since a subset of all mass channels were used for the match value calculations, then an acceptable match value has been shown to be reduced [28, 29]. Therefore, for positive BMAA identification, we relied on match values against the selected spectrum that were less than 700 in some cases as a positive match (combined with positive retention time matching in both separation dimensions). Additionally, the PARAFAC deconvoluted mass spectrum matched the selected library spectrum for all positive identifications. This unique analysis allowed us to search for BMAA at lower levels than previously reported, since greater emphasis was given to the analyte of interest, and interfering signals from noise were more efficiently ignored. When a full mass spectrum was used in PARAFAC analysis, the lowest point on the calibration curve was 25 ppb, and by simply focusing on mass channels sensitive to and selective for the mass spectrum produced by BMAA, we were able to positively isolate peaks in the 2.5 to 50 ppb range.
3. Results and Discussion
3.1 Calibration Curve and Limit of Detection
To determine the dynamic range and LOD of this assay, a calibration curve was created that spanned from 2.5 ppb to 50 ppb in human brain extract (Fig. 3). Linear regression curves were generated by plotting PARAFAC peak signal volumes against concentration. Match values were also plotted against concentration, showing that as concentration increased, so did the mass spectral match value, until a limit of 650 was reached. A positive identification of the analyte of interest (BMAA) can be obtained by analyzing the extracted mass spectrum and retention times of the peak identified using PARAFAC. The limit of detection (LOD) was determined by taking the signal for each of 6 matrix blanks used for our calibration curve and calculating the standard deviation (580, in this case) and multiplying by 3 to obtain 1.7 × 10³. Based on the average signal of 6000 for 6 replicates of 2.5 ppb spiked brain matrix, we calculated the LOD for this assay to be 0.7 ppb. In contrast, using commercial software analysis only allowed us to quantify and identify BMAA at levels of 25 ppb and above. When the commercial software was applied to mouse and human cerebrum samples, BMAA was not identified. This difference underscores the importance of using the powerful PARAFAC deconvolution software using the procedure described above. As previously mentioned, using 15 mass channels specific to BMAA also allowed us to lower our limits of detection by excluding non-specific reagent artifact signals and baseline noise.
3.2 Match Value Results and Analysis
Match values increased with increasing concentration of BMAA in brain extract when using 15 mass channels as presented in Fig. 4. As concentration increased, so did the match value, until an optimal limit of ~ 650 was reached. We were able to confirm analyte identity by comparing the mass spectral data from the peak in question to the library spectrum used by PARAFAC. Hence, match values were scaled back for this analysis, and several different dimensions of identification were studied to confirm peak identification, including using the two unique retention times for the first and second dimension of chromatographic separation, as demonstrated in Fig. 5A and 5B. The selected library spectrum of BMAA sufficiently matched the deconcoluted mass spectrum isolated by PARAFAC, as shown in Fig 5D. When a sample that did not contain BMAA was analyzed using the search template, the resulting output did not show an isolated peak with a matching mass spectrum as presented in Fig. 6.
Figure 4.
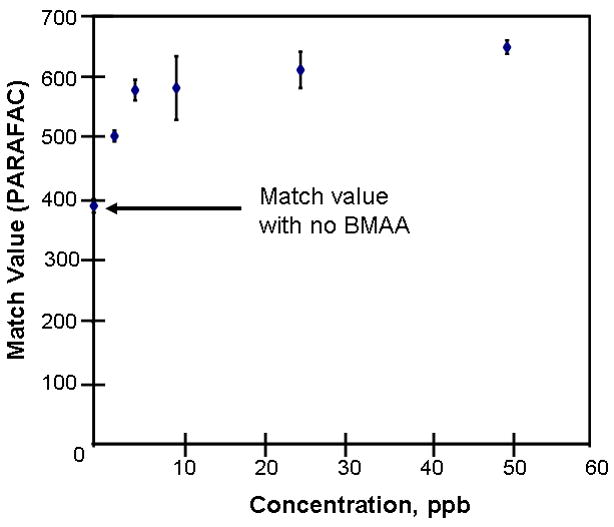
Mass spectral match values are observed to increase with concentration, until an optimal limit is reached.
Figure 5.
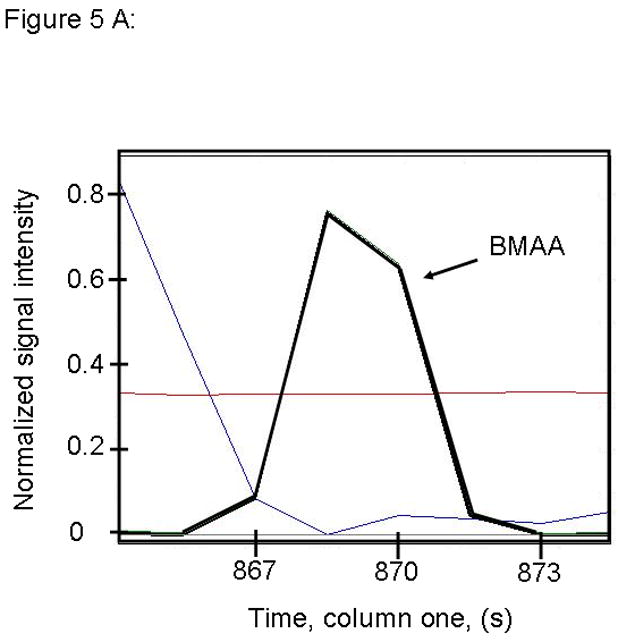
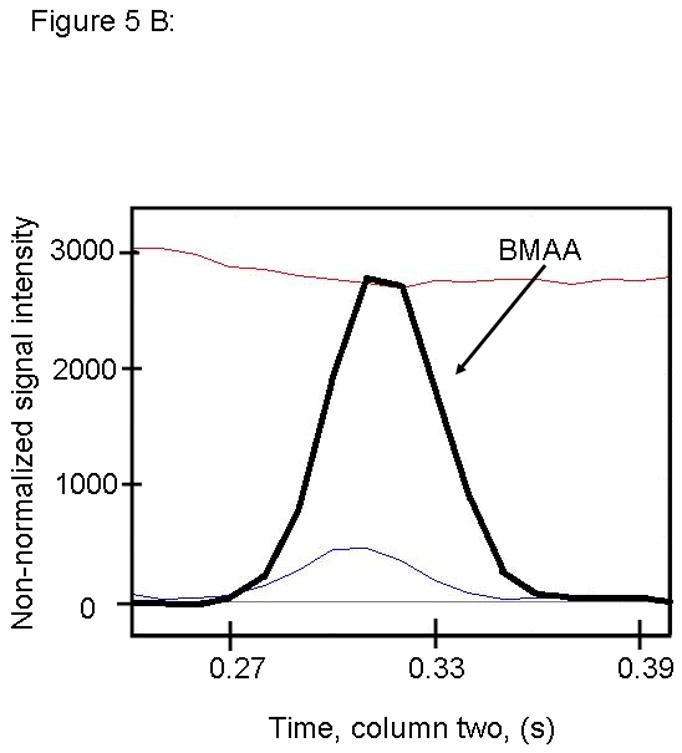
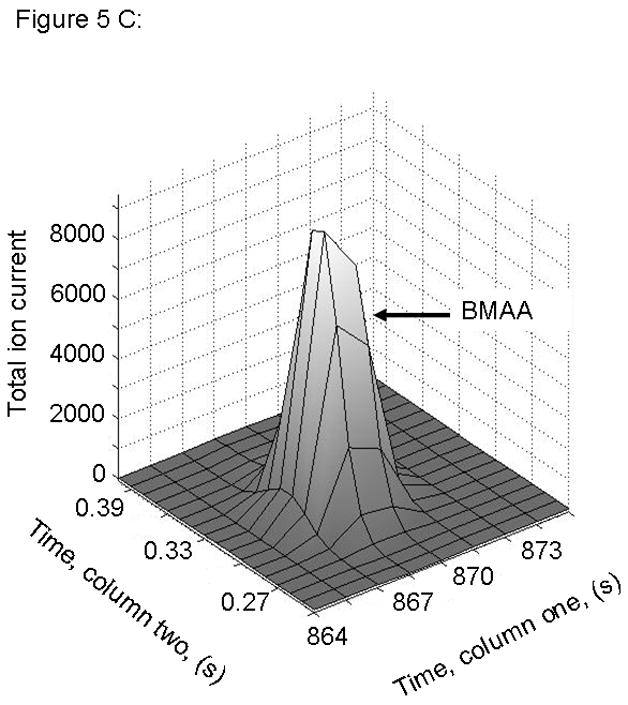
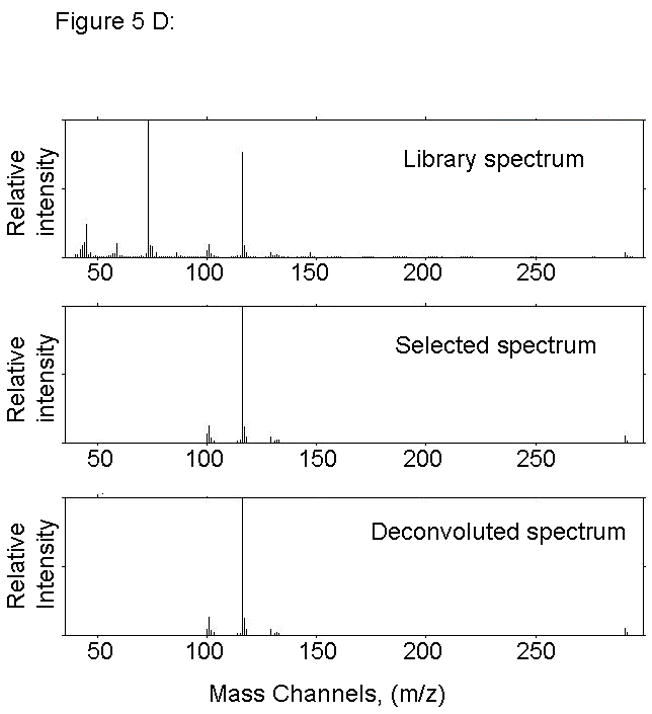
PARAFAC signal intensity for cerebrum standard containing BMAA that was added to the matrix in (A) Column one retention time window, and (B) Column two retention time window. (C) PARAFAC reconstructed total ion current (TIC) signal showing identified BMAA peak. (D) Mass spectral data from PARAFAC showing library template matching the deconvoluted BMAA peak. Non-bold lines in panels (A) and (B) indicate loadings (i.e., deconvoluted responses) that are due to noise, baseline, or other analytes. See ref [32].
Figure 6.
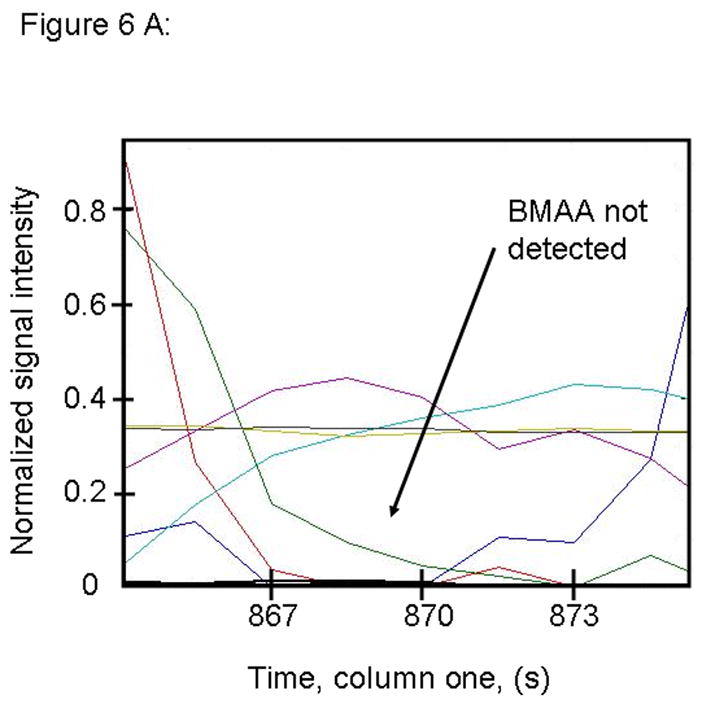
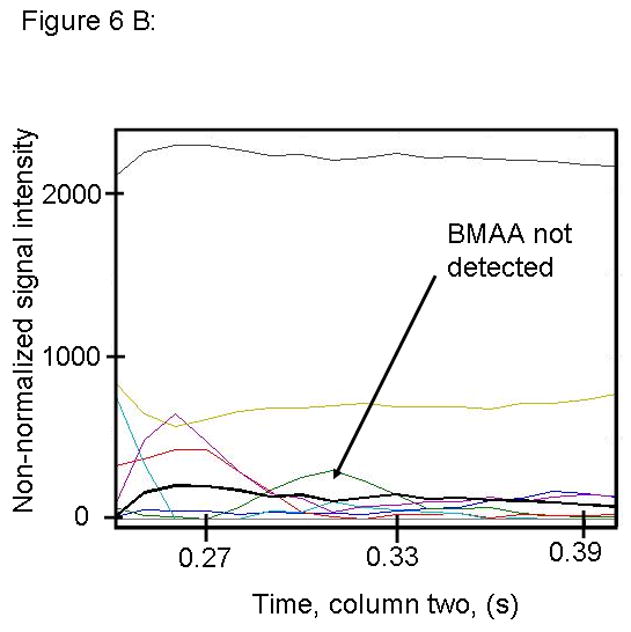
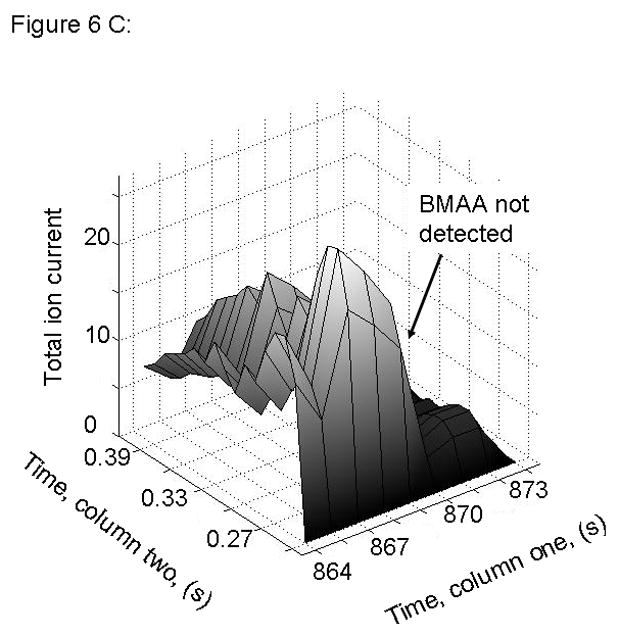
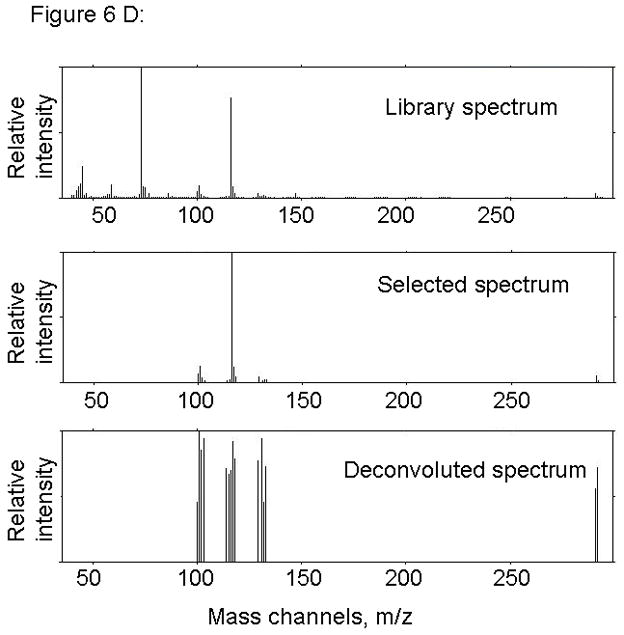
PARAFAC signal intensity for cerebrum standard that does not contain BMAA in (A) Column one retention time window, and (B) Column two retention time window. (C) PARAFAC reconstructed total ion current (TIC) showing lack of BMAA peak. (D) Mass spectral data from PARAFAC analysis shows that BMAA was not detected. Non-bold lines in panels (A) and (B) indicate loadings that are due to noise, baseline, or other analytes See ref [32].
3.3 Analysis of Mouse Cerebrum
We used our new method to analyze brain extracts from mice that had been exposed to BMAA in food for one month. We have previously reported on these mice using behavioral assessments and our stable isotope dilution assay for BMAA; the latter identified hepatic BMAA but failed to detect BMAA in brain.
The same template used in our calibration data was then applied to a mouse brain extract from the fed group. PARAFAC analysis of cerebrum from mice fed a BMAA-containing diet show a clearly isolated peak, in addition to a matching mass spectrum output, thereby identifying BMAA in trace amounts in cerebrum of mice fed BMAA, as seen in Fig. 7. Typical output from PARAFAC when no BMAA is detected is shown in Fig. 8. Although the match value of this isolated peak was less than the “standard” 700 [31] due to the particular subset of the full mass spectrum defined by the selected m/z (primarily because the non-selective base peak was not included in the subset), this identification fits with the proposed model, based on our calibration curve data, for a positive hit of BMAA in this sample. We discovered BMAA in mouse tissue exposed to the levels described above accumulates in the brain tissue in trace amounts, with results presented in Fig. 9. These data confirm the findings of others that BMAA does cross the blood brain barrier [38], although not efficiently. Using the peak signal volumes generated by PARAFAC and the calibration curves prepared from these data, we were able to quantify the relative amount of BMAA in brain tissue as ranging from 1 ppb to 6ppb (4.5 ng/g tissue to 98.0 ng/g tissue). Match values for each tissue type were compared, as shown in Fig. 10, which reveal that values for tissue from the BMAA fed group were higher compared to the control diet tissue, which fits with the findings of our standard addition data.
Figure 7.
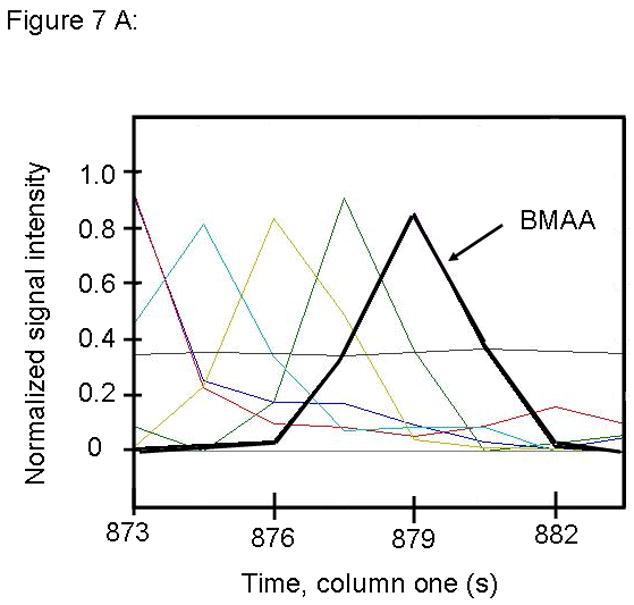
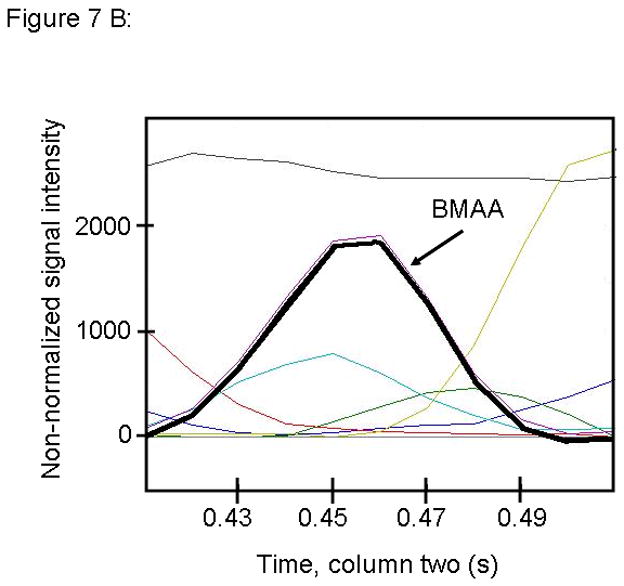
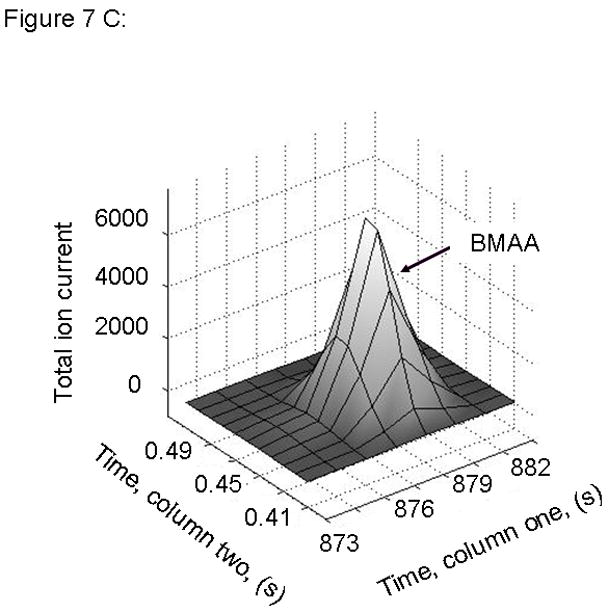
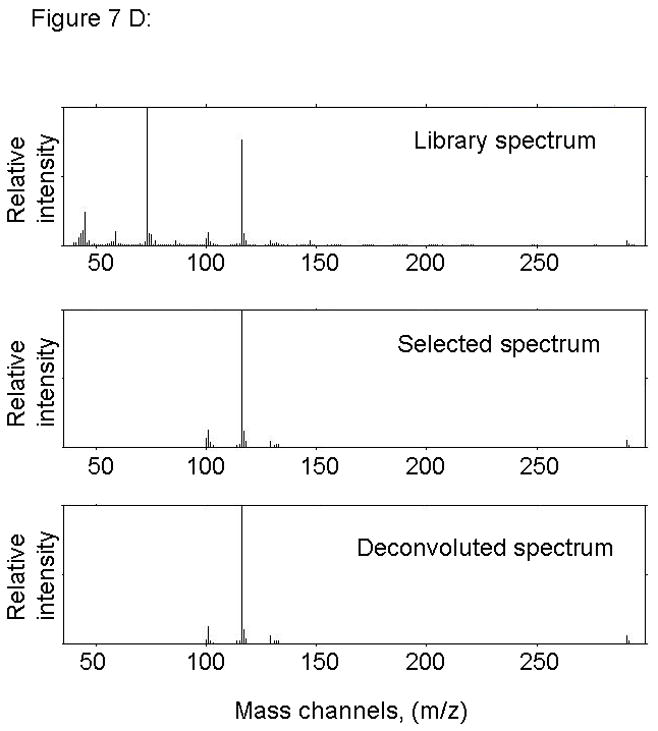
PARAFAC signal intensity from mouse cerebrum sample from the BMAA diet fed group in (A) Column one retention time window, and (B) Column two retention time window. (C) Total ion current showing identified BMAA peak. (D) Mass spectral data from PARAFAC for this sample show a matching mass spectrum for BMAA. Non-bold lines in panels (A) and (B) indicate loadings that are due to noise, baseline, or other analytes. See ref [32].
Figure 8.
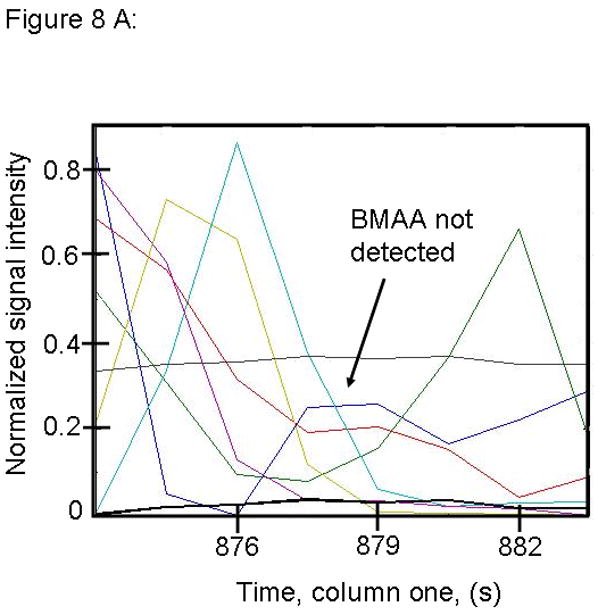
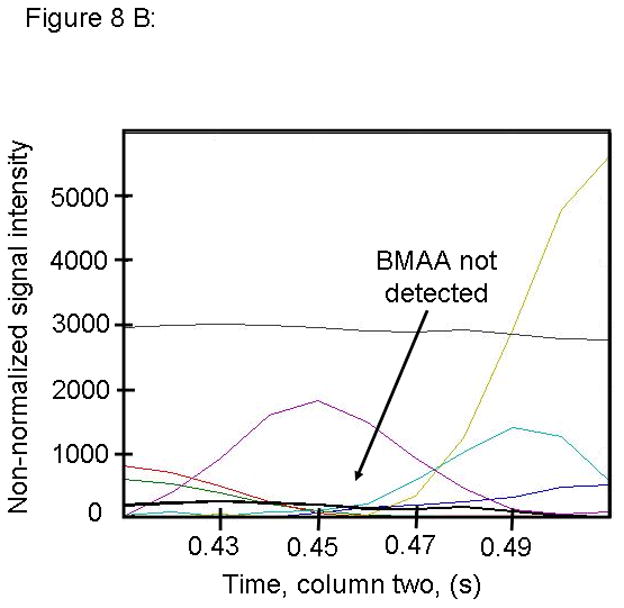
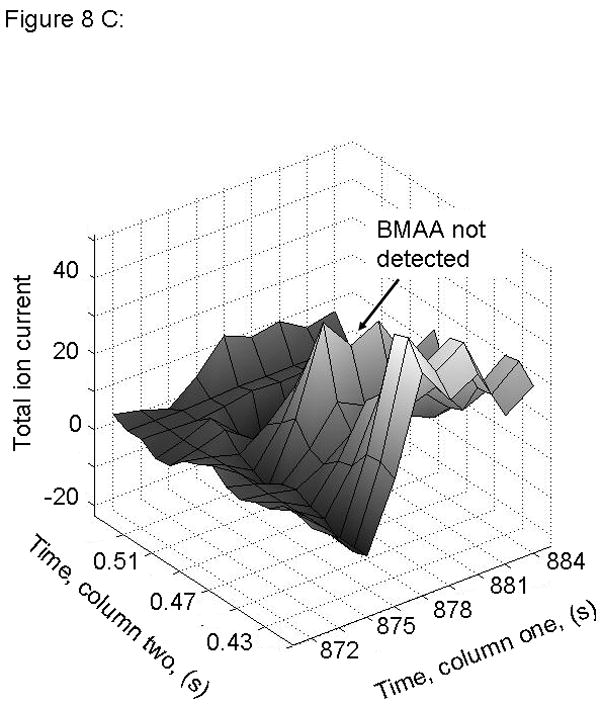
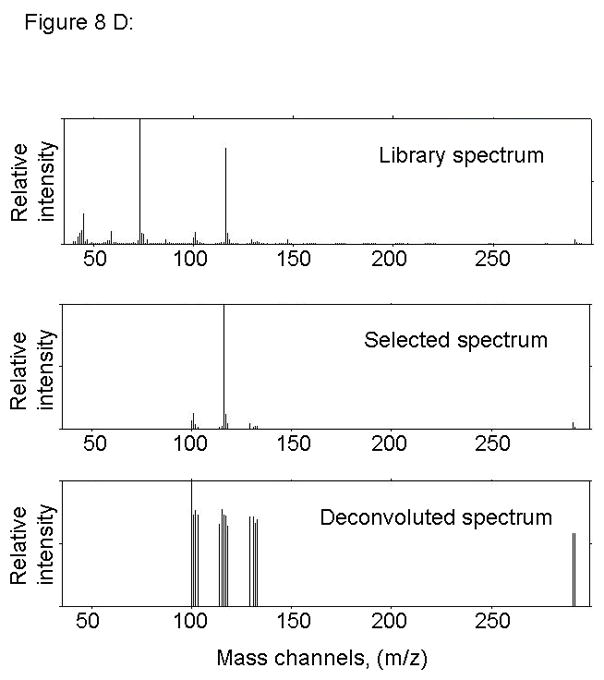
PARAFAC signal intensity from mouse cerebrum from control diet group in (A) Column one retention time window, and (B) Column two retention time window. (C) Total ion current showing lack of BMAA peak. (D) Mass spectral data from PARAFAC for this sample indicating that BMAA was not detected in this sample. Non-bold lines in panels (A) and (B) indicate loadings that are due to noise, baseline, or other analytes. See ref [32].
Figure 9.
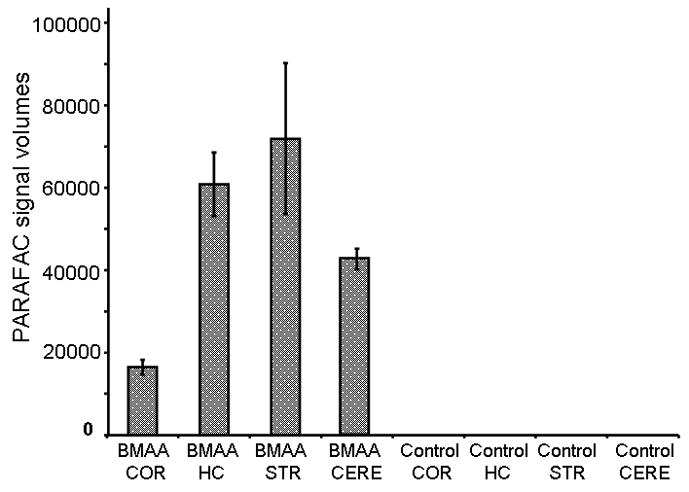
PARAFAC peak signal volumes for mouse brain samples for BMAA fed and Control diet fed mice. No BMAA was detected in any of the samples from mice fed a control diet. COR = Cortex, HC = Hippocampus, STR = Striatum, CERE = Cerebellum
Figure 10.
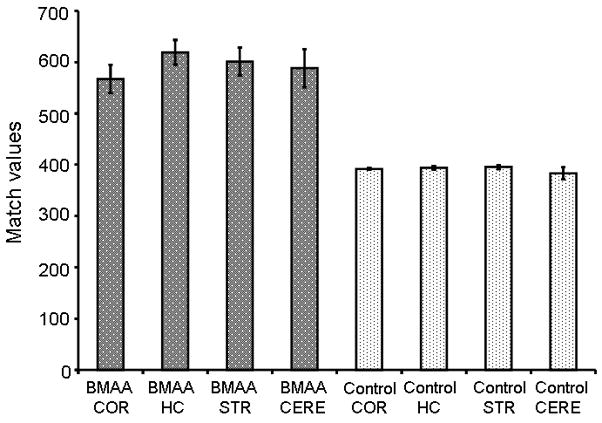
Match values (MV) from PARAFAC signal output on mouse brain samples from BMAA fed and Control diet. Match values for real samples follow the trend of spiked samples, showing MV of 500-650 for BMAA positive samples and less than 400 for samples where BMAA was not detectable. COR = Cortex, HC = Hippocampus, STR = Striatum, CERE = Cerebellum.
3.4 Application to Human Cerebrum
We next applied this method to human brain extracts to test the hypothesis of bioaccumulation of BMAA in human brain. We have previously described the clinical features of the tissue donated by adult volunteers from both Seattle and Guam [15,16]. Charting of several representative match values in Fig. 11 showed that both Guamanian control and PDC groups. In both cases, PARAFAC analysis did not reveal a peak that matched the mass spectrum or retention times of BMAA standards. This data is shown in Fig. 12. BMAA spiked into a Guamanian PDC brain extract was detectable at low levels, but not detected in the same sample that was not spiked with BMAA. Finally, we analyzed human brain extracts from AD patients and controls from the Seattle area. We have reported previously on the clinical features of these subjects [15,16]. No detectable BMAA was found in any of these human from Guam or Seattle samples using the method applied herein in this report.
Figure 11.
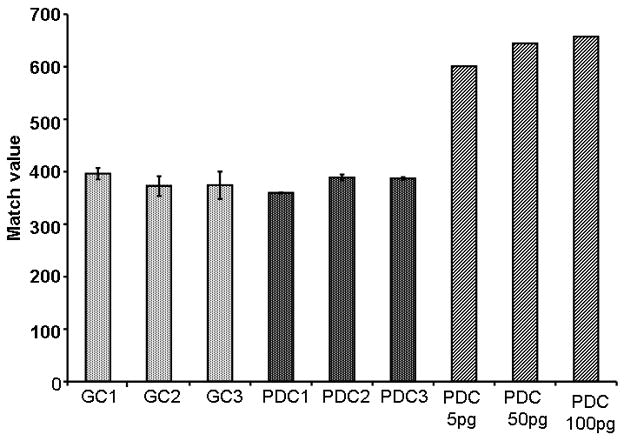
Match values from a representative group of samples. Both Guamanian Control and Parkinson Dementia Complex (PDC) tissues were used in this study. Analysis of both groups reveal that BMAA is not at any detectable levels using this method. Low levels of BMAA (5 pg, 50 pg, and 100 pg) are spiked into PDC tissue, the match value PARAFAC output from the analysis increases. (GC = Guamanian Control Sample, PDC = Parkinson Dementia Complex Sample)
Figure 12.
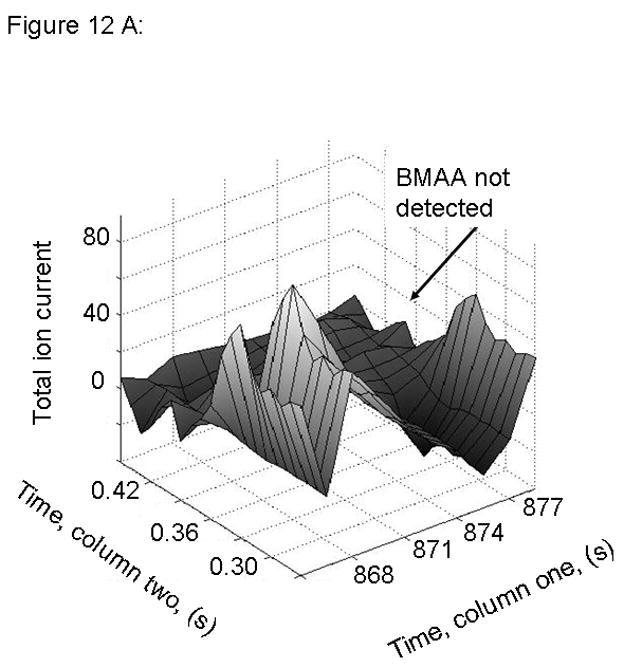
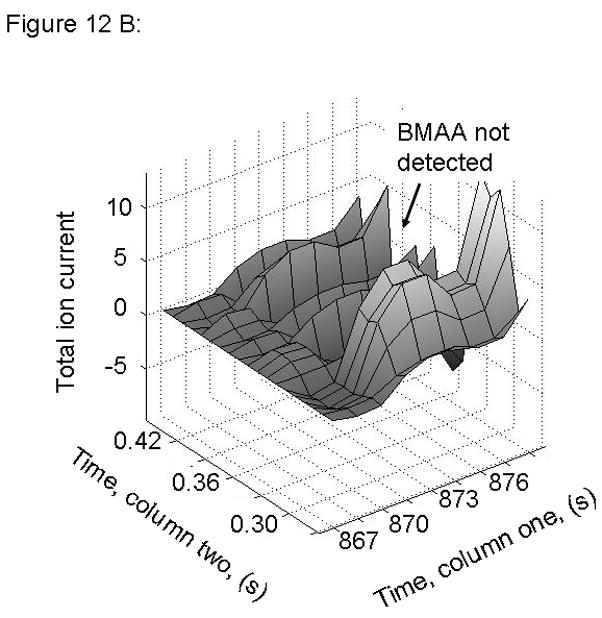
PARAFAC signal intensity from human cerebrum sample from Guamanian samples (A) Total ion current showing lack of BMAA peak for PDC affected sample and (B) Total ion current showing lack of BMAA peak for PDC Control sample.
4. Conclusions
Interestingly, a compound that co-eluted with BMAA in the first chromatographic dimension was identified in all human samples; however, the compound(s) comprising this peak did not co-elute with BMAA in the second chromatographic dimension. Importantly, the mass spectral data for this compound that co-eluted with BMAA in the first chromatographic dimension did not match the BMAA standards in all 15 mass channels. Thus, we concluded that there is a compound that can co-elute with BMAA with single dimension chromatographic separation that shares some key mass fragments, including m/z 116, but not all ion fragments with BMAA, as seen in Fig. 13 in relation to Fig. 2. While we are unclear on the identity of this compound, it may be contributing to conflicting data surrounding identification of BMAA in complex samples, and raises caution about interpreting data from methods that use single dimension chromatographic separation and limited mass spectral analysis. In summary of the results obtained, our multidimensional chromatographic method was able to separate all interfering peaks from standard BMAA spiked into human brain extracts. BMAA was detected by our new method in cerebrum of mice fed BMAA for one month. In contrast, no BMAA was detected by this method in human brain cerebral cortical extracts from patients or controls from Guam or the Seattle area.
Figure 13.
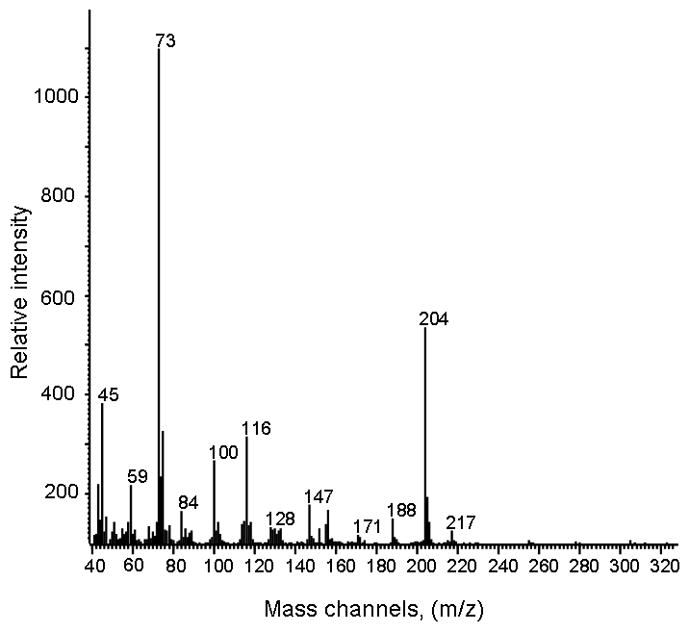
Electron impact ionization mass spectrum of derivatized chromatographically overlapping compound, showing distinct differences from BMAA (Figure 2 for comparison).
The objective of this study was to adapt a well-established state-of-the-art multidimensional separations method to the current toxicological problem of detecting trace amounts of BMAA in brain extracts. Our approach for sample preparation and data analysis has been verified in numerous reports studying small organic molecules and metabolomics [33–36].
The use of multidimensional chromatography combined with deconvolution software has several advantages, namely the ability to not only identify trace amount of BMAA in a complex matrix, but also isolate signals from co-eluting compounds. This is distinctly important, as animal tissue samples are extremely complex and the potential for one or more co-eluting compounds is high. We have identified several closely eluting compounds including a compound that co-elutes with BMAA in the first chromatographic dimension but not the second. While developing our PARAFAC template, we noticed that several mass channels specific to BMAA also are shared with this co-eluting peak. We further optimized the search to include 15 unique mass channels, and did additional experiments to demonstrate clearly that this peak is not BMAA, as shown in the mass spectral fragmentation patterns for derivatized BMAA and the co-eluting compound. Additionally, the EI mass spectrum of this second compound has numerous differences from BMAA.
We have shown that GC × GC-TOFMS is an effective method for analyzing brain tissue extracts and has greater sensitivity for BMAA than our previously published stable isotope dilution GC/MS assay. The combination of multidimensional chromatography coupled to chemometric software is a powerful tool not only for metabolomics, but also now for detection of trace analytes in a complex matrix. This analysis method was developed and optimized to study low levels of BMAA in tissue extracts and consistently identified BMAA in trace amounts that were previously undetectable in standard assays. BMAA was not found as a free amino acid in any of the human brain samples analyzed, consistent with our previous findings with less sensitive and specific assays. BMAA was consistently identified in brain extracts from mice exposed to BMAA in their diet but in none of the mice from the control diet group. Additionally, we observed structurally similar compounds that may confound less robust chromatographic and mass spectral approaches to quantifying BMAA in brain extracts. While LC/MS/MS methods could be used to detect BMAA, such a method emphasizes mass spectral selectivity to verify analyte identity. One dimensional LC may not provide adequate chromatographic separation selectivity, and the subsequent mass spectral analysis may give a false positive result if two co-eluting peaks are present. In contrast, the GC × GC-TOFMS method employed herein provides two retention times, coupled with the mass spectrum, to more confidently provide analyte identification.
Furthermore, we were able to show that our in-house deconvolution software was able to provide this analysis with a lower limit of detection, compared to commercially available software products. Although more work must be done to determine the role, if any, of BMAA in neurodegenerative disease, this method is an important advance in trace analyte studies, and in future toxicology studies on the metabolism of BMAA in organisms.
Acknowledgments
This work was supported by grants from the NIH (AG05136, AG029808, and NS62684) and the Nancy and Buster Alvord Endowment. We very gratefully acknowledge Dr. Douglas Galasko, Dr. Christopher A. Shaw, Dr. Reyniel Cruz-Aguado, and Dominica Kwok for tissue donations to this study. LRS would like to thank all of the lab members of the Synovec Research Group, for their insight, helpful suggestions, and instruction.
Footnotes
Publisher's Disclaimer: This is a PDF file of an unedited manuscript that has been accepted for publication. As a service to our customers we are providing this early version of the manuscript. The manuscript will undergo copyediting, typesetting, and review of the resulting proof before it is published in its final citable form. Please note that during the production process errors may be discovered which could affect the content, and all legal disclaimers that apply to the journal pertain.
References
- 1.Morris HR, Steele JC, Crook R, Wavrant-De Vrieze F, Onstead-Cardinale L, Gwinn-Hardy K, Wood NW, Farrer M, Lees AJ, McGeer PL, Siddique T, Hardy J, Perez-Tur J. Arch Neurol. 2004;61:1889. doi: 10.1001/archneur.61.12.1889. [DOI] [PubMed] [Google Scholar]
- 2.Plato CC, Galasko D, Garruto RM, Plato M, Gamst A, Craig UK, Torres JM, Wiederholt W. Neurology. 2002;58:765. doi: 10.1212/wnl.58.5.765. [DOI] [PubMed] [Google Scholar]
- 3.Galasko D, Salmon DP, Craig UK, Thal LJ, Schellenberg G, Wiederholt W. Neurology. 2002;58:90. doi: 10.1212/wnl.58.1.90. [DOI] [PubMed] [Google Scholar]
- 4.Waring SC. School of Public Health. University of Texas Health Science Center; Houston: 1994. [Google Scholar]
- 5.Vega A, Bell EA. Phytochemistry. 1967;6:759. [Google Scholar]
- 6.Vega A, Bell EA, Nunn PB. Phytochemistry. 1968;7:1885. [Google Scholar]
- 7.Cox PA, Banack SA, Murch SJ, Rasmussen U, Tien G, Bidigare RR, Metcalf JS, Morrison LF, Codd GA, Bergman B. Proc Natl Acad Sci USA. 2005;102:5074. doi: 10.1073/pnas.0501526102. [DOI] [PMC free article] [PubMed] [Google Scholar]
- 8.Cox PA, Richer R, Metcalf JS, Banack SA, Codd GA, Bradley WG. Amyotroph Lateral Scler. 2009;10(Suppl 2):109. doi: 10.3109/17482960903286066. [DOI] [PubMed] [Google Scholar]
- 9.Karamyan VT, Speth RC. Life Sci. 2008;82:233. doi: 10.1016/j.lfs.2007.11.020. [DOI] [PubMed] [Google Scholar]
- 10.Cruz-Aguado R, Winkler D, Shaw CA. Pharmacol Biochem Behav. 2006;84:294. doi: 10.1016/j.pbb.2006.05.012. [DOI] [PubMed] [Google Scholar]
- 11.Duncan MW, Steele JC, Kopin IJ, Markey SP. Neurology. 1990;40:767. doi: 10.1212/wnl.40.5.767. [DOI] [PubMed] [Google Scholar]
- 12.Cox PA, Sacks OW. Neurology. 2002;58:956. doi: 10.1212/wnl.58.6.956. [DOI] [PubMed] [Google Scholar]
- 13.Murch SJ, Cox PA, Banack SA. Proc Natl Acad Sci USA. 2004;101:12228. doi: 10.1073/pnas.0404926101. [DOI] [PMC free article] [PubMed] [Google Scholar]
- 14.Pablo J, Banack SA, Cox PA, Johnson TE, Papapetropoulos S, Bradley WG, Buck A, Mash DC. Acta Neurol Scand. 2009;120:216. doi: 10.1111/j.1600-0404.2008.01150.x. [DOI] [PubMed] [Google Scholar]
- 15.Back SA, Luo NL, Mallinson RA, O’Malley JP, Wallen LD, Frei B, Morrow JD, Petito CK, Roberts CT, Murdoch GH, Montine TJ. Annals of Neurology. 2005;58:108. doi: 10.1002/ana.20530. [DOI] [PubMed] [Google Scholar]
- 16.Snyder LR, Cruz-Aguado R, Sadilek M, Galasko D, Shaw CA, Montine TJ. Toxicol Appl Pharmacol. 2009;240:180. doi: 10.1016/j.taap.2009.06.025. [DOI] [PMC free article] [PubMed] [Google Scholar]
- 17.Kushnir MM, Bergquist J. Eur J Mass Spectrom (Chichester, Eng) 2009;15:439. doi: 10.1255/ejms.984. [DOI] [PubMed] [Google Scholar]
- 18.Rosen J, Hellenas KE. Analyst. 2008;133:1785. doi: 10.1039/b809231a. [DOI] [PubMed] [Google Scholar]
- 19.Kruger T, Monch B, Oppenhauser S, Luckas B. Toxicon. 2009;55:547. doi: 10.1016/j.toxicon.2009.10.009. [DOI] [PubMed] [Google Scholar]
- 20.Tabata RC, Wilson JM, Ly P, Zwiegers P, Kwok D, Van Kampen JM, Cashman N, Shaw CA. Neuromolecular Med. 2008;10:24. doi: 10.1007/s12017-007-8020-z. [DOI] [PMC free article] [PubMed] [Google Scholar]
- 21.Khabazian I, Bains JS, Williams DE, Cheung J, Wilson JM, Pasqualotto BA, Pelech SL, Andersen RJ, Wang YT, Liu L, Nagai A, Kim SU, Craig UK, Shaw CA. J Neurochem. 2002;82:516. doi: 10.1046/j.1471-4159.2002.00976.x. [DOI] [PubMed] [Google Scholar]
- 22.Liu Z, Phillips JB. J Chromatogr Sci. 1991;29:227. [Google Scholar]
- 23.Adahchour M, van Stee LL, Beens J, Vreuls RJ, Batenburg MA, Brinkman UATh. J Chromatogr A. 2003;1019:157. doi: 10.1016/s0021-9673(03)01131-2. [DOI] [PubMed] [Google Scholar]
- 24.Beens J, Adahchour M, Vreuls RJ, van Altena K, Brinkman UATh. J Chromatogr A. 2001;919:127. doi: 10.1016/s0021-9673(01)00785-3. [DOI] [PubMed] [Google Scholar]
- 25.Bruckner CA, Prazen BJ, Synovec RE. Anal Chem. 1998;70:2796. [Google Scholar]
- 26.Dalluge J, van Rijn M, Beens J, Vreuls RJ, Brinkman UATh. J Chromatogr A. 2002;965:207. doi: 10.1016/s0021-9673(01)01324-3. [DOI] [PubMed] [Google Scholar]
- 27.Kinghorn RM, Marriott PJ. JHRC. 1998;21:620. [Google Scholar]
- 28.Seeley JV, Kramp F, Hicks CJ. Anal Chem. 2000;72:4346. doi: 10.1021/ac000249z. [DOI] [PubMed] [Google Scholar]
- 29.Shellie R, Mondello L, Marriott P. J Chromatogr A. 2002;970:225. doi: 10.1016/s0021-9673(02)00653-2. [DOI] [PubMed] [Google Scholar]
- 30.Sinha AE, Prazen BJ, Synovec RE. Anal Bioanal Chem. 2004;378:1948. doi: 10.1007/s00216-004-2503-7. [DOI] [PubMed] [Google Scholar]
- 31.Hoggard JC, Synovec RE. Anal Chem. 2007;79:1611. doi: 10.1021/ac061710b. [DOI] [PubMed] [Google Scholar]
- 32.Hoggard JC, Synovec RE. Anal Chem. 2008;80:6677. doi: 10.1021/ac800624e. [DOI] [PubMed] [Google Scholar]
- 33.Humston EM, Dombek KM, Hoggard JC, Young ET, Synovec RE. Anal Chem. 2008;80:8002. doi: 10.1021/ac800998j. [DOI] [PMC free article] [PubMed] [Google Scholar]
- 34.Mohler RE, Dombek KM, Hoggard JC, Pierce KM, Young ET, Synovec RE. Analyst. 2007;132:756. doi: 10.1039/b700061h. [DOI] [PubMed] [Google Scholar]
- 35.Mohler RE, Tu BP, Dombek KM, Hoggard JC, Young ET, Synovec RE. J Chromatogr A. 2008;1186:401. doi: 10.1016/j.chroma.2007.10.063. [DOI] [PMC free article] [PubMed] [Google Scholar]
- 36.Yang S, Sadilek M, Synovec RE, Lidstrom ME. J Chromatogr A. 2009;1216:3280. doi: 10.1016/j.chroma.2009.02.030. [DOI] [PMC free article] [PubMed] [Google Scholar]
- 37.Hope JL, Prazen BJ, Nilsson EJ, Lidstrom ME, Synovec RE. Talanta. 2005;65:380. doi: 10.1016/j.talanta.2004.06.025. [DOI] [PubMed] [Google Scholar]
- 38.Duncan MW. Adv Neurol. 1991;56:301. [PubMed] [Google Scholar]


