

I. INTRODUCTION
Before Multi-Detector Computed Tomography (MDCT), the main barriers to the clinical implementation of CT angiography (CTA) were acquisition speed and both spatial and temporal resolution. Imaging of any vascular bed requires rapid volume coverage coupled with the ability to resolve disease in small diameter contrast opacified vessels.. One extreme for volume coverage is CTA for peripheral artery disease (PAD); imaging speed is mandated by blood velocity, on the order of 30-180 mm/sec 1 from the abdominal aorta to the feet. The CT acquisition must be synchronized with the contrast bolus throughout a large craniocaudal, or z-axis, field of view (FOV). This proves challenging in the presence of severe PAD; scans too fast will outrun the bolus. Scans too slow, that is imaging after peak arterial enhancement, result in venous contamination. Another extreme in CTA is coronary angiography where superior temporal resolution is essential to decrease motion related artifacts. As detailed below, faster gantry rotations, dual source CT, and multi-segment reconstruction have improve temporal resolution so that high quality cardiac imaging is now routine.
Egas Moniz developed cerebral angiography in 1927, using x-rays and iodinated contrast material to allow him to diagnose brain disorders such as tumors, strokes, and injuries 2. The first diagnostic coronary angiography was performed in 1958 3. Since then, catheter angiography has assumed the role of gold standard for vascular imaging, despite the invasive nature of the procedure, with 1.5-2% risk of significant morbidity and mortality, and high cost 4. Less invasive techniques for vascular imaging have been developed, such as sonography with Doppler imaging 5, 6, magnetic resonance imaging (MRI) 7 and CTA 8, 9 and have matured in conjunction with developments in catheter arteriography. In many cases noninvasive imaging has become complementary to catheter angiography, such as Doppler imaging for the evaluation of patients with recurrent symptoms after angioplasty 10. In many cases CT has been used in conjunction with catheter angiography, and in a few cases such as imaging the aorta and the pulmonary arteries, CTA has supplanted catheter angiography as the gold standard. The expanding role of CTA emphasizes the need for deep, broad based understanding of physical principles. The purpose of this review is to describe CT hardware and associated software for angiography. The fundamentals of CTA physics are complemented with several clinical examples.
II. METRICS FOR CT ANGIOGRAPHY
Three common, useful CT image quality metrics focus on the ability to resolve, or depict, differences between tissues, namely spatial resolution, temporal resolution, and volume coverage. Contrast media administration is also briefly reviewed because it is an essential part of the CTA acquisition.
Spatial resolution measures the smallest high contrast object depicted by the CT system and depends largely on the detector collimation and reconstruction kernel. Another key parameter is the size of the focal spot. Submillimeter slices generated from modern hardware has expanded the role of CT angiography from aortography to smaller vessels. Spatial resolution can be described in terms of the Modulation Transfer Function (MTF) of the system <Figure 1>. Consider a set of equally spaced lines where the spaces have the same thickness as the lines. A “line pair” is defined as one line plus one space. The “spatial frequency” is measured in line pairs per centimeter. For example, 5 line pairs per centimeter would refer to lines and spaces each 1 millimeter thick, the total of the 5 line pairs and spaces would occupy exactly one centimeter. The MTF describes how well the CT scanner can separate objects with different spatial frequencies. Larger objects with poorly defined edges have predominantly low spatial frequencies; small objects with sharp edges have higher spatial frequencies. The CT scanner's spatial resolution is measured by the spatial frequency of the smallest, sharpest object it can see. CTA functions at roughly 8-15 line pairs per centimeter for a single focal spot, and higher with an in-plane dual focal spot. Although inferior to conventional catheter angiography, CTA can assess arteries as small as 1 mm in diameter. Because it is volumetric, CT angiography allows three-dimensional visualization of the vasculature to separate superimposed structures. As illustrated in the applications below, CT can image small, tortuous coronary arteries as well as the renal 11 and neurovascular circulation 12, 13, up to and including a comprehensive evaluation of the aorta 14.
Figure 1.

Spatial resolution, described in units of line pairs per centimeter, determines the conspicuity of small objects. The ability to resolve the bar pattern gives an estimate of the spatial resolution of a system under prescribed conditions. Higher spatial frequencies allow smaller line pairs to be resolved and therefore will produce a sharper image.
The second important metric for CTA, particularly for cardiac imaging, is temporal resolution. For cardiac imaging, superior temporal resolution is achieved from faster gantry rotation, dual source CT, and multi-segment reconstruction. Modern scanners have a gantry rotation time of 280-350 milliseconds. Therefore, a volume of data (3-4 cm on 64-detector row scanners) can be acquired with full scan mode in less than a half second. However, for cardiac imaging, faster imaging is needed to decrease motion artifacts associated with the beating heart. The half-scan technique 15 uses data from a little over 50% of a gantry rotation to improve temporal resolution to 175 milliseconds or less. Dual source CT provides the best temporal resolution available by using two radiation sources to simultaneously acquiring different data projections 16. This improves temporal resolution by a factor of two 17; in coronary imaging, image quality is improved with a temporal resolution of 82.5 ms for higher heart rates 18-20. Multisegment reconstruction 21 uses less data per cardiac cycle at each z-axis location but acquires the additional projectional data at the same z-axis location for a full half scan reconstruction from additional heartbeats. In essence, different sections of the image are obtained from different heartbeats. <Figure 2> Mutisegment reconstruction increases patient radiation dose compared to single-segment reconstruction and is prone to artifacts from beat to beat variation 22, 23. Adaptive segmented reconstruction can compensate for some cardiac irregularity artifacts22, 24, 25, and improve sensitivity, specificity, and accuracy in the detection of significant stenoses when compared with half-scan reconstructions of the same data 26.
Figure 2.

Multisegment reconstruction (Image courtesy of XiangYang Tang, Emory University). For a half-scan reconstruction and monosector reconstruction, data from a single heart beat is acquired over a longer temporal window and used to reconstruct the cardiac image at each Z location. In multisegment reconstruction, data at each Z axis location is acquired from several heartbeats, each with a shorter temporal window and then combined.
The z-axis coverage per gantry rotation plays a large role in the CTA acquisition. For example, 4 × 1 mm detector-row CT requires the following tradeoff between acquisition speed and slice thickness. With 0.5 second gantry rotation and a 1.25 pitch, a 30cm cephalocaudad coverage typical of aortoiliac or mesenteric CTA requires a 30 second acquisition. Using a 4 × 3 mm detector row configuration, scan time is reduced to 10 seconds. Such tradeoffs are not necessary with 16- or greater detector row systems because of larger volume coverage. In fact, 4 cm or greater coverage per gantry rotation from larger detectors introduces the problem of imaging too quickly and thus outrunning the iodinated contrast bolus. Wide area detector systems (8 - 16 cm per rotation) can image axially, i.e. without table motion, and may have advantages for dynamic perfusion imaging 27.
The injection of contrast medium is essential to delineate the vascular lumen, and when possible, to discriminate the lumen from the vessel wall. Because high patient tolerance and lumen opacification are paramount, the ideal agent for CTA is nonionic, iso- or low osmolar, and has high iodine concentration. In the US, the maximum concentration is 370 mg of iodine per milliliter; in Europe 400 mg of iodine per milliliter is available. Viscosity can impede high injection rates but is decreased by injection of contrast media warmed close to physiologic temperatures. Streak artifact emanating from the superior vena cava and right atrium, as seen with high iodine concentrations and large volumes reflect sub-optimized imaging protocols; saline flush injection follow contrast should avoid this problem. Protocols must be tailored to the vascular bed and typically require rapid contrast administration (3-6 cc per second Biphasic injection can provide a more homogeneous enhancement profile over time 28, 29. Faster acquisitions enable smaller contrast volumes because peak enhancement is required for shorter acquisition times.
III. IMAGE ACQUISITION
The large majority of CT angiography uses helical CT 30 with continuous gantry rotation and table motion. Along with the rotation time, the helical pitch determines the table speed, and therefore the speed at which the volume is scanned. Care must be taken to match the helical pitch and table speed with the first circulation of contrast material through the anatomic region of interest. Acquisitions with too high a helical pitch and table speed outrun the iodine bolus and do not acquire data during peak contrast enhancement. The timing of a CTA scan is of critical importance so that the data is acquired during peak enhancement and not before or after the contrast has arrived. To ensure proper circulation timing, scanners use either a mini test bolus or automatic bolus tracking software. With the test bolus approach, a small amount of contrast is injected and low radiation dose scans are acquired as a separate series to time the contrast arrival. Subsequently, a CTA scan is acquired with the full dose of contrast material with a scan delay as determined by the test bolus. The second, more common, approach is automatic tracking of the main bolus arrival with subsequent automatic initiation of the acquisition. This “bolus tracking” is accomplished by starting the main injection of contrast with the scanner taking intermittent low radiation dose scans. When contrast opacification reaches a preset threshold, the scanner automatically moves to the start position and begins the CTA helical acquisition.
Retrospective EKG gating with helical CT can be used to freeze motion, either from the aortic root in CT aortography or for coronary CTA. Retrospective gating is not required for evaluation of the descending aorta and should not be used since retrospective gating inherently has a higher radiation dose than helical imaging without gating. When retrospective gating is used, image reconstruction uses only the data acquired during a short segment of the cardiac cycle <Figure 3>. The data is then post-processed to correlate with the EKG and assign cardiac phase to each segment of the reconstructed data. For coronary imaging, the entire circulation can be imaged in 4 to 8 seconds using 64-detector row scanners. Image quality is degraded by blurring secondary to rapid heart rates and misregistration artifacts secondary to heart rate variability and arrythmia. 19-21, 23, 31. For single source x-ray systems, beta-blockers should be used to decrease the heart rate, dependent on patients tolerance. Motion compensation algorithms allow for more consistent image quality 32.
Figure 3.

Retrospective gating (lower) utilizes a helical acquisition with constant table motion throughout the cardiac cycle. The x-ray output is ramped up and down dependent on the phase of the cardiac cycle. a) Prospective gating, or the step and shoot method (upper), uses an axial acquisition at a predetermined delay time. During the following heart beat, the table is moved to the next location. Each data slab is acquired every other heart beat.
Prospective helical ECG gated CT has been implemented primarily for coronary CTA to lower dose when compared to retrospective gating 33-35. Both helical and axial prospective acquisitions reduce the patient radiation dose dramatically 36-38. Prospective gating uses information from prior heart beats to estimate the correct time to turn the x-rays on and off during the acquisition R-R intervals <Figure 3>. Helical acquisitions are similar to the retrospective approach, except that the x-rays are turned completely off except during the acquisition phases in diastole. For an axial acquisition, the scanner acquires an axial slab during one heart beat, repositions the patient during the next heartbeat, and acquires another axial slab in the next heartbeat. This spans several heart beats with 64-detector rows 39 or can be achieved in a single heart beat with wide area detector CT 40, 41.
Multiple energy CTA with bone subtraction software is a potentially important tool that is either under investigation or just entering the clinical arena. The long-term goal of multi-energy imaging is additional anatomical and physiologic information based on the energy dependence of tissue attenuation differences 42, 43. Tissue components can be determined via post-processing of images collected at two energies 44, 45 or via direct analysis within the raw CT projection data simultaneously acquired at separate energies 46. There are several different approaches to acquiring the dual energy data. Slow kV switching uses two rotations at different kV settings, but cannot be used for CTA. Dual source CT has been clinically realized, with each tube operating at a different kV and acquiring data 90 degrees apart. Each tube can operate different currents to equalize the noise between the different energies 47-49. Both slow kV switching and dual source use image based decomposition. In order to use raw data based decomposition, each projection must be acquired at both energies simultaneously. Fast kV switching allows the energy to be changed for each adjacent projection which approximates simultaneous acquisition and has the potential for plaque characterization 50. A spectrally sensitive detector, such as a sandwich detector, uses distinct detector materials 51 to separate different energy levels from each layer 52. This gives simultaneous acquisition of each projection, but is challenged by poor energy discrimination. Energy-sensitive, photon-counting detectors 53 are fast enough to determine the energy of every photon absorbed allowing true simultaneous multi-energy imaging, but these are not yet fast enough to read data at clinical CT acquisition speeds.
Bone subtraction software 54 is particularly important for neurovascular imaging at the skull base or discrimination between the anterior tibia and the anterior tibial artery. In the skull, this can be accomplished via image subtraction using two helical or wide volume scans 22, 55. Dual-energy CT may enhance current bone removal algorithms 56. Complete bone removal in the trans-cranial region and in the limbs is expected to improve vascular interpretation 48, 57, 58. At present, residual fragments from incomplete separation must be manually sculpted using post-processing tools. This is tedious and prone to human error. Dual-energy CT has additional potential benefits of removing blooming and beam hardening effects that may overlap and conceal stenoses 51, 59.
IV. NEW DEVELOPMENTS IN CTA
Until recently, state of the art CT was defined by “64-generation” scanners that produced 64-slices, either 64-detector rows, or 32-detector rows and a strategy to double the slice number by alternate deflection of the focal spot of the x-ray source. More modern CT scanners make up the “post-64 era” 60 and improve on the fundamental CT parameters.
Wide area detector CT extends craniocaudal coverage to 16 cm and enables simultaneous large volume craniocaudal imaging either with no table motion (axial imaging) or via helical acquisition. For smaller volumes such as the heart and kidneys, imaging can be shortened to 1 second or less. As noted earlier, with very rapid imaging, careful timing of the contrast media is needed to optimize image quality.
The main advantage of wide area detector scanning is temporal uniformity. With helical or “step-and-shoot” axial scanning, the total z-axis volume is the combination of sub-volumes, each acquired at a different time point. For imaging with no anatomical motion and no temporal variation, e.g. noncontrast thoracic CT with a perfect breath hold, there is no benefit of temporal uniformity because the combination of slabs is identical to imaging with the larger z-axis coverage. However, CTA introduces flowing contrast media that always varies during sub-volume acquisition. Wide area detector CT decreases the variation in contrast enhancement to the limit of scanning the entire z-axis FOV axially so that the volume has temporal uniformity; without step or misregistration artifacts. Furthermore, simultaneous axial acquisition of the entire volume eliminates overscan, reducing dose when compared to a comparable helical acquisition 61-63. The future applications of stationary table CTA include the evaluation of contrast flow dynamics 64-67.
One advantage of dual source CT is high temporal resolution achieved from two coplanar x-ray tubes and detector arrays 16. The temporal resolution can be reduced to one quarter of a gantry rotation, with the greatest advantage being coronary imaging with reduced motion artifact. The second advantage is that the system can operate at two energies, one at a low kVp and the other at a high kVp to achieve a dual energy acquisition 42. The ability to provide material decomposition imaging can be applied to CTA with removal of vessel wall calcium and decrease of blooming artifact. However, in regards to removal of coronary calcifications, it is important to note that a dual source CT system cannot provide simultaneous dual energy capability with quarter rotation temporal resolution. Another new application of 64-detector row (128-slice) vascular CT is dual source imaging with a very high helical pitch. This technique provides rapid large area z-axis volume acquisition, and single heart beat coronary imaging has been shown under specific conditions of very low heart rate 68. The application for vascular imaging will likely be aortography where very fast acquisitions can cover the entire aorta.
There are several technical challenges associated with CT technology. One of the primary challenges is x-ray scatter. Ideally, an x-ray should either pass completely through the subject or be completely absorbed. When incompletely absorbed, the x-ray loses energy and changes direction 69, 70. This phenomenon is known as scatter. If the scattered x-ray is not detected, the effect is the same as if it were completely absorbed. However, if the scatter angle is small or if the detector is wide, there is an increased chance that the x-ray will be detected. For dual source CT, cross-scatter occurs when x-rays from one source are scattered and detected by the other detector. When any of these happen, the x-ray is misregistered with the photons that reached the same point by passing entirely though the subject. Misregistered x-rays introduce image noise and decrease image quality. To minimize scatter, CT scanners typically have small metal septa between detector elements. Since scattered photons approach the detector from directions other than the focal spot, these septa are aligned with a line between the detector element and the x-ray focal spot. This eliminates nearly all x-rays that approach the detector from an incorrect angle 71. Typically, these septa are only along the x-y plane, but some wide area detector scanners have septa along the z-direction.
The cone angle issue is inherent to MDCT. Conventional reconstruction algorithms assume that the x-ray source, the detector, and the slice of interest all lie within the same plane. Furthermore, these algorithms assume that all projections for a slice fall on the same detector row 72, 73. These assumptions are only valid for single slice, axial CT. Interpolation between projections is designed to approximate detector row geometries, but larger interpolations introduce cone beam artifacts requiring sophisticated algorithms to minimize artifacts.
For helical scanning, as detectors increase in size there is an additional challenge. In order to reconstruct images at either end of the helical volume, the algorithm requires additional raw data before and after the volume, leading to a longer beam-on time and additional patient radiation. The extra rotations are called “over-ranging” or helical overscan. The relative contribution of the overscan region to the total patient radiation dose is a function of the length of the acquired volume, the helical pitch, and the detector configuration 74, 75. The percentage contribution of the overscan region increases with shorter volumes. Since the required extra data is based on angular projections and not distance, the detector configuration is significant; wider configurations have a larger overscan area. This is partially mitigated by dynamic collimators to minimize the effect 76, however high helical pitch and fast rotation times can limit the effectiveness of dynamic collimation.
V. CLINICAL CTA
CT aortography
CT has replaced catheter angiography as the gold-standard for imaging the aorta 77, 78. The entire aorta can be imaged in seconds, and the z-axis field of view can be extended to the carotid and/or iliac systems in a single breath hold. Imaging is rapid, accurate, and widely available. CT completely characterizes the aorta for either catheter-based or surgical intervention; size, shape, and severity of calcification of aneurysms <Figure 4>, morphology of the true and false lumen in dissection <Figure 5>, extent of the stenoses <Figure 6>, and the anatomy of congenital anomalies <Figure 7, 8>. CT is the overall best method to detect post-treatment complications such as restenosis, thrombosis, or endoleak after aneurysm repair <Figure 9>. Additionally, contrast enhanced CT can provide useful insights into the thickness and composition of vessel wall by differentiating lumen and arterial wall, allowing the evaluation of vasculitis <Figure 10>. Image post-processing includes three-dimensional volume rendering and maximum intensity projections. The latter can be very accurate for larger vessels such as the aorta with adaquete intraluminal contrast concentration. Smaller vessels are best analysed with multiplanar reformations; maximum intensity projections can introduce artifact in smaller vessels once the image thickness approaches or exceeds the diameter of the vessel. Volume rendering provides an excellent overview of large vessels such as the aorta as well as the spatial orientation of multiple structures.
Figure 4.

Three dimensional volume rendering of 64 year old man with a saccular aneurysm of the aortic arch, presumed to be a pseudoaneurysm for prior trauma. The shape and location of the aneurysm and extent of calcification are well demonstrated. This form of rendering uses the volumetric nature of the CT acquisition to display a large data set from any spatial orientation. A single view is shown above. Three-dimensional volume rendering is complementary to the evaluation of other post-processed data; it should not be used alone for data interpretation. Volumes are highly desirable to illustrate findings for referring clinicians and can be particularly important for surgical planning 115.
Figure 5.

Axial images from a 79-year-old female with type B aortic dissection and rupture. a) noncontrast, b) 30 seconds after intravenous injection, c) 60 seconds after intravenous injection. The false lumen partially enhances after 30 seconds (solid arrow) with extravasation (open arrow) at the later point of enhancement.
Figure 6.

73-year-old man status post axillo-bifemoral bypass graft for an occluded distal aorta. a) Patency of the entire graft is illustrated on a single three-dimensional volume rendered image. b) Sagittal and c) coronal maximum intensity projections demonstrate the occluded distal aorta and mesenteric vessels.
Figure 7.

Three-dimensional volume rendered image of 54-year-old male with severe coarctation (arrow). In this patient, the singe image provides a good overview of extensive collaterals through intercostal, internal thoracic, and axillary arteries.
Figure 8.

60-year-old female with right aortic arch, coarctation (solid arrow), and saccular pseudoaneurysm (open arrow) before a) and after b) endovascular stent graft placement. Three-dimensional volume rendering provides anatomic mapping for surgical planning as well as post-treatment follow-up. Images of this patient demonstrate how CT has assumed the role of gold standard in aortography. Conventional angiography cannot delineate three-dimensional relationships between structures pre-operatively. It is also invasive and impractical for follow-up. MR aortography typically provides relatively comparable image quality but is limited by susceptibility artifact in many stent graft patients..
Figure 9.

85-year-old female, status post endovascular stent repair for an abdominal aortic aneurysm. a) Contrast-enhanced axial image shows enhancement outside of the round stent limbs but within the aneurysm. This is the criteria for an endoleak. b, c) Three-dimensional volume rendered images illustrate the source of the abnormal contrast enhancement; the type II endoleak is shown with flow from the enhanced inferior mesenteric artery (solid arrow) and 5th lumbar arteries (open arrow).
Figure 10.

41-year-old male with known Takayasu arteritis. a) axial image at the level of the left ventricle (LV) shows a thickened aortic wall (solid arrow) identified between the iodinated contrast filled lumen (L) and the surrounding lung parenchyma. b) Axial image at the level of the main pulmonary artery (PA) show less prominent thickening of aortic wall plus stenosis of the left pulmonary artery (open arrow).
CT Pulmonary Angiography
CT pulmonary angiography (CTPA) has replaced catheter angiography as the gold-standard for imaging the pulmonary arteries. The only role for other modalities is patients with a contraindication to CT. Breath hold imaging of the entire thorax is routine because multi-detector rows dramatically increase the z-axis coverage per gantry rotation, and because gantry rotation speeds are less than one-half second. CTPA has high sensitivity and specificity in detecting pulmonary embolism 79, 80 <Figure 11>. Long-term changes in patients with pulmonary embolism or pulmonary artery stenosis include the development of small collateral arteries that can be characterized with volume rendering to show the relationship with surrounding structures <Figure 12>.
Figure 11.

80-year-old male with dyspnea and clinically suspected pulmonary embolism. a) oblique maximum intensity projection oriented to optimally demonstrate the bifurcation of the main pulmonary artery (PA) shows a saddle-type pulmonary embolism, characterized by filling defects (arrow). b, c) three-dimensional volume rendered images use segmentation to illustrate the extent of the thrombus in yellow.
Figure 12.

24-year-old female with known vasculitis. a) Contrast-enhanced axial image shows the stenosis of the right pulmonary artery (solid arrow). b) Three-dimensional volume rendered image (aorta is demonstrated as translucent) enables the visualization of many small collaterals (open arrow) from the bronchial arteries and their relationship to surrounding tissues.
Neurovascular CTA
CTA of the head and neck provides high quality, three dimensional image data sets to study cerebrovascular anatomy in any arbitrary plane. CT enjoys increasing utilization with respect to MR and catheter angiography 81-83; the non-invasive nature saves both procedure time and patient discomfort. Furthermore, in complicated patients, CTA can often be performed using less iodinated contrast media than catheter angiography, an advantage for patients at high risk for contrast induced nephropathy 84, 85. As noted above, neurovascular CTA has challenges near the skull base, such as in the petrous carotid region. These vessels travel very closely to the surrounding bone and can be easily obscured or distorted, potentially leading to misdiagnosis. Wide area detector CT with 16 cm z-axis coverage can image the whole brain axially, enabling angiography images to be obtained in conjunction with whole brain perfusion images obtained with no table motion and no artifact from the post-acquisition combination of sub-volumes <Figure 13>.
Figure 13.

39-year-old man with giant cell arteritis imaged with 320-detector row CT before (top row) and after (bottom row) corticosteroid therapy. A. CTA shows beading and stenosis of the pre-cavernous, cavernous, and supraclinoid portions of the internal carotid artery (arrow head). There is narrowing and irregularity of ophthalmic artery (arrow) that is resolved after treatment (F). B. Three-dimensional volume rendering shows narrowing and beading of parietal branch of the left superficial temporal artery (arrow head), and irregularity of the remaining frontal branch (arrow) that are improved after therapy (G). Note that the patient had prior biopsy of the frontal branch. C., H. (relative cerebral blood volume: rCBV) and D., I. (relative cerebral blood flow: rCBF) maps illustrate a region of decreased perfusion in the left frontal parasagittal region with adjacent hypoperfusion that returned to normal symmetric perfusion after therapy. E. Mean transit time (MTT) map shows left frontal decreased transit time which resolved following treatment (J). Image used with permission 116.
Coronary CTA
Calcium scoring images are acquired without intravenous contrast to optimally visualize and quantify calcified plaque, a strong indicator of coronary artery disease 86. This is not considered angiography since the lumen is not evaluated for stenosis. For CTA, artifacts such as calcium-blooming 87, 88 and beam hardening 89, 90 can be problematic in the interpretation of stenosis, particularly when there are metal stents 91, 92 and heavily calcified coronary arteries. As noted in the text, coronary imaging differs from CTA of other body parts because ECG gating is needed to freeze cardiac motion. When retrospective ECG gating is used, ejection fraction and wall motion evaluation can be added to the interpretation. However, the trend in current cardiac CT is to perform prospective ECG gating to lower radiation dose.
New data is beginning to support the use of CT data beyond the interpretation of coronary stenosis. For example, plaque characterization in its early stages (fatty and fibrous) may be possible 93, 94. Coronary events may be predicted from the type and distribution of plaque or estimation of the endothelial shear stress along the coronary tree 95, 96. Currently, such assessment relies on intra-vascular ultrasound (IVUS) that has the disadvantages that only a single vessel study can be performed at a time, and there is a known though relatively small rate of complications 97-99.
Renal and mesenteric CTA
Renal arteries are common sites of atherosclerosis with associated stenosis, aneurysms, or occlusion. Since the average renal artery diameter is approximately 4–5 mm and accessory arteries are considerably smaller, up to 15% of vessels can be missed by 1-4 detector row CTA 100. Submillimeter isotropic resolution from more modern hardware improves spatial resolution; these scanners also have shorter acquisition times to better visualize normal <Figure 14> and atherosclerotic <Figure 15> renal arteries. CT can also be used for other diagnoses such as fibromuscular dysplasia <Figure 16>. Three-dimensional volume rendering and maximum intensity projections are important in planning of therapy.<Figure 17>.
Figure 14.

Three-dimensional volume rendered image for the planning of kidney transplant, showing normal renal arteries. Note the clearly visualized right accessory renal artery.
Figure 15.

85-year-old female with bilateral renal artery stenosis (arrows). a) Coronal maximum intensity projection focused on the right renal artery. b) Three-dimensional volume rendering also demonstrates the relationship of the renal arteries and the kidneys.
Figure 16.

44-year-old female with fibromuscular dysplasia of bilateral renal arteries (arrows). a) Coronal maximum intensity projection and b) three-dimensional volume rendered image have sufficient spatial resolution, showing beaded appearance of proximal renal arteries consistent with the finding on c) catheter angiogram.
Figure 17.

39-year-old female with right renal arteriovenous malformation. a) maximum intensity projection shows early venous filling, an important finding in this diagnosis. b, c) Three-dimensional volume rendered images (venous system is segmented in blue) illustrate the shape and position of tortuous arteries or veins.
Mesenteric arteries are very small, with distal branches measuring 1 mm or less in diameter <Figure 18>. CT for mesenteric ischemia <Figure 19> can be acquired at multiple phases of contrast enhancement to evaluate arteries, veins, and the bowel wall. A dynamic protocol can also be used to pinpoint the location of a gastrointestinal bleed <Figure 20>. CT can also be used as an imaging modality of choice for clinically suspected median arcuate ligament syndrome <Figure 21>.
Figure 18.

a, b) Three-dimensional volume rendered images in a patient with normal celiac, superior mesenteric artery, and inferior mesenteric artery branches.
Figure 19.

84-year-old female with acute abdominal pain. Sagittal maximum intensity projection demonstrates thrombosis with occlusion of the celiac artery with near occlusion of the superior mesenteric artery (arrows).
Figure 20.

54-year-old female with abdominal pain and rectal bleeding. Comparison between a) noncontrast and b) contrast-enhanced image shows extravasation of contrast media (arrows) into the lumen of the distal transverse colon, indicating active bleeding. Reformation of the CT data as c) a three-dimensional volume rendering or d) coronal maximum intensity projection shows the high attenuation of the contrast indicating hemorrhage (arrows).
Figure 21.

50-year-old male with abdominal pain and high clinical suspicion for median arcuate ligament compression (arrow). a) Sagittal maximum intensity projection and b) three-dimensional volume rendering are essential to detail the relationship between the compressed celiac axis and the aorta. Note the normal superior mesenteric artery, a characteristic finding in these patients.
Peripheral CTA
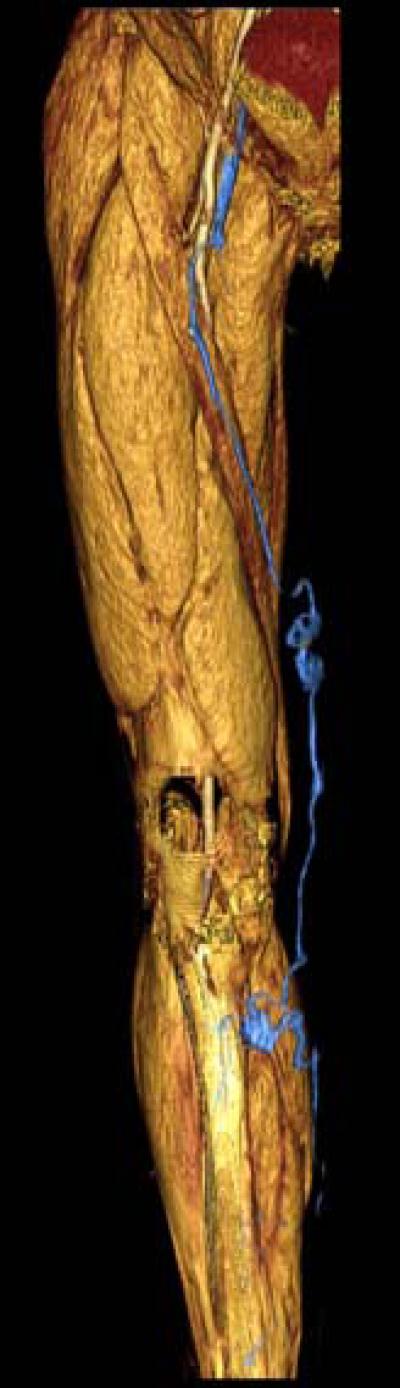
Patients with PAD <Figure 22>, acute embolic events, trauma, and complications after procedures <Figure 23> can be evaluated with CT. As noted in the text, adequate enhancement requires an understanding of the scanner speed and kinetics of the iodinated contrast medium. In patients with severe PAD, the speed of the contrast bolus can be 30 millimeters per second 1. While out-running the bolus is highly unlikely with a 4-detector row CT, the risk increases with faster table speeds associated with 64 (or more) slices per gantry rotation. Maximum intensity projections and three-dimensional volume rendering provides a good overview of the vessel anatomy, patency, and the development of collateral vessels <Figure 24>.
Figure 22.

91-year-old male with right shoulder and arm pain. Upper extremity CTA displayed as a) maximum intensity projection and b) three-dimensional volume rendering shows acute subclavian artery thrombosis (arrows). Patients with more longstanding obstruction are expected to have more collateral flow.
Figure 23.

38-year-old male with left thigh arterio-venous hemodialysis graft. Three-dimensional volume rendering shows stenosis (solid arrows) in the left saphenous and femoral veins cranial to the anastomosis. There is a small graft aneurysm (open arrow).
Figure 24.

82-year-old male status post endovascular stent graft placement. Note that the tortured bilateral iliac and femoral arteries with distal aneurysms (arrows) are well visualized on three-dimensional volume rendered image.
CT Venography
Imaging during venous enhancement, or CT venography, can be used to diagnose deep venous thrombosis <Figure 25>. The role of CT venography in the pelvis and lower extremities acquired in combination with CT pulmonary angiography 101 is controversial. CT can also be used to evaluate varicose veins, although it is not a first-line imaging modality for this condition <Figure 26>. Lower extremity CT venography is usually acquired roughly 180-240 seconds after antecubital vein contrast injection. Although there is no standard protocol to visualize inferior vena cava, the portal phase (60-70 seconds after contrast injection) or equilibrium phase (90-120 seconds) can be used.
Figure 25.

39-year-old female with extensive thrombus in inferior vena cava. a) Contrast-enhanced axial image shows the filling defect in inferior vena cava (arrow). b) Coronal maximum intensity projection can depict long segments of thrombus (arrow).
Figure 26.
Three-dimensional volume rendering of 58-year-old male with varicose veins. CT venography provides the interventionalist with a comprehensive view of the varicose veins (segmented in blue) with clear anatomic landmarks such as muscle and bone.
VI. CONCLUSION
Recent advances in technology have moved CT to the front line for many vascular diseases, dramatically changing clinical evaluation pathways. Understanding CT technology is critical for optimizing protocols.
APPENDIX: CT IMAGING PARAMETERS
Scan parameters influence image quality and patient dose in CTA 102-105. Factors such as kV, mAs, pitch, detector configuration, and rotation time are interrelated. Understanding these relationships enables design of optimal protocols for a particular CT system and a given application.
kV (kiloVolts)
Tube potential, or kV, represents the voltage between the anode and cathode of the x-ray CT tube and thus determines the energy of the emitted x-rays. When compared to lower energies, higher energy x-rays have a greater probability of passing through the body to reach a detector and creating a signal. All else equal, higher kVp means less noise, but also less contrast between materials because contrast is generated by x-rays absorbed by the body 106. However, higher energy x-rays absorbed by the body deposit more energy than those with lower energy and thus gives greater dose. Furthermore, the higher tube potential causes more x-rays to be generated for the same tube current. For the same scan parameters, changing the kVp from 120 to 135 increases the dose by about 33% 107. Because of the higher dose and poorer contrast 88, 135-140 kVp is clinically utilized for better penetration of obese patients or dense anatomy, e.g. bone or metal 108.
mAs (milliAmpere seconds)
The tube current, or mA, determines the number of x-rays the tube produces. Combined with the gantry rotation time, this represents the total x-ray output of the tube per rotation, or mAs. Changing the mAs is the most common method of adjusting dose and noise level. Halving the mAs will reduce patient dose two-fold but also halve the number of x-rays reaching the detector. Image noise increases and low contrast detectability will be diminished 109.
Helical Pitch
Helical pitch is the distance the CT table travels in a rotation divided by the total active detector width in the z-direction. Higher pitches lower dose because of faster table movement and subsequent lower beam-on time at each z-axis location. Because of redundant data with 64-detector row CT, good reconstruction algorithms prevent the slice sensitivity profile (a curve showing the relationship between the CT number and slice position along the patient z-axis in helical CT) from broadening with pitches between 1 and 2. However, as the pitch increases, there is less projection data for a given slice and thus noise increases. To compensate, the mA is typically increased. Higher pitch value may also introduce more helical artifact. Thus, increased pitch values are clinically relevant for studies requiring fast acqujsition with decreased scan time.
mAseff (Effective mAs)
The mAseff is the mAs divided by the pitch and has been used as a dose surrogate that is appropriate for comparing dose between protocols on a single scanner model 110. However, mAseff is not an appropriate value for comparing dose between scanners because of differences in geometry and filtration.
Collimation
Many combinations of slice width and number can be acquired. The actual x-ray beam is slightly wider than the nominal beam width, defined as the number of detector rows multiplied by detector element width. This ensures that detectors on the edge of the array receive uniform x-ray coverage, resulting in a small amount of unused radiation called penumbra 22. Typically, the total amount of penumbra is the same regardless of the nominal beam width. Therefore, with larger beams, the extra radiation from the penumbra is a smaller percentage of the overall useful beam width. The combination of a wide beam and thinner slices optimizes image quality and dose efficiency.
Acquired and Reconstructed Slice Width
The acquired slice width depends of the detector configuration and thus determines the minimum reconstructed image width. For example, images from a 16 × 1 mm detector configuration can be reconstructed at 1 mm or greater; a 16 × 0.5 mm configuration enables 0.5 mm slice reconstruction. At equal radiation dose, thicker slices have less noise because proportionately more photons are used. However, the tradeoff is poorer z-axis resolution and subsequent partial volume artifacts 111 that comprise vascular imaging and image reformation 112. Thus, to resolve small image detail in routine CTA, optimim image quality and dose efficiency utilize the thinnest slices available 113.
Reconstruction Kernel
The acquired data is filtered by the reconstruction kernel that largely influences the perceived spatial resolution, image noise, and dose needed for clinically useful images. Sharper kernels improve in-plane spatial resolution with the trade-off of greater noise; smoother kernels reduce noise at the expense of in-plane resolution. Kernels for most CT exams are relatively sharp, reflecting the need for spatial detail in small vessels. The sharpest kernels utilized in clinical practice are for evaluation of in stent luminal diameter and detection of in stent stenoses. 22, 114
Footnotes
Publisher's Disclaimer: This is a PDF file of an unedited manuscript that has been accepted for publication. As a service to our customers we are providing this early version of the manuscript. The manuscript will undergo copyediting, typesetting, and review of the resulting proof before it is published in its final citable form. Please note that during the production process errors may be discovered which could affect the content, and all legal disclaimers that apply to the journal pertain.
REFERENCES
- 1.Fleischmann D, Rubin GD. Quantification of intravenously administered contrast medium transit through the peripheral arteries: implications for CT angiography. Radiology. 2005;236(3):1076–1082. doi: 10.1148/radiol.2363041392. [DOI] [PubMed] [Google Scholar]
- 2.Ligon BL. Biography: history of developments in imaging techniques: Egas Moniz and angiography. Semin Pediatr Infect Dis. 2003;14(2):173–181. doi: 10.1053/spid.2003.127232. [DOI] [PubMed] [Google Scholar]
- 3.Mueller RL, Sanborn TA. The history of interventional cardiology: cardiac catheterization, angioplasty, and related interventions. Am Heart J. 1995;129(1):146–172. doi: 10.1016/0002-8703(95)90055-1. [DOI] [PubMed] [Google Scholar]
- 4.Waugh JR, Sacharias N. Arteriographic complications in the DSA era. Radiology. 1992;182(1):243–246. doi: 10.1148/radiology.182.1.1727290. [DOI] [PubMed] [Google Scholar]
- 5.Scoutt LM, Zawin ML, Taylor KJ. Doppler US. Part II. Clinical applications. Radiology. 1990;174(2):309–319. doi: 10.1148/radiology.174.2.2404310. [DOI] [PubMed] [Google Scholar]
- 6.Krnic A, Vucic N, Sucic Z. Duplex scanning compared with intra-arterial angiography in diagnosing peripheral arterial disease: three analytical approaches. Vasa. 2006;35(2):86–91. doi: 10.1024/0301-1526.35.2.86. [DOI] [PubMed] [Google Scholar]
- 7.Wardlaw JM, Chappell FM, Best JJ, Wartolowska K, Berry E. Noninvasive imaging compared with intra-arterial angiography in the diagnosis of symptomatic carotid stenosis: a meta-analysis. Lancet. 2006;367(9521):1503–1512. doi: 10.1016/S0140-6736(06)68650-9. [DOI] [PubMed] [Google Scholar]
- 8.Heijenbrok-Kal MH, Kock MC, Hunink MG. Lower extremity arterial disease: multidetector CT angiography meta-analysis. Radiology. 2007;245(2):433–439. doi: 10.1148/radiol.2451061280. [DOI] [PubMed] [Google Scholar]
- 9.Schoenhagen P, Halliburton SS, Stillman AE, Kuzmiak SA, Nissen SE, Tuzcu EM, White RD. Noninvasive imaging of coronary arteries: current and future role of multi-detector row CT. Radiology. 2004;232(1):7–17. doi: 10.1148/radiol.2321021803. [DOI] [PubMed] [Google Scholar]
- 10.Rybicki FJ, Nallamshetty L, Yucel EK, Holtzman SR, Baum RA, Foley WD, Ho VB, Mammen L, Narra VR, Stein B, Moneta GL. ACR appropriateness criteria on recurrent symptoms following lower-extremity angioplasty. J Am Coll Radiol. 2008;5(12):1176–1180. doi: 10.1016/j.jacr.2008.08.010. [DOI] [PubMed] [Google Scholar]
- 11.Leiner T, de Haan MW, Nelemans PJ, van Engelshoven JM, Vasbinder GB. Contemporary imaging techniques for the diagnosis of renal artery stenosis. Eur Radiol. 2005;15(11):2219–2229. doi: 10.1007/s00330-005-2826-6. [DOI] [PubMed] [Google Scholar]
- 12.Arora S, Chien JD, Cheng SC, Chun KA, Wintermark M. Optimal carotid artery coverage for carotid plaque CT-imaging in predicting ischemic stroke. J Neuroradiol. 2009 doi: 10.1016/j.neurad.2009.04.002. [DOI] [PubMed] [Google Scholar]
- 13.Rozie S, de Weert TT, de Monye C, Homburg PJ, Tanghe HL, Dippel DW, van der Lugt A. Atherosclerotic plaque volume and composition in symptomatic carotid arteries assessed with multidetector CT angiography; relationship with severity of stenosis and cardiovascular risk factors. Eur Radiol. 2009;19(9):2294–2301. doi: 10.1007/s00330-009-1394-6. [DOI] [PMC free article] [PubMed] [Google Scholar]
- 14.Buckley O, Rybicki FJ, Gerson DS, Huether C, Prior RF, Powers SL, Ersoy H. Imaging features of intramural hematoma of the aorta. Int J Cardiovasc Imaging. 2009 doi: 10.1007/s10554-009-9504-8. [DOI] [PubMed] [Google Scholar]
- 15.Hsieh J. Computed tomography : principles, design, artifacts, and recent advances. SPIE Optical Engineering Press; Bellingham, WA: 2003. [Google Scholar]
- 16.Flohr TG, McCollough CH, Bruder H, Petersilka M, Gruber K, Suss C, Grasruck M, Stierstorfer K, Krauss B, Raupach R, Primak AN, Kuttner A, Achenbach S, Becker C, Kopp A, Ohnesorge BM. First performance evaluation of a dual-source CT (DSCT) system. Eur Radiol. 2006;16(2):256–268. doi: 10.1007/s00330-005-2919-2. [DOI] [PubMed] [Google Scholar]
- 17.McCollough CH, Schmidt B, Yu L, Primak A, Ulzheimer S, Bruder H, Flohr TG. Measurement of temporal resolution in dual source CT. Med Phys. 2008;35(2):764–768. doi: 10.1118/1.2826559. [DOI] [PMC free article] [PubMed] [Google Scholar]
- 18.Araoz PA, Kirsch J, Primak AN, Braun NN, Saba O, Williamson EE, Harmsen WS, Mandrekar JN, McCollough CH. Optimal image reconstruction phase at low and high heart rates in dual-source CT coronary angiography. Int J Cardiovasc Imaging. 2009 doi: 10.1007/s10554-009-9489-3. [DOI] [PMC free article] [PubMed] [Google Scholar]
- 19.Xu L, Yang L, Zhang Z, Li Y, Fan Z, Ma X, Lv B, Yu W. Low-dose adaptive sequential scan for dual-source CT coronary angiography in patients with high heart rate: Comparison with retrospective ECG gating. Eur J Radiol. 2009 doi: 10.1016/j.ejrad.2009.06.003. [DOI] [PubMed] [Google Scholar]
- 20.Blankstein R, Shah A, Pale R, Abbara S, Bezerra H, Bolen M, Mamuya WS, Hoffmann U, Brady TJ, Cury RC. Radiation dose and image quality of prospective triggering with dual-source cardiac computed tomography. Am J Cardiol. 2009;103(8):1168–1173. doi: 10.1016/j.amjcard.2008.12.045. [DOI] [PubMed] [Google Scholar]
- 21.Blobel J, Baartman H, Rogalla P, Mews J, Lembcke A. [Spatial and temporal resolution with 16-slice computed tomography for cardiac imaging]. Rofo. 2003;175(9):1264–1271. doi: 10.1055/s-2003-41925. [DOI] [PubMed] [Google Scholar]
- 22.Herzog C, Arning-Erb M, Zangos S, Eichler K, Hammerstingl R, Dogan S, Ackermann H, Vogl TJ. Multi-detector row CT coronary angiography: influence of reconstruction technique and heart rate on image quality. Radiology. 2006;238(1):75–86. doi: 10.1148/radiol.2381041595. [DOI] [PubMed] [Google Scholar]
- 23.Leschka S, Wildermuth S, Boehm T, Desbiolles L, Husmann L, Plass A, Koepfli P, Schepis T, Marincek B, Kaufmann PA, Alkadhi H. Noninvasive coronary angiography with 64-section CT: effect of average heart rate and heart rate variability on image quality. Radiology. 2006;241(2):378–385. doi: 10.1148/radiol.2412051384. [DOI] [PubMed] [Google Scholar]
- 24.Wintersperger BJ, Nikolaou K, von Ziegler F, Johnson T, Rist C, Leber A, Flohr T, Knez A, Reiser MF, Becker CR. Image quality, motion artifacts, and reconstruction timing of 64-slice coronary computed tomography angiography with 0.33-second rotation speed. Invest Radiol. 2006;41(5):436–442. doi: 10.1097/01.rli.0000202639.99949.c6. [DOI] [PubMed] [Google Scholar]
- 25.Hein I, Taguchi K, Silver MD, Kazama M, Mori I. Feldkamp-based cone-beam reconstruction for gantry-tilted helical multislice CT. Med Phys. 2003;30(12):3233–3242. doi: 10.1118/1.1625443. [DOI] [PubMed] [Google Scholar]
- 26.Dewey M, Laule M, Krug L, Schnapauff D, Rogalla P, Rutsch W, Hamm B, Lembcke A. Multisegment and halfscan reconstruction of 16-slice computed tomography for detection of coronary artery stenoses. Invest Radiol. 2004;39(4):223–229. doi: 10.1097/01.rli.0000115201.27096.6e. [DOI] [PubMed] [Google Scholar]
- 27.Klingebiel R, Siebert E, Diekmann S, Wiener E, Masuhr F, Wagner M, Bauknecht HC, Dewey M, Bohner G. 4-D Imaging in cerebrovascular disorders by using 320-slice CT: feasibility and preliminary clinical experience. Acad Radiol. 2009;16(2):123–129. doi: 10.1016/j.acra.2008.11.004. [DOI] [PubMed] [Google Scholar]
- 28.Fleischmann D, Rubin GD, Bankier AA, Hittmair K. Improved uniformity of aortic enhancement with customized contrast medium injection protocols at CT angiography. Radiology. 2000;214(2):363–371. doi: 10.1148/radiology.214.2.r00fe18363. [DOI] [PubMed] [Google Scholar]
- 29.Halpern EJ. Triple-rule-out CT angiography for evaluation of acute chest pain and possible acute coronary syndrome. Radiology. 2009;252(2):332–345. doi: 10.1148/radiol.2522082335. [DOI] [PubMed] [Google Scholar]
- 30.Kalender WA, Seissler W, Klotz E, Vock P. Spiral volumetric CT with single-breath-hold technique, continuous transport, and continuous scanner rotation. Radiology. 1990;176(1):181–183. doi: 10.1148/radiology.176.1.2353088. [DOI] [PubMed] [Google Scholar]
- 31.Nieman K, Rensing BJ, van Geuns RJ, Vos J, Pattynama PM, Krestin GP, Serruys PW, de Feyter PJ. Non-invasive coronary angiography with multislice spiral computed tomography: impact of heart rate. Heart. 2002;88(5):470–474. doi: 10.1136/heart.88.5.470. [DOI] [PMC free article] [PubMed] [Google Scholar]
- 32.Mather R, Boedeker K, Nicholson T. Automatic Cardiac Phase Selection for Motion-free Coronary Imaging.. Second Annual Meeting of the SCCT.; 2007; (Abstract 65) [Google Scholar]
- 33.Budoff MJ, Achenbach S, Blumenthal RS, Carr JJ, Goldin JG, Greenland P, Guerci AD, Lima JA, Rader DJ, Rubin GD, Shaw LJ, Wiegers SE. Assessment of coronary artery disease by cardiac computed tomography: a scientific statement from the American Heart Association Committee on Cardiovascular Imaging and Intervention, Council on Cardiovascular Radiology and Intervention, and Committee on Cardiac Imaging, Council on Clinical Cardiology. Circulation. 2006;114(16):1761–1791. doi: 10.1161/CIRCULATIONAHA.106.178458. [DOI] [PubMed] [Google Scholar]
- 34.Fazel R, Krumholz HM, Wang Y, Ross JS, Chen J, Ting HH, Shah ND, Nasir K, Einstein AJ, Nallamothu BK. Exposure to low-dose ionizing radiation from medical imaging procedures. N Engl J Med. 2009;361(9):849–857. doi: 10.1056/NEJMoa0901249. [DOI] [PMC free article] [PubMed] [Google Scholar]
- 35.Arnoldi E, Johnson TR, Rist C, Wintersperger BJ, Sommer WH, Becker A, Becker CR, Reiser MF, Nikolaou K. Adequate image quality with reduced radiation dose in prospectively triggered coronary CTA compared with retrospective techniques. Eur Radiol. 2009;19(9):2147–2155. doi: 10.1007/s00330-009-1411-9. [DOI] [PubMed] [Google Scholar]
- 36.Shuman WP, Branch KR, May JM, Mitsumori LM, Lockhart DW, Dubinsky TJ, Warren BH, Caldwell JH. Prospective versus retrospective ECG gating for 64-detector CT of the coronary arteries: comparison of image quality and patient radiation dose. Radiology. 2008;248(2):431–437. doi: 10.1148/radiol.2482072192. [DOI] [PubMed] [Google Scholar]
- 37.Martini C, Palumbo A, Maffei E, Rossi A, Rengo M, Malago R, Dijkshoorn M, Weustink A, Mollet N, Krestin G, Cademartiri F. Dose reduction in spiral CT coronary angiography with dual-source equipment. Part I. A phantom study applying different prospective tube current modulation algorithms. Radiol Med. 2009;114(7):1037–1052. doi: 10.1007/s11547-009-0437-z. [DOI] [PubMed] [Google Scholar]
- 38.Hirai N, Horiguchi J, Fujioka C, Kiguchi M, Yamamoto H, Matsuura N, Kitagawa T, Teragawa H, Kohno N, Ito K. Prospective versus retrospective ECG-gated 64-detector coronary CT angiography: assessment of image quality, stenosis, and radiation dose. Radiology. 2008;248(2):424–430. doi: 10.1148/radiol.2482071804. [DOI] [PubMed] [Google Scholar]
- 39.Earls JP, Berman EL, Urban BA, Curry CA, Lane JL, Jennings RS, McCulloch CC, Hsieh J, Londt JH. Prospectively gated transverse coronary CT angiography versus retrospectively gated helical technique: improved image quality and reduced radiation dose. Radiology. 2008;246(3):742–753. doi: 10.1148/radiol.2463070989. [DOI] [PubMed] [Google Scholar]
- 40.Steigner ML, Otero HJ, Cai T, Mitsouras D, Nallamshetty L, Whitmore AG, Ersoy H, Levit NA, Di Carli MF, Rybicki FJ. Narrowing the phase window width in prospectively ECG-gated single heart beat 320-detector row coronary CT angiography. Int J Cardiovasc Imaging. 2009;25(1):85–90. doi: 10.1007/s10554-008-9347-8. [DOI] [PubMed] [Google Scholar]
- 41.Dewey M, Zimmermann E, Laule M, Rutsch W, Hamm B. Three-vessel coronary artery disease examined with 320-slice computed tomography coronary angiography. Eur Heart J. 2008;29(13):1669. doi: 10.1093/eurheartj/ehm626. [DOI] [PubMed] [Google Scholar]
- 42.Alvarez RE, Macovski A. Energy-selective reconstructions in X-ray computerized tomography. Phys Med Biol. 1976;21(5):733–744. doi: 10.1088/0031-9155/21/5/002. [DOI] [PubMed] [Google Scholar]
- 43.Avrin DE, Macovski A, Zatz LE. Clinical application of Compton and photo-electric reconstruction in computed tomography: preliminary results. Invest Radiol. 1978;13(3):217–222. doi: 10.1097/00004424-197805000-00007. [DOI] [PubMed] [Google Scholar]
- 44.Maass C, Baer M, Kachelriess M. Image-based dual energy CT using optimized precorrection functions: a practical new approach of material decomposition in image domain. Med Phys. 2009;36(8):3818–3829. doi: 10.1118/1.3157235. [DOI] [PubMed] [Google Scholar]
- 45.Schmidt TG. Optimal “image-based” weighting for energy-resolved CT. Med Phys. 2009;36(7):3018–3027. doi: 10.1118/1.3148535. [DOI] [PubMed] [Google Scholar]
- 46.Zou Y, Silver M. Analysis of Fast kV-switching in Dual Energy CT using a Pre-reconstruction Decomposition Technique. Progress in biomedical optics and imaging. 2008;9(1):30. [Google Scholar]
- 47.Johnson TR, Krauss B, Sedlmair M, Grasruck M, Bruder H, Morhard D, Fink C, Weckbach S, Lenhard M, Schmidt B, Flohr T, Reiser MF, Becker CR. Material differentiation by dual energy CT: initial experience. Eur Radiol. 2007;17(6):1510–1517. doi: 10.1007/s00330-006-0517-6. [DOI] [PubMed] [Google Scholar]
- 48.Uotani K, Watanabe Y, Higashi M, Nakazawa T, Kono AK, Hori Y, Fukuda T, Kanzaki S, Yamada N, Itoh T, Sugimura K, Naito H. Dual-energy CT head bone and hard plaque removal for quantification of calcified carotid stenosis: utility and comparison with digital subtraction angiography. Eur Radiol. 2009;19(8):2060–2065. doi: 10.1007/s00330-009-1358-x. [DOI] [PubMed] [Google Scholar]
- 49.Barreto M, Schoenhagen P, Nair A, Amatangelo S, Milite M, Obuchowski NA, Lieber ML, Halliburton SS. Potential of dual-energy computed tomography to characterize atherosclerotic plaque: ex vivo assessment of human coronary arteries in comparison to histology. J Cardiovasc Comput Tomogr. 2008;2(4):234–242. doi: 10.1016/j.jcct.2008.05.146. [DOI] [PubMed] [Google Scholar]
- 50.Mendonca P, Bhotika R, Thomsen B, Licato P, Joshi M. Multi-material decomposition of dual-energy CT. SPIE Medical Imaging. 2009;7622:67. [Google Scholar]
- 51.Roessl E, Ziegler A, Proksa R. On the influence of noise correlations in measurement data on basis image noise in dual-energylike x-ray imaging. Med Phys. 2007;34(3):959–966. doi: 10.1118/1.2514058. [DOI] [PubMed] [Google Scholar]
- 52.Heismann B, Wirth S. SNR performance comparison of dual-layer detector and dual-kVp spectral CT. Nuclear Science Symposium Conference Record, 2007. NSS '07. IEEE. 2007;5:3820–3822. [Google Scholar]
- 53.Schlomka JP, Roessl E, Dorscheid R, Dill S, Martens G, Istel T, Baumer C, Herrmann C, Steadman R, Zeitler G, Livne A, Proksa R. Experimental feasibility of multi-energy photon-counting K-edge imaging in pre-clinical computed tomography. Phys Med Biol. 2008;53(15):4031–4047. doi: 10.1088/0031-9155/53/15/002. [DOI] [PubMed] [Google Scholar]
- 54.Henrich G, Mai N, Backmund H. Preprocessing in computed tomography picture analysis: a “bone-deleting” algorithm. J Comput Assist Tomogr. 1979;3(3):379–384. doi: 10.1097/00004728-197906000-00014. [DOI] [PubMed] [Google Scholar]
- 55.Li Q, Lv F, Li Y, Li K, Luo T, Xie P. Subtraction CT angiography for evaluation of intracranial aneurysms: comparison with conventional CT angiography. Eur Radiol. 2009;19(9):2261–2267. doi: 10.1007/s00330-009-1416-4. [DOI] [PubMed] [Google Scholar]
- 56.Morhard D, Fink C, Graser A, Reiser MF, Becker C, Johnson TR. Cervical and cranial computed tomographic angiography with automated bone removal: dual energy computed tomography versus standard computed tomography. Invest Radiol. 2009;44(5):293–297. doi: 10.1097/RLI.0b013e31819b6fba. [DOI] [PubMed] [Google Scholar]
- 57.Deng K, Liu C, Ma R, Sun C, Wang XM, Ma ZT, Sun XL. Clinical evaluation of dual-energy bone removal in CT angiography of the head and neck: comparison with conventional bone-subtraction CT angiography. Clin Radiol. 2009;64(5):534–541. doi: 10.1016/j.crad.2009.01.007. [DOI] [PubMed] [Google Scholar]
- 58.Meyer BC, Werncke T, Hopfenmuller W, Raatschen HJ, Wolf KJ, Albrecht T. Dual energy CT of peripheral arteries: effect of automatic bone and plaque removal on image quality and grading of stenoses. Eur J Radiol. 2008;68(3):414–422. doi: 10.1016/j.ejrad.2008.09.016. [DOI] [PubMed] [Google Scholar]
- 59.Boll DT, Merkle EM, Paulson EK, Mirza RA, Fleiter TR. Calcified vascular plaque specimens: assessment with cardiac dual-energy multidetector CT in anthropomorphically moving heart phantom. Radiology. 2008;249(1):119–126. doi: 10.1148/radiol.2483071576. [DOI] [PubMed] [Google Scholar]
- 60.Otero HJ, Steigner ML, Rybicki FJ. The “post-64” era of coronary CT angiography: understanding new technology from physical principles. Radiol Clin North Am. 2009;47(1):79–90. doi: 10.1016/j.rcl.2008.11.001. [DOI] [PMC free article] [PubMed] [Google Scholar]
- 61.Dewey M, Zimmermann E, Deissenrieder F, Laule M, Dubel HP, Schlattmann P, Knebel F, Rutsch W, Hamm B. Noninvasive coronary angiography by 320-row computed tomography with lower radiation exposure and maintained diagnostic accuracy: comparison of results with cardiac catheterization in a head-to-head pilot investigation. Circulation. 2009;120(10):867–875. doi: 10.1161/CIRCULATIONAHA.109.859280. [DOI] [PubMed] [Google Scholar]
- 62.Hoe J, Toh KH. First experience with 320-row multidetector CT coronary angiography scanning with prospective electrocardiogram gating to reduce radiation dose. J Cardiovasc Comput Tomogr. 2009;3(4):257–261. doi: 10.1016/j.jcct.2009.05.013. [DOI] [PubMed] [Google Scholar]
- 63.Geleijns J, Salvado Artells M, de Bruin PW, Matter R, Muramatsu Y, McNitt-Gray MF. Computed tomography dose assessment for a 160 mm wide, 320 detector row, cone beam CT scanner. Phys Med Biol. 2009;54(10):3141–3159. doi: 10.1088/0031-9155/54/10/012. [DOI] [PMC free article] [PubMed] [Google Scholar]
- 64.Rybicki FJ, Otero HJ, Steigner ML, Vorobiof G, Nallamshetty L, Mitsouras D, Ersoy H, Mather RT, Judy PF, Cai T, Coyner K, Schultz K, Whitmore AG, Di Carli MF. Initial evaluation of coronary images from 320-detector row computed tomography. Int J Cardiovasc Imaging. 2008;24(5):535–546. doi: 10.1007/s10554-008-9308-2. [DOI] [PubMed] [Google Scholar]
- 65.Siebert E, Bohner G, Dewey M, Masuhr F, Hoffmann KT, Mews J, Engelken F, Bauknecht HC, Diekmann S, Klingebiel R. 320-slice CT neuroimaging: initial clinical experience and image quality evaluation. Br J Radiol. 2009;82(979):561–570. doi: 10.1259/bjr/27721218. [DOI] [PubMed] [Google Scholar]
- 66.Kandel S, Kloeters C, Meyer H, Hein P, Hilbig A, Rogalla P. Whole-organ perfusion of the pancreas using dynamic volume CT in patients with primary pancreas carcinoma: acquisition technique, post-processing and initial results. Eur Radiol. 2009;19(11):2641–2646. doi: 10.1007/s00330-009-1453-z. [DOI] [PubMed] [Google Scholar]
- 67.Hein PA, Romano VC, Lembcke A, May J, Rogalla P. Initial experience with a chest pain protocol using 320-slice volume MDCT. Eur Radiol. 2009;19(5):1148–1155. doi: 10.1007/s00330-008-1255-8. [DOI] [PubMed] [Google Scholar]
- 68.Achenbach S, Marwan M, Schepis T, Pflederer T, Bruder H, Allmendinger T, Petersilka M, Anders K, Lell M, Kuettner A, Ropers D, Daniel WG, Flohr T. High-pitch spiral acquisition: a new scan mode for coronary CT angiography. J Cardiovasc Comput Tomogr. 2009;3(2):117–121. doi: 10.1016/j.jcct.2009.02.008. [DOI] [PubMed] [Google Scholar]
- 69.Joseph PM, Spital RD. The effects of scatter in x-ray computed tomography. Med Phys. 1982;9(4):464–472. doi: 10.1118/1.595111. [DOI] [PubMed] [Google Scholar]
- 70.Haykin SS, Justice JH. Array signal processing. Prentice-Hall; Englewood Cliffs, N.J.: 1985. [Google Scholar]
- 71.Endo M, Mori S, Tsunoo T, Miyazaki H. Magnitude and effects of x-ray scatter in a 256-slice CT scanner. Med Phys. 2006;33(9):3359–3368. doi: 10.1118/1.2239366. [DOI] [PubMed] [Google Scholar]
- 72.Feldkamp L, Davis L, Kress J. Practical cone-beam algorithm. J. Opt. Soc. Am. A. 1984;1(6):612–619. [Google Scholar]
- 73.Wang G, Lin TH, Cheng P, Shinozaki DM. A general cone-beam reconstruction algorithm. IEEE Trans Med Imaging. 1993;12(3):486–496. doi: 10.1109/42.241876. [DOI] [PubMed] [Google Scholar]
- 74.Tzedakis A, Damilakis J, Perisinakis K, Stratakis J, Gourtsoyiannis N. The effect of z overscanning on patient effective dose from multidetector helical computed tomography examinations. Med Phys. 2005;32(6):1621–1629. doi: 10.1118/1.1924309. [DOI] [PubMed] [Google Scholar]
- 75.van der Molen AJ, Geleijns J. Overranging in multisection CT: quantification and relative contribution to dose--comparison of four 16-section CT scanners. Radiology. 2007;242(1):208–216. doi: 10.1148/radiol.2421051350. [DOI] [PubMed] [Google Scholar]
- 76.Deak PD, Langner O, Lell M, Kalender WA. Effects of adaptive section collimation on patient radiation dose in multisection spiral CT. Radiology. 2009;252(1):140–147. doi: 10.1148/radiol.2522081845. [DOI] [PubMed] [Google Scholar]
- 77.Yoshida S, Akiba H, Tamakawa M, Yama N, Hareyama M, Morishita K, Abe T. Thoracic involvement of type A aortic dissection and intramural hematoma: diagnostic accuracy--comparison of emergency helical CT and surgical findings. Radiology. 2003;228(2):430–435. doi: 10.1148/radiol.2282012162. [DOI] [PubMed] [Google Scholar]
- 78.Hayter RG, Rhea JT, Small A, Tafazoli FS, Novelline RA. Suspected aortic dissection and other aortic disorders: multi-detector row CT in 373 cases in the emergency setting. Radiology. 2006;238(3):841–852. doi: 10.1148/radiol.2383041528. [DOI] [PubMed] [Google Scholar]
- 79.Winer-Muram HT, Rydberg J, Johnson MS, Tarver RD, Williams MD, Shah H, Namyslowski J, Conces D, Jennings SG, Ying J, Trerotola SO, Kopecky KK. Suspected acute pulmonary embolism: evaluation with multi-detector row CT versus digital subtraction pulmonary arteriography. Radiology. 2004;233(3):806–815. doi: 10.1148/radiol.2333031744. [DOI] [PubMed] [Google Scholar]
- 80.Stein PD, Fowler SE, Goodman LR, Gottschalk A, Hales CA, Hull RD, Leeper KV, Jr., Popovich J, Jr., Quinn DA, Sos TA, Sostman HD, Tapson VF, Wakefield TW, Weg JG, Woodard PK. Multidetector computed tomography for acute pulmonary embolism. N Engl J Med. 2006;354(22):2317–2327. doi: 10.1056/NEJMoa052367. [DOI] [PubMed] [Google Scholar]
- 81.Kershenovich A, Rappaport ZH, Maimon S. Brain computed tomography angiographic scans as the sole diagnostic examination for excluding aneurysms in patients with perimesencephalic subarachnoid hemorrhage. Neurosurgery. 2006;59(4):798–801. doi: 10.1227/01.NEU.0000232724.19888.C6. discussion 801-792. [DOI] [PubMed] [Google Scholar]
- 82.Silvennoinen HM, Ikonen S, Soinne L, Railo M, Valanne L. CT angiographic analysis of carotid artery stenosis: comparison of manual assessment, semiautomatic vessel analysis, and digital subtraction angiography. AJNR Am J Neuroradiol. 2007;28(1):97–103. [PMC free article] [PubMed] [Google Scholar]
- 83.Sakamoto S, Kiura Y, Shibukawa M, Ohba S, Arita K, Kurisu K. Subtracted 3D CT angiography for evaluation of internal carotid artery aneurysms: comparison with conventional digital subtraction angiography. AJNR Am J Neuroradiol. 2006;27(6):1332–1337. [PMC free article] [PubMed] [Google Scholar]
- 84.Katzberg RW, Haller C. Contrast-induced nephrotoxicity: clinical landscape. Kidney Int Suppl. 2006;(100):S3–7. doi: 10.1038/sj.ki.5000366. [DOI] [PubMed] [Google Scholar]
- 85.Solomon R, Dumouchel W. Contrast media and nephropathy: findings from systematic analysis and Food and Drug Administration reports of adverse effects. Invest Radiol. 2006;41(8):651–660. doi: 10.1097/01.rli.0000229742.54589.7b. [DOI] [PubMed] [Google Scholar]
- 86.Agatston AS, Janowitz WR, Hildner FJ, Zusmer NR, Viamonte M, Jr., Detrano R. Quantification of coronary artery calcium using ultrafast computed tomography. J Am Coll Cardiol. 1990;15(4):827–832. doi: 10.1016/0735-1097(90)90282-t. [DOI] [PubMed] [Google Scholar]
- 87.Liang Z, Karl W, Do S, Hoffmann U, Brady T, Pien H. Calcium De-blooming in Coronary CT Image.. Bioinformatics and Bioengineering, 2007. BIBE 2007. Proceedings of the 7th IEEE International Conference on; 2007.pp. 257–262. [Google Scholar]
- 88.Prat-Gonzalez S, Sanz J, Garcia MJ, Cardiac CT. indications and limitations. J Nucl Med Technol. 2008;36(1):18–24. doi: 10.2967/jnmt.107.042424. [DOI] [PubMed] [Google Scholar]
- 89.Dey D, Lee CJ, Ohba M, Gutstein A, Slomka PJ, Cheng V, Suzuki Y, Suzuki S, Wolak A, Le Meunier L, Thomson LE, Cohen I, Friedman JD, Germano G, Berman DS. Image quality and artifacts in coronary CT angiography with dual-source CT: initial clinical experience. J Cardiovasc Comput Tomogr. 2008;2(2):105–114. doi: 10.1016/j.jcct.2007.12.017. [DOI] [PubMed] [Google Scholar]
- 90.Zhang S, Levin DC, Halpern EJ, Fischman D, Savage M, Walinsky P. Accuracy of MDCT in assessing the degree of stenosis caused by calcified coronary artery plaques. AJR Am J Roentgenol. 2008;191(6):1676–1683. doi: 10.2214/AJR.07.4026. [DOI] [PubMed] [Google Scholar]
- 91.Kong LY, Jin ZY, Zhang SY, Zhang ZH, Wang YN, Song L, Zhang XN, Zhang YQ. Assessment of coronary stents by 64-slice computed tomography: in-stent lumen visibility and patency. Chin Med Sci J. 2009;24(3):156–160. doi: 10.1016/s1001-9294(09)60081-x. [DOI] [PubMed] [Google Scholar]
- 92.Lettau M, Sauer A, Heiland S, Rohde S, Bendszus M, Hahnel S. Carotid Artery Stents: In Vitro Comparison of Different Stent Designs and Sizes Using CT Angiography and Contrast-Enhanced MR Angiography at 1.5T and 3T. AJNR Am J Neuroradiol. 2009 doi: 10.3174/ajnr.A1743. [DOI] [PMC free article] [PubMed] [Google Scholar]
- 93.Motoyama S, Sarai M, Harigaya H, Anno H, Inoue K, Hara T, Naruse H, Ishii J, Hishida H, Wong ND, Virmani R, Kondo T, Ozaki Y, Narula J. Computed tomographic angiography characteristics of atherosclerotic plaques subsequently resulting in acute coronary syndrome. J Am Coll Cardiol. 2009;54(1):49–57. doi: 10.1016/j.jacc.2009.02.068. [DOI] [PubMed] [Google Scholar]
- 94.Cyrus T, Gropler RJ, Woodard PK. Coronary CT angiography (CCTA) and advances in CT plaque imaging. J Nucl Cardiol. 2009;16(3):466–473. doi: 10.1007/s12350-009-9084-y. [DOI] [PubMed] [Google Scholar]
- 95.Rybicki F, Melchionna S, Mitsouras D, Coskun A, Whitmore A, Steigner M, Nallamshetty L, Welt F, Bernaschi M, Borkin M, Sircar J, Kaxiras E, Succi S, Stone P, Feldman C. Prediction of coronary artery plaque progression and potential rupture from 320-detector row prospectively ECG-gated single heart beat CT angiography: Lattice Boltzmann evaluation of endothelial shear stress. Int J Cardiovasc Imaging. 2009;25(Sup. 2):289–299. [Google Scholar]
- 96.Ramkumar PG, Mitsouras D, Feldman CL, Stone PH, Rybicki FJ. New advances in cardiac computed tomography. Curr Opin Cardiol. 2009 doi: 10.1097/HCO.0b013e3283319b84. [DOI] [PubMed] [Google Scholar]
- 97.Kordish I, Philipp S, Boese D, Sack S, Erbel R. [Dissection of the right coronary artery as a complication after the IVUS procedure]. Herz. 2007;32(7):573–577. doi: 10.1007/s00059-007-2900-8. [DOI] [PubMed] [Google Scholar]
- 98.Valgimigli M, Agostoni P, Serruys PW. Acute coronary syndromes: an emphasis shift from treatment to prevention; and the enduring challenge of vulnerable plaque detection in the cardiac catheterization laboratory. J Cardiovasc Med (Hagerstown) 2007;8(4):221–229. doi: 10.2459/01.JCM.0000263487.36993.37. [DOI] [PubMed] [Google Scholar]
- 99.Tobis J, Azarbal B, Slavin L. Assessment of intermediate severity coronary lesions in the catheterization laboratory. J Am Coll Cardiol. 2007;49(8):839–848. doi: 10.1016/j.jacc.2006.10.055. [DOI] [PubMed] [Google Scholar]
- 100.Patil UD, Ragavan A, Nadaraj, Murthy K, Shankar R, Bastani B, Ballal SH. Helical CT angiography in evaluation of live kidney donors. Nephrol Dial Transplant. 2001;16(9):1900–1904. doi: 10.1093/ndt/16.9.1900. [DOI] [PubMed] [Google Scholar]
- 101.Saad WE, Saad N. Computer tomography for venous thromboembolic disease. Radiol Clin North Am. 2007;45(3):423–445. vii. doi: 10.1016/j.rcl.2007.04.011. [DOI] [PubMed] [Google Scholar]
- 102.Johns HE, Cunningham JR. The physics of radiology. 4th ed. Charles C. Thomas; Springfield, Ill., U.S.A.: 1983. [Google Scholar]
- 103.Bushberg JT. The essential physics of medical imaging. 2nd ed. Lippincott Williams & Wilkins; Philadelphia: 2002. [Google Scholar]
- 104.Seeram E. Computed tomography : physical principles, clinical applications & quality control. Saunders; Philadelphia: 1994. [Google Scholar]
- 105.McNitt-Gray MF. AAPM/RSNA Physics Tutorial for Residents: Topics in CT. Radiation dose in CT. Radiographics. 2002;22(6):1541–1553. doi: 10.1148/rg.226025128. [DOI] [PubMed] [Google Scholar]
- 106.Kalender WA, Deak P, Kellermeier M, van Straten M, Vollmar SV. Application- and patient size-dependent optimization of x-ray spectra for CT. Med Phys. 2009;36(3):993–1007. doi: 10.1118/1.3075901. [DOI] [PubMed] [Google Scholar]
- 107.Downes P, Jarvis R, Radu E, Kawrakow I, Spezi E. Monte Carlo simulation and patient dosimetry for a kilovoltage cone-beam CT unit. Med Phys. 2009;36(9):4156–4167. doi: 10.1118/1.3196182. [DOI] [PubMed] [Google Scholar]
- 108.Horiguchi J, Fujioka C, Kiguchi M, Yamamoto H, Kitagawa T, Kohno S, Ito K. Prospective ECG-triggered axial CT at 140-kV tube voltage improves coronary in-stent restenosis visibility at a lower radiation dose compared with conventional retrospective ECG-gated helical CT. Eur Radiol. 2009;19(10):2363–2372. doi: 10.1007/s00330-009-1419-1. [DOI] [PubMed] [Google Scholar]
- 109.Huda W. Dose and image quality in CT. Pediatr Radiol. 2002;32(10):709–713. doi: 10.1007/s00247-002-0796-2. discussion 751-704. [DOI] [PubMed] [Google Scholar]
- 110.Mahesh M. MDCT Physics: The Basics-Technology, Image Quality and Radiation Dose. 1st ed Lippincott Williams & Wilkins; 2009. [Google Scholar]
- 111.Shiraishi J, Tsuda K, Inoue Y, Onoyama Y. Measurement of CT section thickness by using the partial volume effect. Radiology. 1992;184(3):870–872. doi: 10.1148/radiology.184.3.1509082. [DOI] [PubMed] [Google Scholar]
- 112.Lu MT, Ersoy H, Whitmore AG, Lipton MJ, Rybicki FJ. Reformatted Four-Chamber and Short-Axis Views of the Heart Using Thin Section (</=2 mm) MDCT Images. Acad Radiol. 2007;14(9):1108–1112. doi: 10.1016/j.acra.2007.05.019. [DOI] [PMC free article] [PubMed] [Google Scholar]
- 113.McCollough CH, Zink FE. Performance evaluation of a multi-slice CT system. Med Phys. 1999;26(11):2223–2230. doi: 10.1118/1.598777. [DOI] [PubMed] [Google Scholar]
- 114.Sirineni GK, Kalra MK, Pottala K, Waldrop S, Syed M, Tigges S. Effect of contrast concentration, tube potential and reconstruction kernels on MDCT evaluation of coronary stents: an in vitro study. Int J Cardiovasc Imaging. 2007;23(2):253–263. doi: 10.1007/s10554-006-9107-6. [DOI] [PubMed] [Google Scholar]
- 115.Gasparovic H, Rybicki FJ, Millstine J, Unic D, Byrne JG, Yucel K, Mihaljevic T. Three dimensional computed tomographic imaging in planning the surgical approach for redo cardiac surgery after coronary revascularization. Eur J Cardiothorac Surg. 2005;28(2):244–249. doi: 10.1016/j.ejcts.2005.03.024. [DOI] [PubMed] [Google Scholar]
- 116.Yahyavi-Firouz-Abadi N, Wynn BL, Rybicki FJ, Steigner ML, Hussain AZ, Mather R, Hanson EH, Ansarinia M, Orrison WW., Jr Steroid-responsive large vessel vasculitis: application of whole-brain 320-detector row dynamic volume CT angiography and perfusion. AJNR Am J Neuroradiol. 2009;30(7):1409–1411. doi: 10.3174/ajnr.A1532. [DOI] [PMC free article] [PubMed] [Google Scholar]