Abstract
Alcoholic chronic pancreatitis (ACP) is characterized by pancreatic necrosis, inflammation, and scarring, the latter of which is due to excessive collagen deposition by activated pancreatic stellate cells (PSC). The aim of this study was to establish a model of ACP in mice, a species that is usually resistant to the toxic effects of alcohol, and to identify the cell type(s) responsible for production of connective tissue growth factor (CTGF), a pro-fibrotic molecule. C57Bl/6 male mice received intraperitoneal ethanol injections for three weeks against a background of cerulein-induced acute pancreatitis. Peak blood alcohol levels remained consistently high in ethanol-treated mice as compared to control mice. In mice receiving ethanol plus cerulein, there was increased collagen deposition as compared to other treatment groups as well as increased frequency of α-smooth muscle actin and desmin-positive PSC which also demonstrated significantly enhanced CTGF protein production. Expression of mRNA for collagen α1(I), α-smooth muscle actin or CTGF were all increased and co-localized exclusively to activated PSC in ACP. Pancreatic expression of mRNA for key profibrotic markers were all increased in ACP. In conclusion, a mouse model of ACP has been developed that mimics key pathophysiological features of the disease in humans and which shows that activated PSC are the principal producers of collagen and CTGF. PSC-derived CTGF is thus a candidate therapeutic target in anti-fibrotic strategies for ACP.
Keywords: Connective tissue growth factor, fibrosis, pancreas
Chronic pancreatitis stems from relapsing episodes of acute pancreatitis1 and is characterized by destruction of acinar tissue, a sustained pancreatic inflammatory response, and fibrosis2, 3. While development of chronic pancreatitis is strongly associated with heavy alcohol consumption, only a small percentage of heavy drinkers actually develop the disease4–7, suggesting that other predisposing factors (e.g. genetics, environment, injury) must also be present for disease progression. Pancreatitis is responsible for approximately 3500 deaths each year in the USA, 16% of which are due to chronic disease with about half of those deaths due to alcohol8.
Although the pathophysiology of chronic pancreatitis remains poorly understood9, pancreatic stellate cells (PSC) are believed to play a central role in the initiation and progression of the fibrotic response10. Under normal circumstances PSC remain quiescent but after pancreatic injury they become activated and transition to a myofibroblast-like, alpha-smooth muscle actin (α-SMA)-positive cell type that is capable of depositing large quantities of fibrillar collagen in the interstitial spaces11, 12. The effects of alcohol exposure on PSC function have been largely deduced from in vitro studies and from analysis of human pathological specimens. Studies of the mechanisms of alcohol on PSC function in vivo remain ambiguous and are confounded by the fact that a good animal model of alcoholic chronic pancreatitis (ACP) does not yet exist9, 13.
Connective tissue growth factor (CTGF; also known as CCN2) is a member of the CCN family of proteins14, 15, which associates with components of the extracellular matrix or cell surface integrins16 and regulates cellular processes such as, adhesion, migration, mitogenesis and differentiation15. Although CTGF plays an important role in vertebrate development17–19, it is weakly expressed in adult connective tissues except during wound healing, tissue regeneration, cancer or fibrosis16. A role for CTGF in pancreatic fibrosis was first proposed from studies that demonstrated CTGF over-expression in acute necrotizing pancreatitis20, 21 and in desmoplastic regions of pancreatic cancer22. In in vitro studies, activated PSC have been shown to co-express CTGF, transforming growth factor beta-1 (TGF-β1), collagen 1 and other extracellular matrix proteins23, 24, and to synthesize CTGF after exposure to ethanol or acetaldehyde25. However, data showing that CTGF is expressed by activated PSC in ACP in vivo are lacking.
We have produced a rapid and efficient model of ACP in mice that mimics key pathophysiological features of the human form of the disease and which demonstrates that activated PSC are a principal source of CTGF in ethanol-induced pancreatic fibrosis.
Materials and Methods
Animal Model
All animal procedures were approved by the Institutional Animal Care and Use Committee of The Research Institute at Nationwide Children’s Hospital (Columbus, OH). Male C57Bl/6 mice 6–8 weeks old were injected with ethanol (3.2 g/kg; administered in a 33.3% ethanol: 67.7% water solution) i.p. one time per day, six times per week, for three weeks. On one day each week, some mice also received an i.p. injection of cerulein every hour for six hours. (50 µg/kg; Sigma Chemical Co., St. Louis, Missouri). Control mice received either ethanol alone, cerulean alone, or water alone (n=6 per group). Mice were housed three to a cage and fed a low-fat diet ad libitum. Twice weekly, serum samples were collected one hour after ethanol administration for assessment of peak blood alcohol levels (BAL). Mice were sacrificed two days after the last ethanol treatment and pancreata were removed prior to fixation in 4% paraformaldehyde (pH 7.2–7.4) or for RNA extraction, as described below.
Blood Alcohol Levels (BAL)
Peak BAL were measured using an Ethanol-L3K assay (Diagnostic Chemicals Limited, Oxford, CT). NADH produced in the assay reaction was quantified by measuring absorption at 340nm with a SpectraMax M2 Microplate Reader (Molecular Devices, Sunnyvale, CA).
Histology
Fixed pancreatic tissues were embedded in paraffin, cut into 4µm sections and stained with haemotoxylin-eosin for standard histological examination. Collagen staining was performed using acidified 0.1% Sirius red F3B (Pfalz & Bauer, Waterbury, CT) as described26, 27. Immunohistochemical staining for α-SMA or F4/80 was performed using, respectively, monoclonal mouse-anti human α-SMA (1:100, Dako Cytomation, Denmark) or anti-mouse F4/80 antigen (1:100, eBioscience, San Diego, CA), followed by development with UltraTek Anti-Polyvalent, UltraTek HRP and AEC chromogenic substrate (all from ScyTek Laboratories, Logan, UT). Double immunofluorescent detection of α-SMA and CTGF or α-SMA and desmin was achieved by incubation of sections with anti-α-SMA (see above) and NH1 anti-CTGF IgY (5 µg/ml; an in-house antibody raised in chickens against recombinant human CTGF) or α-SMA and desmin (H:76) (1:50, Santa Cruz Laboratories, Santa Cruz, CA) followed by incubation with Alexa Fluor® 647 goat-anti mouse IgG (1:1000, Invitrogen, Carlsbad, CA) and goat-anti chicken Ig-Biotin (1:400, Santa Cruz Laboratories, Santa Cruz, CA) or Alexa Flour® 647 goat-anti mouse IgG and Alexa Fluor® 488 goat-anti rabbit IgG (1:1000, Invitrogen, Carlsbad, CA) for 1 hour at room temperature. Slides were incubated with Fluorescent NeutrAvidin™ (1:200, Invitrogen, Carlsbad, CA), mounted with Vectashield Mounting Medium with DAPI (Vector Laboratories, Burlingame, CA), and examined by confocal laser microscopy (LSM510, Carl Zeiss Co. Ltd, Jena, Germany) using an oil-immersion objective lens (Plan-Apochromat 63×/NA = 1.4).
In situ Hybridization
Total RNA was extracted from cultured murine PSC with RNA STAT-60 (Tel-Test, Inc., Friendswood, TX) following the manufacturer’s instructions as previously described25. Aliquots of 4 µg of total RNA were reverse transcribed using a SuperScript II Reverse Transcriptase kit (Invitrogen, Carlsbad, CA). The cDNA was then amplified by polymerase chain reaction using primers specific for α-SMA: 5’CTACTGCCGAGCGTGAGATTGTCC3’ (sense) and 5’AGGGCCCAGCTTCGTCGTATTC3’ (antisense) (497 bp); collagen α(I): 5’GACGTCCCTGGTGAAGTTGGT3’ (sense) and 5’AGCCACGATGACCCTTTATG3’ (antisense) (587 bp); or CTGF: 5’ AGTGGAGATGCCAGGAGAAA3’ (sense) and 5’ACCTGCACAGCATTTGTTTG3’ (antisense) (540 bp). Following initial denaturation at 94°C for 2 min, the samples were amplified by 35 cycles of denaturation at 94°C for 30 s, annealing at 60°C (62°C for CTGF or 65°C for α-SMA) for 40 s, extension at 72°C for 90 s, and ended by extension at 72°C for 10 min. The PCR reaction products were separated on 1.5% agarose gels and then gel extraction was performed using QIAquick Gel Extraction (QUIAGEN, Valencia, CA). Gel extraction products were subcloned into the pCR®II-TOPO® transcription vector (Invitrogen, Carlsbad, CA) according to the manufacturer’s protocol and sequenced using the M13R sequencing primer.
Antisense and sense RNA probes labeled with digoxignein-UTP or Biotin-UTP were generated by in vitro transcription of linearized plasmids with SP6 and T7 RNA polymerases (Roche Molecular Biochemicals, Mannheim, Germany) according to manufacturer’s protocol. The digoxigenin-labeled RNA was localized using Anti-digoxignenin-fluorescein, Fab fragments (Roche Molecular Biochemicals, Mannheim, Germany). Biotin labeled RNA was localized using avidin, NeutrAvidin®, Texas Red® (Invitrogen, Carlsbad, CA). Finally, slides were washed and mounted with Vectashield Mounting Medium with DAPI (Vector Laboratories, Burlingame, CA) and examined by confocal laser microscopy (LSM510, Carl Zeiss Co. Ltd, Jena, Germany) using an oil-immersion objective lens (Plan-Apochromat 63×/NA = 1.4).
Real-time PCR
Pancreata were removed and immediately immersed in RNAlater (QUIAGEN, Valencia, CA). RNA was extracted using RNeasy Plus Mini Kit (QUIAGEN, Valencia, CA) according to the manufacturer’s protocol. Aliquots of 4 µg of total RNA were reverse transcribed using a SuperScript II Reverse Transcriptase kit (Invitrogen, Carlsbad, CA). Quantification of pancreatic mRNA levels of key marker genes was achieved by quantitative real-time PCR (ABI PRISM 7000 Sequence Detection System, Applied Biosystems, Foster City, CA) using the following protocol: 95°C for 10 min, followed by 40 cycles of 95°C for 15 s and 60°C for 1 min, then 95°C for 15s followed by a dissociation step of 60°C for 20 s and 95° for 15s. Each reaction was run in duplicate and all samples were normalized to GAPDH. PCR amplification was carried out in a 25 µl reaction containing .02µg cDNA, 12.5µl SYBR green PCR Master Mix (Applied Biosystems, Foster City, CA), 0.16µM of each primer set. The primer sequences were as follows: CTGF: 5’CACTCTGCCAGTGGAGTTCA3’ (sense) and 5’AAGATGTCATTGTCCCCAGG3’ (antisense); TGF-β1: 5’GGTTCATGTCATGGATGGTGC3’ (sense) and 5’TGACGTCACTGGAGTTGTACGG3’ (antisense); αSMA: 5’GGCTCTGGGCTCTGTAAGG3' (sense) and 5’CTCTTGCTCTGGGCTTCATC3' (antisense); Collagen α1(I): 5’GCCCGAACCCCAAGGAAAAGAAGC3’ (sense) and 5’CTGGGAGGCCTCGGTGGACATTAG3’ (antisense); Collagen α1(II): 5’CAAGGCCCCCGAGGTGACAAAG3’ (sense) and 5’GGGGCCAGGGATTCCATTAGAGC3’ (antisense); Collagen α1(III): 5’TCCCCTGGCTCAAATGGCTCAC3’ (sense) and 5’GCTCTCCCTTCGCACCGTTCTT3’ (antisense); Collagen α1(IV): 5’TCTGCCCTCCTGCGACCTGT3’ (sense) and 5’CGTCTGCCCGCCCTTGTTTC3’ (antisense); TIMP1: 5’TCTGGCATCTGGCATCCTCTTGTT3’ (sense) and 5’CTTCACTGCGGTTCTGGGACTTGT3’ (antisense); TIMP2: 5’GATTCTGCCCCCTCCCCTATTTTC3’ (sense) and 5’GGCCGGCTACACAGTCTTACAACA3’ (antisense); MMP2: 5’CGTCTGCCCGCCCTTGTTTC3’ (sense) and 5’TGCACGGCGATCCCCTTACTCTAC3’ (antisense); α1-integrin: 5’CCGGCCAGGTCGTCATCTACAAG3’ (sense) and 5’CCAGGGGAGCTCCAATCACGAC3’ (antisense); α5-integrin: 5’CTTAGAATCCGAGACTGGGC3' (sense) and 5’TCAGGACAAATCCCAAACAA3' (antisense); α6-integrin: 5’ACCGCTGCTGCTCAGAATAT3' (sense) and 5’AGCCAGGAGGATGATCCAC3' (antisense); β1-integrin: 5’AGAAGCTCCGGCCAGAAGACATTA3’(sense) and 5’CCAGCAAAGTGAAACCCAGCATCC3’ (antisense); DDR2: 5’GTGTGGGCCTTTGGGGTGACTCT3’ (sense) and 5’ATGGCCGGTGCTTGGTTTCTCTTC3’ (antisense); and GAPDH: 5’TGCACCACCAACTGCTTAGC3’ (sense) and 5’GGCATGGACTGTGGTCATGAG3’ (antisense).
Statistical analysis
Values represent mean ± s.e.m. of all measurements. Statistical analysis of the data was performed using SigmaPlot 11.0. The Student’s t test was used for paired data that were normally distributed. A P value of <.05 was considered significant.
Results
Mouse model of alcohol-induced pancreatitis
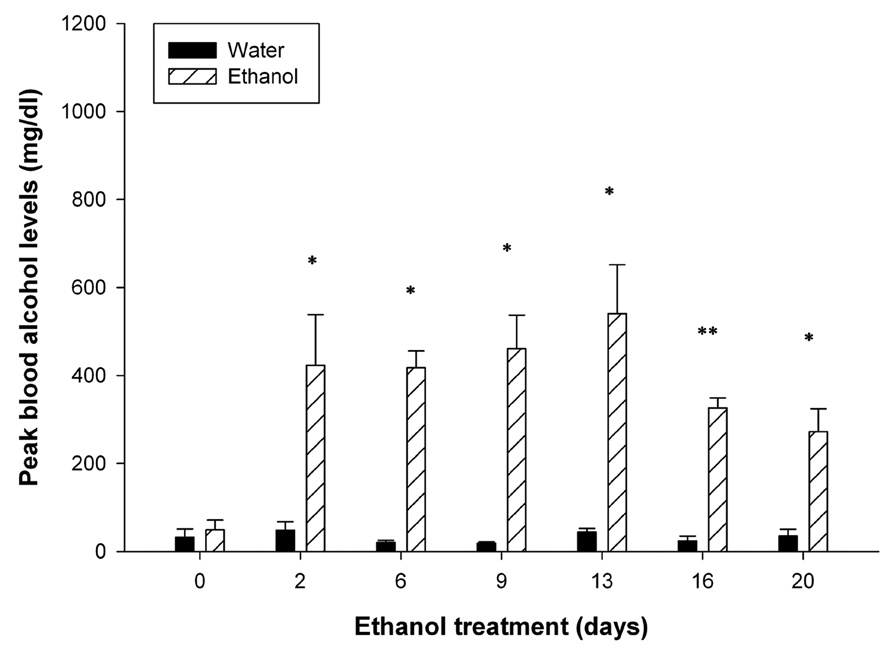
Since there is limited information regarding the effect of chronic administration of intoxicating amounts of ethanol on pancreatic pathophysiology in mice, we developed a protocol in which C57Bl/6 mice received daily injections of ethanol for 6 days per week over a 3-week period. This dosing regimen was administered either in normal mice or mice that also received cerulean treatment once per week to induce recurrent acute pancreatitis. Within minutes after ethanol injection, all of the mice showed physiological signs of intoxication where motor activity, especially of the hind limbs, was highly suppressed for at least four hours. Over the 3-week dosing period, some of the mice began to show alcohol tolerance and normal motor activity was resumed within an hour of ethanol administration. In ethanol treated mice, BALs remained consistently high at all time points and significantly higher (P < 0.05) than mice which received water instead (Figure 1). BALs were higher during the first two weeks of ethanol treatment as compared to the last week, consistent with acquisition of tolerance. In ethanol-treated animals, there was no difference in peak BALs between mice receiving cerulein as compared to those receiving vehicle alone (data not shown).
Figure 1. Peak blood alcohol levels.
BALs were assessed within 1 hour of ethanol administration. During the first two weeks of ethanol administration, mean peak BALs remained above 400 mg/dl and dropped during the last week of treatment to 300–400 mg/dl. Peak BALs in mice receiving water remained consistently low throughout the duration of the experiment. *P < 0.05, **P < 0.001
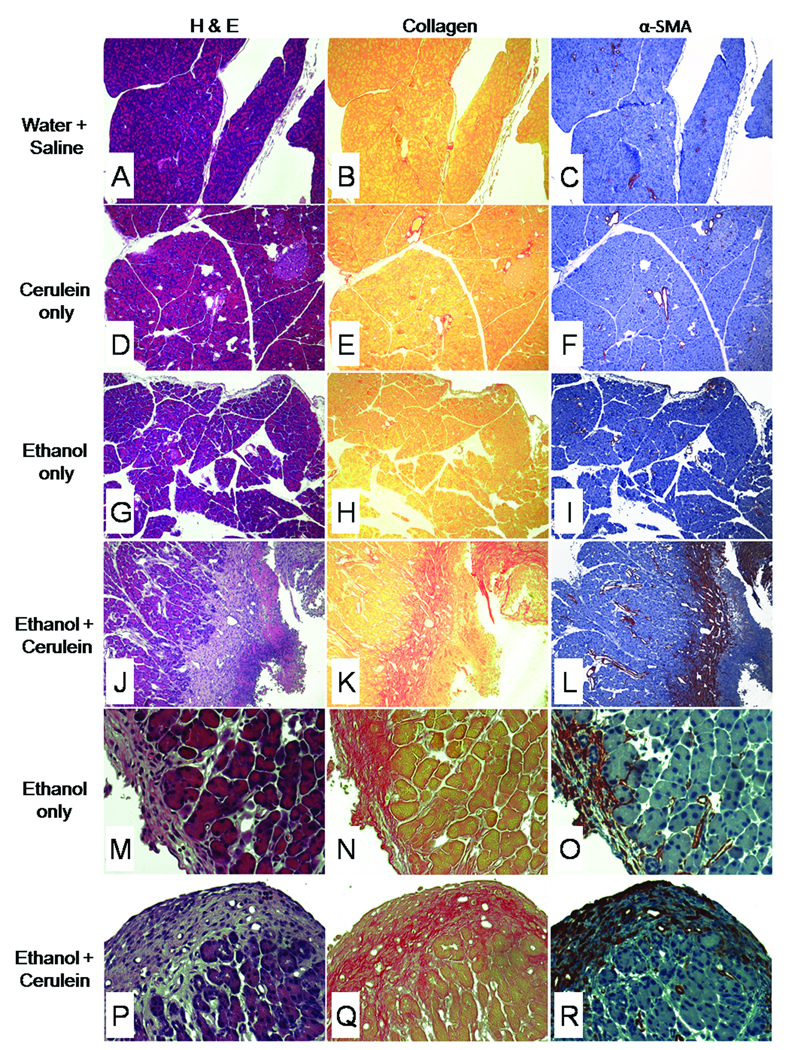
Livers taken from all groups appeared histologically normal (data not shown) and individual treatments of water/saline or cerulein alone did not result in pancreatic fibrosis (Figure 2A,B, D,E). Mice that received ethanol alone exhibited some pancreatic fibrosis, but this was typically confined to isolated areas of peripheral fat tissue (Figure 2G,H,I,N). On the other hand, mice that received both ethanol plus cerulein demonstrated many features of chronic pancreatitis that included loss of parenchymal structure and extensive areas of parenchymal fibrosis which was both perilobular and intralobular in nature (Figure 2J,K) and also apparent in peripheral fat (Figure 2P,Q). While acinar damage and collagen deposition were very evident, these features did not occur uniformly throughout each tissue section, with some areas retaining their normal structure.
Figure 2. Histological changes in mouse pancreatic tissues after chronic administration of ethanol.
Mice (n= 6 per group) received water/saline (A–C), cerulein alone (D–F), ethanol alone (G–I, M–O) or ethanol plus cerulein (J–L, P–R) for 3 weeks as described in Materials and Methods. Pancreatic tissue sections were subsequently stained with H&E (A,D,G,J,M,P), Sirius red (B,E,H,K,N,Q) or anti- α-SMA (C,F,I,L,O,R). Pancreata from mice that were treated with water/saline (A–C), cerulein alone (D–F) showed no overt pathology, with no evidence of increased collagen deposition or increased α-SMA production. In these mice, collagen and α-SMA were restricted to, respectively, the supporting structure and smooth muscle lining of the vasculature. Mice treated with ethanol alone showed no overt pathology other than minor collagen deposition and αSMA staining in focal areas of peripheral fat tissue (M–O), which was also seen in mice treated with ethanol plus cerulein (P–R). In contrast, pancreata of mice treated with ethanol plus cerulein (J–L) showed massive collagen deposition and a highly correlated and intense amount of α-SMA staining in and around areas of acinar degeneration and necrosis. (x100:A–L, x400:M–R).
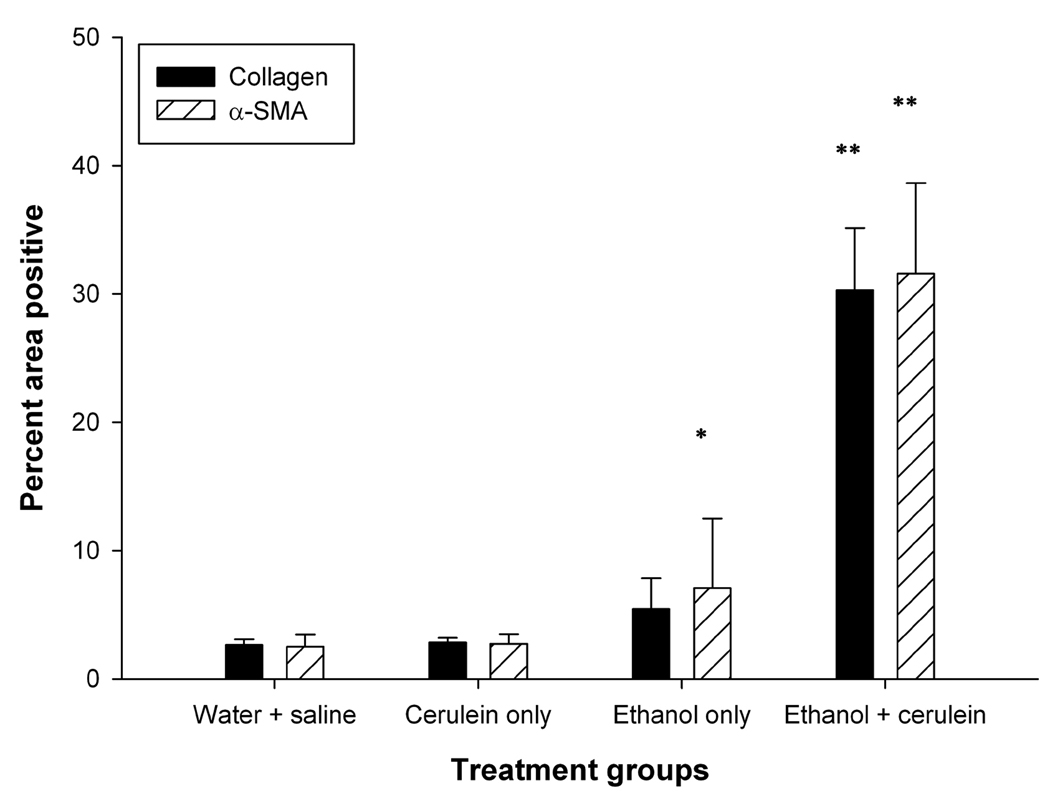
α-SMA immunoreactivity was restricted to the smooth muscle vasculature in mice that received water/saline or cerulein alone (Figure 2C,F). In contrast, extensive α-SMA staining of myofibroblastic cells (i.e. presumptive activated PSCs) was seen in parenchymal tissue surrounding areas of necrosis of animals receiving both ethanol plus cerulein together (Figure 2L). These infiltrating myofibroblasts were also present in the peripheral fat tissue of mice that received either ethanol alone or ethanol plus cerulein (Figure 2O,R). As shown in Figure 2K–L, accumulation of α-SMA-positive cells was closely associated with areas of collagen deposition. The increase in α-SMA-positive cells or collagen deposition in treated animals was further quantified by image analysis of the stained slides. The area of positive collagen deposition or α-SMA-positive cells was significantly increased (>30%; P < 0.001) in animals receiving ethanol plus cerulein as compared to all other treatment groups. The increase in α-SMA-positive cells was only significant (P < 0.05) in animals receiving ethanol alone as compared to either cerulean alone or water/saline groups (Figure 3).
Figure 3. Image analysis of collagen or α-SMA staining.
Quantification was performed by image analysis of 30 representative images (x200) from 3 animals per treatment group by ImagePro Plus software. Collagen and α-SMA staining were increased significantly in pancreata from animals treated with ethanol plus cerulein as compared to pancreata from all other treatment groups. Staining differences were not statistically significant for either water + cerulein vs water + saline or ethnaol + saline vs water + saline. *P < 0.05, **P < 0.001
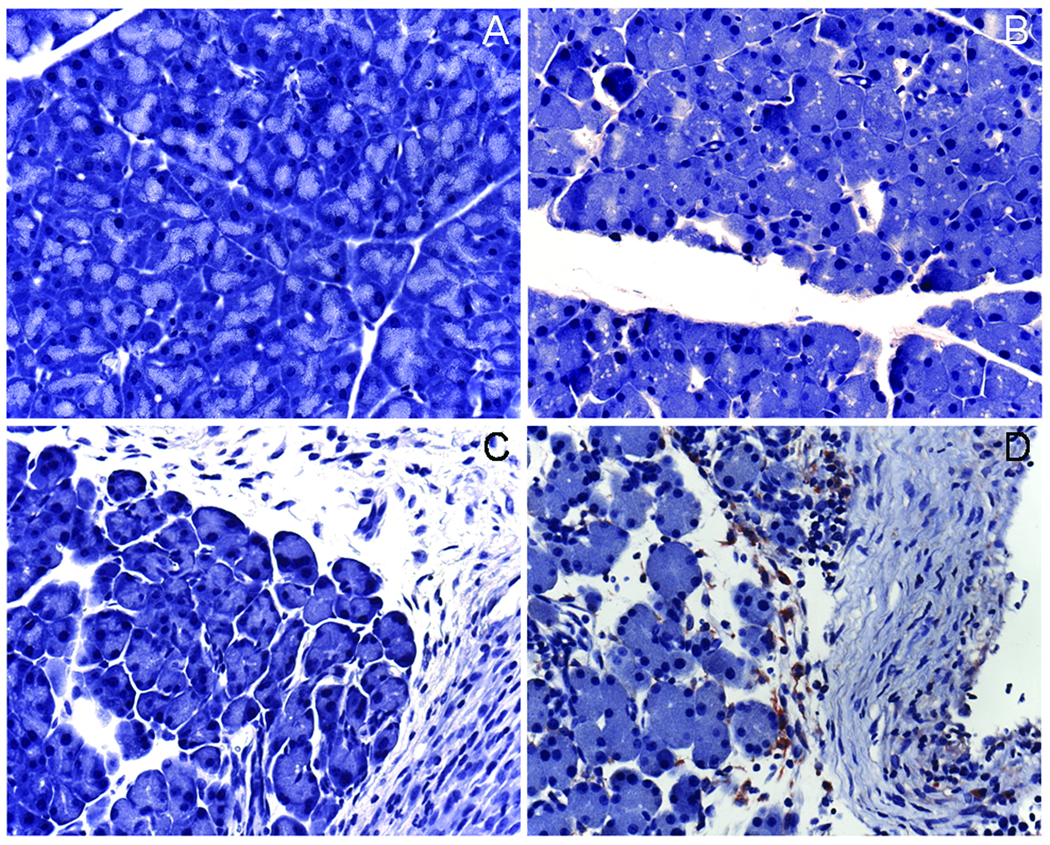
Animals receiving water/saline, cerulein alone or ethanol alone did not exhibit activated macrophage infiltration as demonstrated by F4/80 immunohistochemical staining (Figure 4A–C), whereas animals receiving both ethanol and cerulein showed persistent infiltration of mononuclear cells (activated macrophages) in areas of fibrosis and necrosis (Figure 4D).
Figure 4. Macrophage infiltration in diseased animals.
Mice (n= 6 per group) received water/saline (A), cerulein alone (B), ethanol alone (C) or ethanol plus cerulein (D) for 3 weeks as described in Materials and Methods. Pancreatic tissue sections were subsequently stained with anti-F4/80 to detect the presence of activated macrophages. Positive staining was only detected in animals receiving ethanol plus cerulein (D) and was localized to areas of fibrosis within perilobular fat tissue and the intralobular spaces (x400).
Taken together, these data show that the mice which received ethanol plus cerulean demonstrated typical features of human ACP including parenchymal loss, sustained inflammatory response, myofibroblast accumulation, and extensive fibrosis.
Co-production of collagen and CTGF by activated PSC
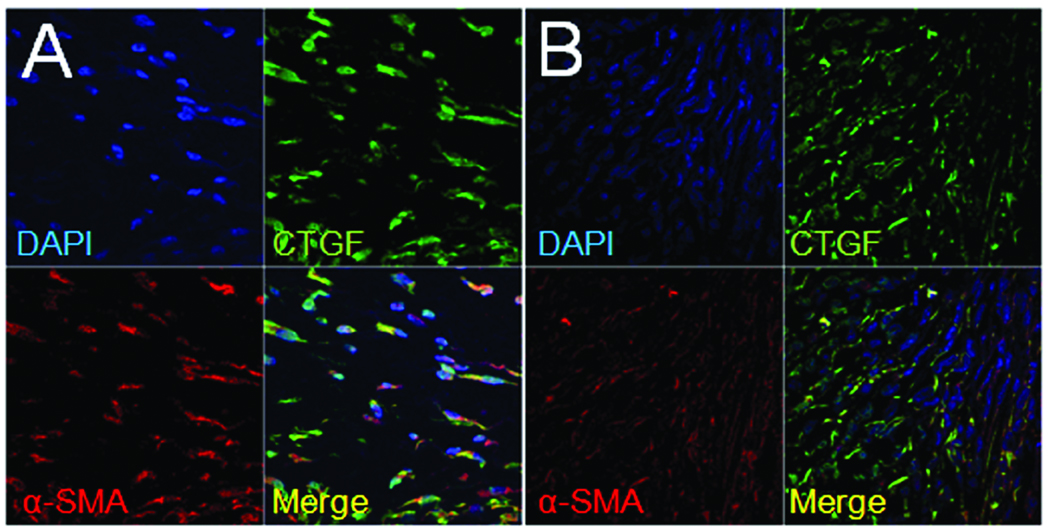
To verify that presumptive activated PSC were a principal source of collagen in the mouse ACP model, in situ hybridization was undertaken to assess mRNA localization for collagen α1(I) or α-SMA. When the same tissue sections were co-stained for each molecule and assessed by confocal microscopy, the merged fluorescent images clearly showed that collagen α1(I) mRNA and α-SMA mRNA localized to the same cell (Figure 5B).
Figure 5. Co-localization of CTGF mRNA and collagen α1(I) mRNA to α-SMA mRNA-positive cells.
In animals receiving both ethanol plus cerulein, confocal microscopy demonstrated that CTGF (A) and collagen α1(I) (B) mRNA were co-localized to areas of α-SMA mRNA (i.e. presumptive activated PSC) in areas of intense fibrosis within the pancreatic parenchyma. Co-localization of CTGF, collagen α1(I) and α-SMA mRNA was also observed in the fibrotic regions in peripheral fat (see Fig 2M–R) in mice receiving either ethanol plus cerulean or ethanol alone (data not shown). (x630).
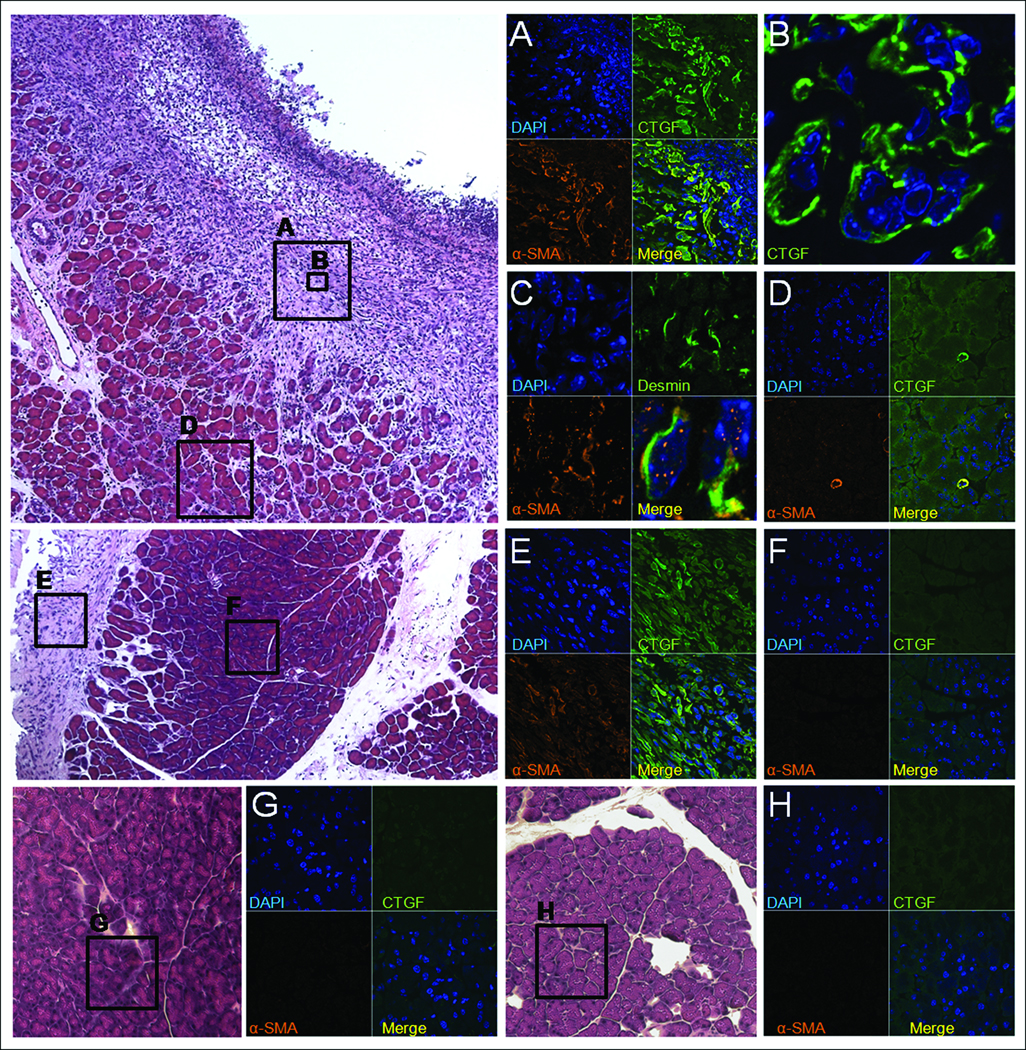
Next, since CTGF is strongly implicated in pancreatic fibrosis and has been shown to be produced in activated PSC in vitro10, we further analyzed the sections for the presence of CTGF protein or mRNA. As assessed by immunofluorescent staining with anti-CTGF IgG, CTGF was present in all treatment groups within the vasculature (data not shown) as previously documented in several other normal tissues and organs28. However, CTGF protein was additionally localized to the collagen-rich areas adjacent to necrotic parenchymal tissue in mice that received ethanol plus cerulein (Figure 6A) as well as to the peripheral fat in these mice (data not shown) or in mice receiving ethanol alone (Figure 6E). When tissue sections from fibrotic mice were further analyzed by double staining with either CTGF and α-SMA antibodies or CTGF and α-SMA mRNA probes, the merged confocal images showed that both molecules were localized to the same cells at the protein (Figure 6A) and mRNA (Figure 5A) level. Normal parenchymal tissue in either control mice or from the unaffected regions in mice receiving ethanol or ethanol plus cerulein failed to demonstrate any staining for CTGF (Figure 6D–H). Since desmin is produced by both activated and queiscent PSC10, it was of interest to determine whether the α-SMA-positive cells in fibrotic regions were also desmin-positive. Double immunofluorescent staining for α-SMA and desmin demonstrated that these proteins did indeed co-localize to the same cells (Figure 6C) although high power analysis of the merged images revealed that the signals within each cell did not overlap with one another (Figure 6C, lower right) consistent with their different intracellular distribution. Collectively, the data revealed an intimate relationship between collagen α1(I), α-SMA, desmin, and CTGF in that expression of these key markers in alcoholic pancreatic fibrosis was characteristic of activated PSC.
Figure 6. Immunohistochemical co-localization of CTGF, α-SMA and desmin to presumptive activated PSC.
Pancreata from mice receiving ethanol plus cerulein (A–D), ethanol alone (E–F), cerulein alone (G) or water/saline (H) were processed by immunofluoresent staining to detect CTGF, α-SMA or desmin. Confocal microscopy of animals receiving ethanol plus cerulein demonstrated co-localization of CTGF and α-SMA in presumptive activated PSC in areas of fibrosis adjacent to areas of necrosis (A–B). Cells positive for α-SMA were also positive for desmin (C), although both proteins were localized to different regions of the same cell, as expected. In non-fibrotic areas of the pancreata from these mice, CTGF and α-SMA expression were only detected in blood vessels (D). In animals receiving ethanol alone, CTGF and α-SMA were expressed only in areas of peripheral fat tissue (E) whereas pancreatic parenchymal tissue did not express CTGF or α-SMA (F). (A,D–H) x630; (B) x630 with x3 zoom; (C) x630 with x4 zoom, except bottom right picture which is x3.5 magnification of original merged panel.
Changes in mRNA expression of fibrotic markers in ACP
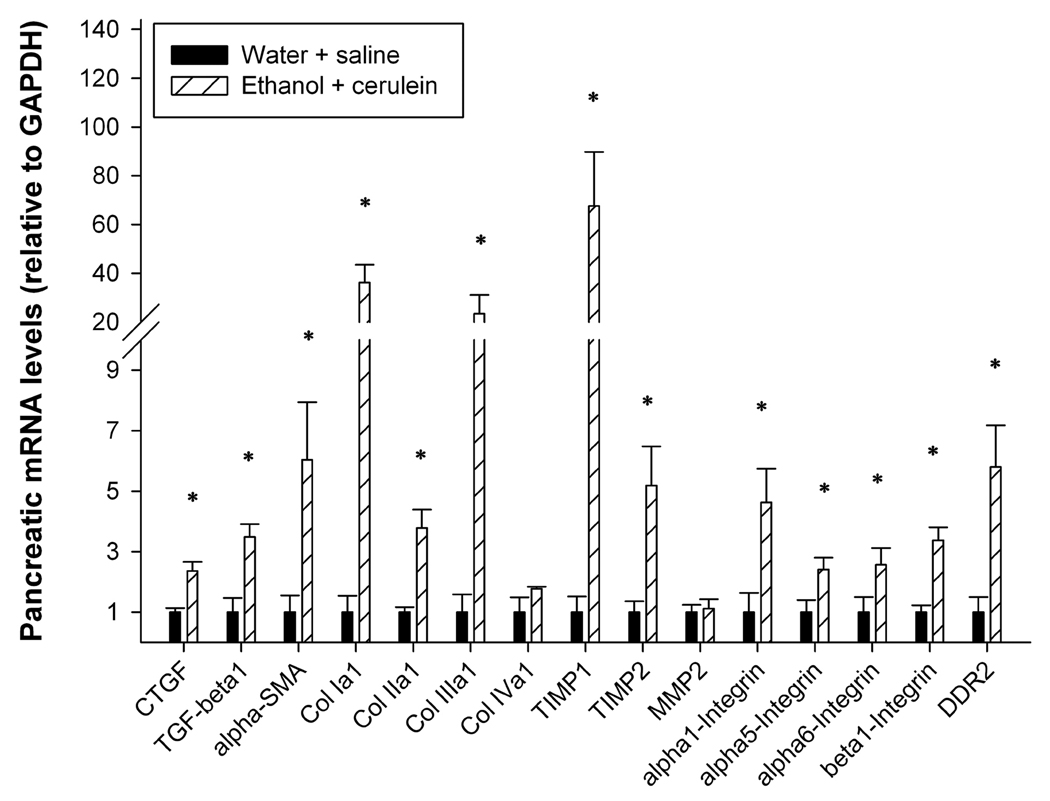
To verify that ACP in mice resulted in the expected changes in mRNA expression of key profibrotic molecules, quantitative real-time PCR was performed on total pancreatic RNA isolated from animals that received either water plus saline or ethanol plus cerulein. In support of the data shown in Fig 2–Fig 6, expression of mRNA for CTGF, α-SMA, or collagen α1(I) was significantly increased (Figure 7). Similarly, the expression of TGF-β1, collagen α1(II), collagen α1(III), tissue inhibitors of metalloproteases-I and –II, discoidin domain receptor 2, and the integrin α1, α5, α6 and β1 subunits in fibrotic mice was also significantly increased increased relative to control mice (P < 0.05) (Figure 7). Expression of collagen α1 (IV) or matrix metalloprotease-II was not significantly changed (Figure 7).
Figure 7. Pancreatic expression of fibrosis-related genes.
Quantitative real-time PCR was performed on total pancreatic RNA isolated from mice that received either ethanol plus cerulean or water/saline (n=6 per group). *P < 0.05l
Discussion
Both acute and chronic pancreatitis are associated with long-term heavy alcohol consumption. Acute pancreatitis is characterized by pain, edema, hemorrhage, acinar cell vacuolation, necrosis and increased serum amylase and lipase; these events are confounded in the chronic form of the disease by fibrosis, inflammation, calcification and decreased exocrine and endocrine function. One theory for the development of chronic pancreatitis is the necrosis-fibrosis hypothesis1, which proposes that the disease originates from repeated tissue injury due to recurrent episodes of acute pancreatitis. This has been further developed to also recognize a potential sentinel acute pancreatitis event29 which initiates activation of the immune system, mainly in the form of activated myofibroblasts (including PSC) and infiltrating monuclear cells. Through their release and action of cytokines, chemokines and other stimulatory factors, PSC are proposed to exist in a persistently activated form10 and to promote fibrosis30, 31 through their unrelenting production and deposition of collagen.
Whereas chronic pancreatitis in humans is frequently due to excessive alcohol consumption, this etiology has proven challenging to study in mice, even though the diverse genetic backgrounds offered by this species would potentially allow important insight into the underlying pathologic mechanisms of this disease. Several models of chronic pancreatitis in mice rely on administration of cerulein alone, but there is uncertainty as to the relevance of these models as it relates to alcohol-mediated injury. The development of a mouse model is particularly difficult because mice metabolize ethanol at a rate of up to 550 mg/kg/h as opposed to 100 mg/kg/h in humans32 and, like humans, mice rarely develop fibrosis upon ethanol administration alone33. Peak BALs may also be a more important factor in assessing potential tissue damage than actual ethanol dose administered because of varying metabolic differences34, 35 and mice are considered to be heavily intoxicated when peak BALs are 400–500 mg/dL36. While intragastric ethanol infusion of mice is able to achieve high BALs36, this approach is costly, labor-dependent, time consuming, and not readily amenable to most researchers. Ethanol-containing diets have also been employed in mice and rats but these too are labor-dependent, time consuming33, 37, 38, and are particularly problematic because heavy intoxication is rarely achieved13.
In this study, we developed a new model of ACP in mice to complement our previous studies of the role of CTGF in pancreatitis21 and PSC biology25, 39, 40. Important features of this model were (i) ethanol administration; (ii) achievement of high, intoxicating peak BAL; (iii) a background of recurrent acute pancreatitis against which the effects of ethanol could be evaluated; and (iv) pathophysiology consistent with human ACP. The data reported herein demonstrate that all of these criteria were met in the mouse model described which was also reproducible, time- and cost-efficient. The overall strategy was to adopt a “dual-hit” approach in which acute episodes of cerulein-induced pancreatitis sensitized the pancreas to severe damage by chronic ethanol exposure. Moreover, administration of the extremely high doses of ethanol resulted in peak BALs that were of the magnitude required to be intoxicating in this otherwise highly resistant species. Careful analysis of the pancreata obtained from mice treated in this manner, as compared to mice receiving control treatments such as alcohol alone or cerulein alone, showed a highly reproducible pathogenesis that was typified by persistent mononuclear cell (activated macrophages) infiltration, parenchymal loss, necrosis, accumulation of α-SMA-positive myofibroblasts (i.e. presumptive activated PSC), and fibrosis.
Histochemical findings confirmed that αSMA-positive cells were located in fibrotic areas adjacent to regions of acinar necrosis and that the same cells were positive for the production of desmiin, collagen and CTGF. These cells, which presumably comprise the activated PSC population (although resident myofibroblasts cannot be excluded), thus appear to be the principal pro-fibrogenic cell types in murine ACP in as much as they were the main producers of both CTGF and collagen. This finding is consistent with studies of human ACP20.
In a previous study, C3H mice developed pancreatic fibrosis after receiving the Lieber-DeCarli ethanol diet for eight weeks coupled with i.p cerulein injections delivered on alternating days for the last one to five weeks33. It is notable that this regimen is not applicable to the C57Bl/6 mice used in our study because, even in the absence of ethanol, administration of cerulein three times a week to C57Bl/6 mice results in profound pancreatic fibrosis (data not shown). In fact the authors of the earlier study33 reported that in C3H mice cerulein alone caused PSC activation and increased expression of TGF-β1 and TIMP-1 which, although transient in nature, may confound the study of ethanol-specific effects in some studies. It is also important to recognize that genetic background strongly influences susceptibility to develop pancreatic fibrosis and, accordingly, the development and validation of more than one mouse model of ACP is a definite advantage given the numerous mouse strains that are available to study. Nonetheless, our model offers several advantages including the fact that severe ethanol-mediated pancreatic pathology develops within a short time frame (3 weeks) and that key features of ACP – profound intralobular and perilobular fibrosis, sustained inflammation, necrosis, and parenchymal loss – are readily manifested. The short time frame of our protocol substantially reduces animal housing costs and allows for more efficient data collection and analysis. Finally, when animals are maintained on the Lieber-DeCarli diet, feeding must be strictly monitored for caloric intake, specialized feeding equipment is required, each animal must be housed singly, and water intake is not allowed9, whereas our model offers the advantages that there is no need for ingestion of an isocaloric diet, ethanol intake can be exquisitely controlled by simple i.p. injection, mice can be maintained three to a cage on normal low-fat diets where each animal is able to drink water and feed ad libitum, and animal husbandry is overall more efficient and cost-effective.
The damaging effects of alcohol on the pancreas are significant and multi-faceted, at least in part because ethanol is locally metabolized, generating toxic metabolites that cause or exacerbate pancreatic injury. Whereas pancreatic acinar cells have been well characterized in terms of their ability to metabolize ethanol via either oxidative and non-oxidative pathways41, data are also available which support a role for PSC in either metabolizing ethanol or functionally responding to ethanol metabolites. For example, we have shown that ethanol or acetaldehyde stimulate CTGF promoter activity and CTGF protein production in rat PSC39 and that the production of acetaldehyde and oxidant stress in mouse PSC are the cause of increased CTGF mRNA and protein production after exposure of the cells to ethanol25. In view of our findings that PSC are the principal producers of CTGF in murine ACP (these studies) and that PSC treated with recombinant CTGF demonstrate increased adhesion, migration, proliferation, DNA synthesis and collagen I synthesis40, additional in vitro and in vivo studies regarding the role of alcohol in PSC-mediated CTGF production will likely yield important clues as to disease pathogenesis and possible therapeutic strategies.
Despite a clear role for CTGF in the regulation of PSC function and its production by activated PSC both in vitro and in fibrosing pancreatic tissues in vivo, additional studies addressing its precise role in pancreatic fibrosis are required in light of emerging data from CTGF transgenic mice that have highlighted the importance of concurrent injury cascades in organs such as the liver or kidney for the manifestation of CTGF fibrotic activity42–44. Collectively these studies have demonstrated that CTGF likely exerts a fibrotic action by acting as a portal or hub through which cells are able to integrate multiple molecular cues and to respond with a pro-fibrotic output. Understanding of this phenomenon in pancreatic tissues is thus a prerequisite for elucidation of the mechanism of action of CTGF in driving pancreatic fibrosis. Nonetheless, the data presented in the current study show that collagen-producing α-SMA-positive PSC act as a central player in CTGF production in ACP in vivo and highlight the importance of activated PSC and CTGF in the pathophysiological mechanisms involved as well as their potential as targets for anti-fibrotic therapies.
Supplementary Material
Acknowledgements
This work was supported by NIH grant 1R01 AA015554 awarded to D.R.B. We thank Yuying Jiang for helpful advice and acknowledge assistance from the staff of the Biomorphology Core and Vivarium at The Research Institute.
Abbreviations
- ACP
alcoholic chronic pancreatitis
- BAL
blood alcohol level
- CTGF
connective tissue growth factor
- PSC
pancreatic stellate cell
- α-SMA
alpha smooth muscle actin
- TGF-β
transforming growth factor beta
References
- 1.Comfort MW, Gambill EE, Baggenstoss AH. Chronic relapsing pancreatitis. Gastroenterology. 1946;6:239–285. [PubMed] [Google Scholar]
- 2.Braganza JM. The pathogenesis of chronic pancreatitis. Qjm. 1996;89:243–250. doi: 10.1093/qjmed/89.4.243. [DOI] [PubMed] [Google Scholar]
- 3.Kloppel G, Maillet B. The morphological basis for the evolution of acute pancreatitis into chronic pancreatitis. Virchows Arch A Pathol Anat Histopathol. 1992;420:1–4. doi: 10.1007/BF01605976. [DOI] [PubMed] [Google Scholar]
- 4.Wilson JS, Korsten MA, Pirola RC. Alcohol-induced pancreatic injury (Part I). Unexplained features and ductular theories of pathogenesis. Int J Pancreatol. 1989;4:109–125. [PubMed] [Google Scholar]
- 5.Sand J, Lankisch PG, Nordback I. Alcohol consumption in patients with acute or chronic pancreatitis. Pancreatology. 2007;7:147–156. doi: 10.1159/000104251. [DOI] [PubMed] [Google Scholar]
- 6.Marks IN, Bank S. The aetiology, clinical features and diagnosis of pancreatitis in the South Western Cape; a review of 243 cases. S Afr Med J. 1963;37:1039–1053. [PubMed] [Google Scholar]
- 7.Durbec JP, Sarles H. Multicenter survey of the etiology of pancreatic diseases. Relationship between the relative risk of developing chronic pancreaitis and alcohol, protein and lipid consumption. Digestion. 1978;18:337–350. doi: 10.1159/000198221. [DOI] [PubMed] [Google Scholar]
- 8.Dufour MC, Adamson MD. The epidemiology of alcohol-induced pancreatitis. Pancreas. 2003;27:286–290. doi: 10.1097/00006676-200311000-00002. [DOI] [PubMed] [Google Scholar]
- 9.Schneider A, Whitcomb DC, Singer MV. Animal models in alcoholic pancreatitis--what can we learn? Pancreatology. 2002;2:189–203. doi: 10.1159/000058033. [DOI] [PubMed] [Google Scholar]
- 10.Omary MB, Lugea A, Lowe AW, et al. The pancreatic stellate cell: a star on the rise in pancreatic diseases. J Clin Invest. 2007;117:50–59. doi: 10.1172/JCI30082. [DOI] [PMC free article] [PubMed] [Google Scholar]
- 11.Haber PS, Keogh GW, Apte MV, et al. Activation of pancreatic stellate cells in human and experimental pancreatic fibrosis. Am J Pathol. 1999;155:1087–1095. doi: 10.1016/S0002-9440(10)65211-X. [DOI] [PMC free article] [PubMed] [Google Scholar]
- 12.Apte MV, Haber PS, Applegate TL, et al. Periacinar stellate shaped cells in rat pancreas: identification, isolation, and culture. Gut. 1998;43:128–133. doi: 10.1136/gut.43.1.128. [DOI] [PMC free article] [PubMed] [Google Scholar]
- 13.Siegmund SV, Haas S, Singer MV. Animal models and their results in gastrointestinal alcohol research. Dig Dis. 2005;23:181–194. doi: 10.1159/000090165. [DOI] [PubMed] [Google Scholar]
- 14.Brigstock DR. The connective tissue growth factor/cysteine-rich 61/nephroblastoma overexpressed (CCN) family. Endocr Rev. 1999;20:189–206. doi: 10.1210/edrv.20.2.0360. [DOI] [PubMed] [Google Scholar]
- 15.Lau LF, Lam SC. The CCN family of angiogenic regulators: the integrin connection. Exp Cell Res. 1999;248:44–57. doi: 10.1006/excr.1999.4456. [DOI] [PubMed] [Google Scholar]
- 16.Tettamanti G, Malagoli D, Benelli R, et al. Growth factors and chemokines: a comparative functional approach between invertebrates and vertebrates. Curr Med Chem. 2006;13:2737–2750. doi: 10.2174/092986706778521986. [DOI] [PubMed] [Google Scholar]
- 17.Shimo T, Wu C, Billings PC, et al. Expression, gene regulation, and roles of Fisp12/CTGF in developing tooth germs. Dev Dyn. 2002;224:267–278. doi: 10.1002/dvdy.10109. [DOI] [PubMed] [Google Scholar]
- 18.Asano M, Kubota S, Nakanishi T, et al. Effect of connective tissue growth factor (CCN2/CTGF) on proliferation and differentiation of mouse periodontal ligament-derived cells. Cell Commun Signal. 2005;3:11. doi: 10.1186/1478-811X-3-11. [DOI] [PMC free article] [PubMed] [Google Scholar]
- 19.Yamaai T, Nakanishi T, Asano M, et al. Gene expression of connective tissue growth factor (CTGF/CCN2) in calcifying tissues of normal and cbfa1-null mutant mice in late stage of embryonic development. J Bone Miner Metab. 2005;23:280–288. doi: 10.1007/s00774-004-0600-5. [DOI] [PubMed] [Google Scholar]
- 20.di Mola FF, Friess H, Martignoni ME, et al. Connective tissue growth factor is a regulator for fibrosis in human chronic pancreatitis. Ann Surg. 1999;230:63–71. doi: 10.1097/00000658-199907000-00010. [DOI] [PMC free article] [PubMed] [Google Scholar]
- 21.di Mola FF, Friess H, Riesle E, et al. Connective tissue growth factor is involved in pancreatic repair and tissue remodeling in human and rat acute necrotizing pancreatitis. Ann Surg. 2002;235:60–67. doi: 10.1097/00000658-200201000-00008. [DOI] [PMC free article] [PubMed] [Google Scholar]
- 22.Hartel M, Di Mola FF, Gardini A, et al. Desmoplastic reaction influences pancreatic cancer growth behavior. World J Surg. 2004;28:818–825. doi: 10.1007/s00268-004-7147-4. [DOI] [PubMed] [Google Scholar]
- 23.Shek FW, Benyon RC, Walker FM, et al. Expression of transforming growth factor-beta 1 by pancreatic stellate cells and its implications for matrix secretion and turnover in chronic pancreatitis. Am J Pathol. 2002;160:1787–1798. doi: 10.1016/s0002-9440(10)61125-x. [DOI] [PMC free article] [PubMed] [Google Scholar]
- 24.Shinji T, Ujike K, Ochi K, et al. Establishment of a novel collagenase perfusion method to isolate rat pancreatic stellate cells and investigation of their gene expression of TGF-beta1, type I collagen, and CTGF in primary culture or freshly isolated cells. Acta Med Okayama. 2002;56:211–218. doi: 10.18926/AMO/31682. [DOI] [PubMed] [Google Scholar]
- 25.Lawrencia C, Charrier A, Huang G, et al. Ethanol-mediated expression of connective tissue growth factor (CCN2) in mouse pancreatic stellate cells. Growth Factors. 2009;27:91–99. doi: 10.1080/08977190902786319. [DOI] [PubMed] [Google Scholar]
- 26.Puchtler H, Waldrop FS, Valentine LS. Polarization microscopic studies of connective tissue stained with picro-sirius red FBA. Beitr Pathol. 1973;150:174–187. doi: 10.1016/s0005-8165(73)80016-2. [DOI] [PubMed] [Google Scholar]
- 27.Junqueira LC, Bignolas G, Brentani RR. Picrosirius staining plus polarization microscopy, a specific method for collagen detection in tissue sections. Histochem J. 1979;11:447–455. doi: 10.1007/BF01002772. [DOI] [PubMed] [Google Scholar]
- 28.Brigstock DR. Regulation of angiogenesis and endothelial cell function by connective tissue growth factor (CTGF) and cysteine-rich 61 (CYR61) Angiogenesis. 2002;5:153–165. doi: 10.1023/a:1023823803510. [DOI] [PubMed] [Google Scholar]
- 29.Oruc N, Whitcomb DC. Theories, mechanisms, and models of alcoholic chronic pancreatitis. Gastroenterol Clin North Am. 2004;33:733–750. v–vi. doi: 10.1016/j.gtc.2004.07.014. [DOI] [PubMed] [Google Scholar]
- 30.Apte MV, Haber PS, Darby SJ, et al. Pancreatic stellate cells are activated by proinflammatory cytokines: implications for pancreatic fibrogenesis. Gut. 1999;44:534–541. doi: 10.1136/gut.44.4.534. [DOI] [PMC free article] [PubMed] [Google Scholar]
- 31.Apte MV, Pirola RC, Wilson JS. Battle-scarred pancreas: role of alcohol and pancreatic stellate cells in pancreatic fibrosis. J Gastroenterol Hepatol. 2006;21(Suppl 3):S97–S101. doi: 10.1111/j.1440-1746.2006.04587.x. [DOI] [PubMed] [Google Scholar]
- 32.Abel EL. Behavioral teratology of alcohol (animal model studies of fetal alcohol syndrome) In: Abel EL, editor. Fetal Alcohol Syndrome, Vol. III. Animal Studies. Boca Raton, FL: CRC Press; 1982. [Google Scholar]
- 33.Perides G, Tao X, West N, et al. A mouse model of ethanol dependent pancreatic fibrosis. Gut. 2005;54:1461–1467. doi: 10.1136/gut.2004.062919. [DOI] [PMC free article] [PubMed] [Google Scholar]
- 34.Bonthius DJ, Goodlett CR, West JR. Blood alcohol concentration and severity of microencephaly in neonatal rats depend on the pattern of alcohol administration. Alcohol. 1988;5:209–214. doi: 10.1016/0741-8329(88)90054-7. [DOI] [PubMed] [Google Scholar]
- 35.Pierce DR, West JR. Blood alcohol concentration: a critical factor for producing fetal alcohol effects. Alcohol. 1986;3:269–272. doi: 10.1016/0741-8329(86)90036-4. [DOI] [PubMed] [Google Scholar]
- 36.Tsukamoto H, Mkrtchyan H, Dynnyk A. Intragastric ethanol infusion model in rodents. Methods Mol Biol. 2008;447:33–48. doi: 10.1007/978-1-59745-242-7_3. [DOI] [PubMed] [Google Scholar]
- 37.Lieber CS, DeCarli LM, Sorrell MF. Experimental methods of ethanol administration. Hepatology. 1989;10:501–510. doi: 10.1002/hep.1840100417. [DOI] [PubMed] [Google Scholar]
- 38.Gukovsky I, Lugea A, Shahsahebi M, et al. A rat model reproducing key pathological responses of alcoholic chronic pancreatitis. Am J Physiol Gastrointest Liver Physiol. 2008;294:G68–G79. doi: 10.1152/ajpgi.00006.2007. [DOI] [PubMed] [Google Scholar]
- 39.Gao R, Brigstock DR. Connective tissue growth factor (CCN2) in rat pancreatic stellate cell function: integrin alpha5beta1 as a novel CCN2 receptor. Gastroenterology. 2005;129:1019–1030. doi: 10.1053/j.gastro.2005.06.067. [DOI] [PubMed] [Google Scholar]
- 40.Gao R, Brigstock DR. A novel integrin alpha5beta1 binding domain in module 4 of connective tissue growth factor (CCN2/CTGF) promotes adhesion and migration of activated pancreatic stellate cells. Gut. 2006;55:856–862. doi: 10.1136/gut.2005.079178. [DOI] [PMC free article] [PubMed] [Google Scholar]
- 41.Apte M, McCarroll J, Pirola R, et al. Pancreatic MAP kinase pathways and acetaldehyde. Novartis Found Symp. 2007;285:200–211. doi: 10.1002/9780470511848.ch15. discussion 211-6. [DOI] [PubMed] [Google Scholar]
- 42.Yokoi H, Mukoyama M, Mori K, et al. Overexpression of connective tissue growth factor in podocytes worsens diabetic nephropathy in mice. Kidney Int. 2008;73:446–455. doi: 10.1038/sj.ki.5002722. [DOI] [PubMed] [Google Scholar]
- 43.Tong Z, Chen R, Alt DS, et al. Susceptibility to liver fibrosis in mice expressing a connective tissue growth factor transgene in hepatocytes. Hepatology. 2009;50:939–947. doi: 10.1002/hep.23102. [DOI] [PMC free article] [PubMed] [Google Scholar]
- 44.Brigstock DR. Connective tissue growth factor (CCN2, CTGF) and organ fibrosis: Lessons from transgenic animals. Journal of Cell Communication and Signaling. 2009 doi: 10.1007/s12079-009-0071-5. doi10.1007/s12079-009-0071-5. [DOI] [PMC free article] [PubMed] [Google Scholar]
Associated Data
This section collects any data citations, data availability statements, or supplementary materials included in this article.


