Abstract
Speech sounds are traditionally divided into consonants and vowels. When only vowels or only consonants are replaced by noise, listeners are more accurate understanding sentences in which consonants are replaced but vowels remain. From such data, vowels have been suggested to be more important for understanding sentences; however, such conclusions are mitigated by the fact that replaced consonant segments were roughly one-third shorter than vowels. We report two experiments that demonstrate listener performance to be better predicted by simple psychoacoustic measures of cochlea-scaled spectral change across time. First, listeners identified sentences in which portions of consonants (C), vowels (V), CV transitions, or VC transitions were replaced by noise. Relative intelligibility was not well accounted for on the basis of Cs, Vs, or their transitions. In a second experiment, distinctions between Cs and Vs were abandoned. Instead, portions of sentences were replaced on the basis of cochlea-scaled spectral entropy (CSE). Sentence segments having relatively high, medium, or low entropy were replaced with noise. Intelligibility decreased linearly as the amount of replaced CSE increased. Duration of signal replaced and proportion of consonants/vowels replaced fail to account for listener data. CSE corresponds closely with the linguistic construct of sonority (or vowel-likeness) that is useful for describing phonological systematicity, especially syllable composition. Results challenge traditional distinctions between consonants and vowels. Speech intelligibility is better predicted by nonlinguistic sensory measures of uncertainty (potential information) than by orthodox physical acoustic measures or linguistic constructs.
Keywords: auditory perception, speech perception, phonetics, linguistics, efficient coding
Th* b*s*c d*m*nstr*t**n *s th*t t*xt *s st*ll m*r* *r l*ss l*g*bl* wh*n th* v*w*ls h*v* b**n r*m*v*d. (ref. 1, p. 211; asterisks added). Consonants provide much more information than vowels for reading text (2, 3), largely because the number of orthographic vowels in English (five or six) is well exceeded by the number of consonants (20 or 21). Independent of the role of sequential probabilities, vowels are less important for reading because there is much less uncertainty among 5 vowels than among 20 consonants, just as there is less uncertainty in flipping a coin (2 outcomes) versus rolling a die (6).
For listening to speech, this statistical disparity between vowels and consonants is lessened, because American English contains 12 spoken vowels (15 including diphthongs) and 25 or 26 consonants, but still predicts that consonants should provide more information than vowels. Surprisingly, vowel sounds have appeared to provide more information (contribute more toward intelligibility) than consonant sounds (refs. 4–6; but see ref. 7). Across multiple studies, investigators have deleted parts of waveforms of sentences corresponding roughly to consonants or vowels and replaced them with noise. Because listeners were better at understanding sentences with consonants replaced than with vowels replaced, a “vowel superiority effect” has been suggested to exist opposite the superior role consonants play for reading (4–6).
Interpreting putative vowel superiority effects is not straightforward. First, while it is readily apparent where one printed letter ends and the next begins, no single point in time exists when a consonant ends and a vowel begins in connected speech. Production of every consonant and vowel overlaps in time (and in the vocal tract) with speech sounds that precede and follow. In addition, acoustic characteristics within vowels provide rich evidence concerning neighboring consonants and vice versa (8–11).
Experiments in which consonants or vowels are replaced by noise rely upon discrete time points provided by phoneticians to demarcate consonants and vowels in the Texas Instruments/Massachusetts Institute of Technology (TIMIT) database of sentences (12). Although neither phoneticians who provide these boundaries nor investigators who use them in perception experiments are naïve about shortcomings of such demarcations, they do present a second challenge to interpreting data suggesting vowel superiority. On average, “vowel” segments of sentence waveforms are roughly one-third longer than “consonant” segments in American English. Very recently, Kewley-Port and colleagues (13) provided evidence that there may be no intelligibility differences between replacing consonants (Cs), vowels (Vs), or transitions (CVs, VCs) after accounting for duration.
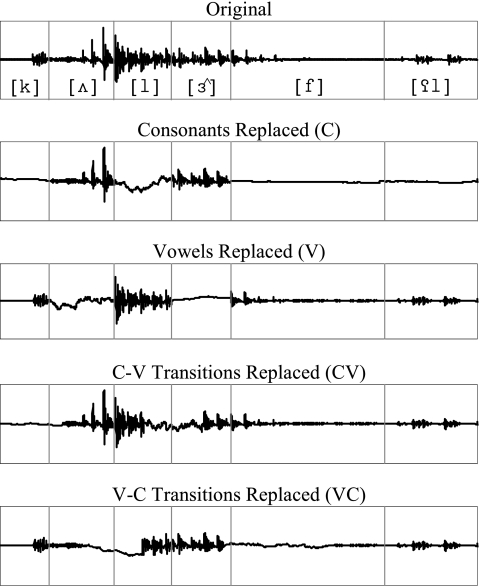
It seems unlikely, however, that all portions of the speech signal are perceptually equivalent, and only duration—not acoustic composition—matters. Here, we demonstrate how not all portions of a speech signal are equally important for speech intelligibility. Two experiments were conducted to address whether information in the speech signal crucial to sentence intelligibility is captured by vowels, consonants, relatively equal proportions of consonants and vowels, or another metric altogether. The first experiment extends efforts to evaluate the relative dependence of intelligibility on not only Cs and Vs as traditionally conceptualized, but also CVs and VCs. Sound intervals are replaced by 1/f noise approximating the long-term spectrum of speech (14) (Fig. 1).
Fig. 1.
Sample waveform of the word “colorful” processed in each condition of experiment 1. The original waveform is shown in the top row, with phonetic symbols corresponding to each consonant and vowel sound. Vertical lines denote locations of consonant/vowel boundaries as designated in TIMIT. Consonant- (second row) and vowel-replaced (third row) conditions are depicted at 100% segment replacement; CV- (fourth row) and VC-replaced (fifth row) conditions are depicted at 50% (maximum) replacement.
Inspired by data from experiment 1, the second experiment abandons phonetic designations of the sound waveform as Cs and Vs and, instead, tests whether relative informativeness of portions of the speech signal is related to the degree to which the signal changes as a function of time. Begin with the simple fact that a fundamental principle of perceptual systems is that they respond primarily to change (15). This fact has the formal consequence of increasing information transmission. In accordance with Shannon information theory, there is no new information when events either do not change or are predictable (16). When there is more entropy, there is more potential information. Information-theoretic approaches were long ago adopted by vision scientists (17, 18). There are ample demonstrations that natural scenes include a good deal of redundancy (i.e., predictability) (17, 19, 20) and that visual perception exploits this redundancy to extract potential information (i.e., unpredictability) (20, 21). Although information-theoretic approaches to vision, typically under the contemporary label of “efficient coding” (22), continue to be fruitful, parallel investigations of auditory perception are quite limited (23), particularly for perception of speech (24, 25).
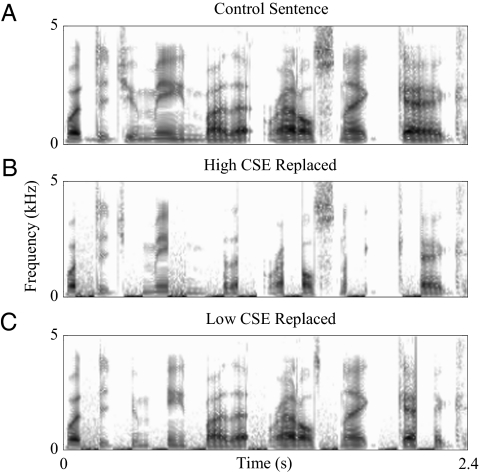
Here, a simple measure of potential information in acoustic signals is used. Cochlea-scaled spectral entropy (CSE) is a measure of the relative (un)predictability of signals that is operationalized as the extent to which successive spectral slices differ (or cannot be predicted) from preceding spectral slices. Most simply, CSE is quantified as Euclidean distances between equivalent-rectangular-bandwidth-scaled (26) spectra of fixed-duration (16 ms) sentence slices that were processed by auditory filters (27) (Fig. S1). Eighty-millisecond (consonant-length) or 112-ms (vowel-length) segments of sentences are replaced with noise depending on cumulative CSE. More uncertainty (CSE) in the signal is taken to provide more potential information. Intelligibility is assessed when equal-duration intervals of high, medium, or low potential information are replaced by noise (Fig. 2). In fact, perceptual significance can be quantified quite well, but only when one first dispenses with consonants and vowels and instead returns to relative (un)predictability, the reason why consonant letters are so important for reading.
Fig. 2.
Spectrograms of a sample sentence processed in different conditions of experiment 2. Spectrogram ordinates are in linear frequency. The sample sentence, “What did you mean by that rattlesnake gag?”, is shown in its original form (A), processed in high-CSE-replaced (B) and low-CSE-replaced (C) conditions. Segments replaced by noise (112 ms) are visible in Fig. 2 B and C as dark horizontal stripes in low frequency, with decreasing energy with increasing frequency. Little overlap exists in segments replaced for high- versus low-CSE-replaced conditions.
Results
Experiment 1.
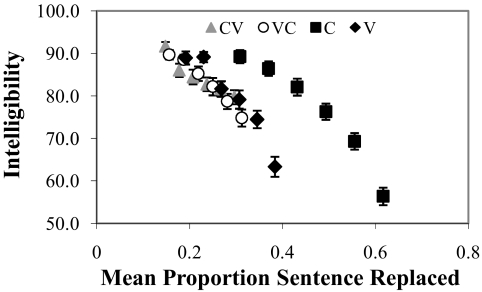
As expected, intelligibility decreases with increasing proportion of the sentence replaced by noise (linear regression fit: r2 = 0.65, P < 0.001; Fig. 3). Performance decreases most rapidly with increasing amounts of Vs, CVs, and VCs replaced, and there are no significant differences between these three conditions. By contrast, intelligibility is relatively robust as increasing amounts of Cs are replaced, maintaining >75% intelligibility even when over half of the sentence has been replaced by noise. Data for only replaced Cs and Vs appear consistent with earlier suggestions of “vowel superiority” (4–6) in as much as intelligibility of consonants-replaced sentences exceeds that for vowels-replaced sentences. However, purported vowel superiority is undermined by the finding that intelligibility of 100%-vowels-replaced sentences is better than 100%-consonant-replaced sentences (paired-samples t47 = 2.70, P < 0.01). Further, irrespective of whether consonants or vowels are putatively superior for intelligibility of speech, one would predict that intelligibility in conditions in which CVs and VCs are replaced with noise should fall between performance for only Cs or Vs, but this pattern was not observed. Taken together, it appears that something other than Cs versus Vs best accounts for performance.
Fig. 3.
Results of experiment 1 (n = 48), with intelligibility plotted as a function of mean proportion sentence replaced. Rightmost symbols denote 100% replacement of Cs and Vs and 50% replacement of CVs and VCs. Data for sentences in CV (gray triangles), VC (white circles), and vowel (black diamond) conditions highly overlap; whereas data for sentences in the consonant condition (black squares) are displaced to the right (greater proportions of sentence replaced). Error bars depict SEM.
Experiment 2.
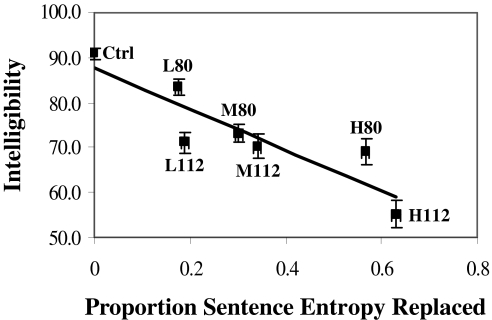
As would be expected, replacing longer (112-ms) segments impaired performance more on average than replacing shorter (80-ms) segments. The amount of potential information (CSE), however, plays a much greater role in predicting performance. Intelligibility closely follows measures of entropy replaced (linear regression fit: r2 = 0.80, P < 0.01; Fig. 4).
Fig. 4.
Results of experiment 2 (n = 21), depicted as linear regressions with cochlea-scaled entropy predicting listener performance. Percentage of words correctly identified correctly is on the ordinate. Individual data points are labeled according to relative entropy (low/medium/high; L, M, and H) and segment durations (80/112 ms) as well as the control condition (Ctrl). Solid line is fitted regression function. Error bars depict SEM along both axes.
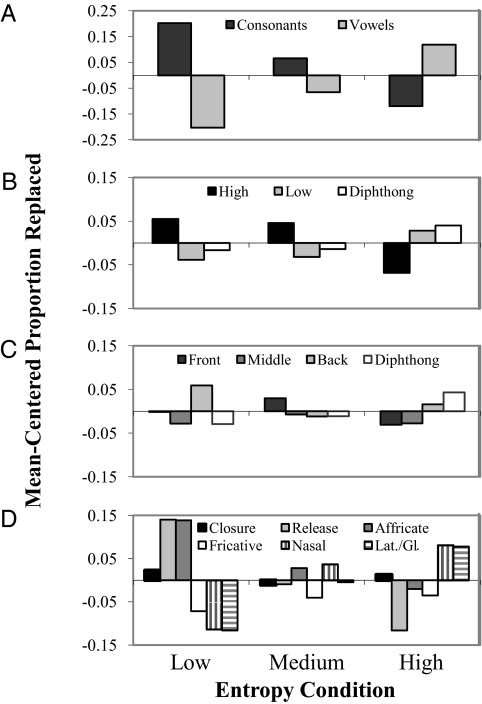
There are informative systematicities in the types of speech sounds that have higher and lower CSE (Fig. 5A). More consonants than vowels are replaced in low-entropy conditions, and more vowels than consonants are replaced in high-entropy conditions. Although significantly more vowels were replaced with each increase in CSE, the proportion of vowels replaced is a nonsignificant predictor of intelligibility (r2 = 0.55).
Fig. 5.
Proportions of sentence segments replaced by noise in experiment 2 corresponding to consonants and vowels as transcribed in TIMIT. Mean-centered proportion replaced is on the ordinate, and relative entropy conditions are on the abscissa of each graph. (A) Proportions of signal replaced classified as consonants (black) and vowels (gray) by using TIMIT demarcations. (B–D) Phonetic composition of replaced speech segments by vocal tract configuration (vowels, B and C) or manners of articulation (consonants, D). (B) Vowels replaced by noise, differentiated by high (black), low (gray), and diphthongs (white). (C) The same vowels depicted in B, differentiated by front (black), middle (dark gray), back (light gray), and diphthongs (white). (D) Consonants replaced by noise, differentiated by closure (black), stop release (light gray), affricate (dark gray), fricative (white), nasal (vertical stripes), and laterals and glides (horizontal stripes).
Next, phonetic compositions of replaced speech segments were analyzed according to vocal tract configuration (vowels) or manner of articulation (consonants; Table S1). Vowels can be subdivided into high versus low, front versus middle or back, or diphthongs. As one would expect, acoustic segments marked as diphthongs were replaced most often in high-entropy conditions and least often in low-entropy conditions (Fig. 5 B and C). Low vowels are replaced most often in high-entropy conditions and least often in low-entropy conditions, whereas high vowels show the opposite pattern (Fig. 5B). There were no systematic differences between front, middle, or back vowels (Fig. 5C).
Consonants were classified as stops, affricates, closure silence (preceding stops and affricates), fricatives, laterals/glides, and nasals. Consonants replaced by noise (Fig. 5D) differed substantially across conditions. The most vowel-like consonants, nasals and laterals/glides, were the most replaced in high-entropy conditions and the least replaced in low-entropy conditions. Least-vowel-like stops and affricates showed the complementary pattern. Only modest changes were observed for fricatives and closures across conditions.
This pattern of CSE decreasing from low vowels, to high vowels, to laterals/glides and nasals, to fricatives, to affricates, and finally stops closely parallels the sonority hierarchy. The linguistic construct of sonority (or vowel-likeness) is useful for describing phonological systematicity, especially syllable composition; however, to date sonority has been resistant to clear definition in acoustics or articulation (28, 29).
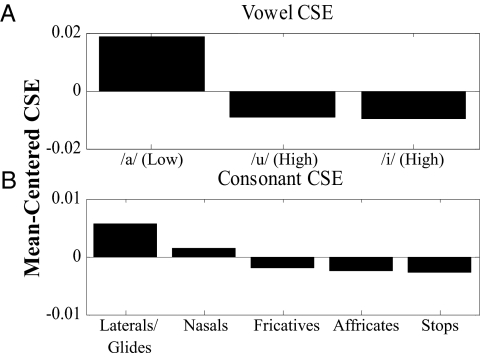
As an explicit test of the extent to which CSE corresponds to sonority, CSE was measured in VCV recordings from six adult talkers (three male). Twenty American English consonant sounds (“b”, “ch”, “d”, “f”, “g”, “j”, “k”, “l”, “m”, “n”, “p”, “r”, “sh”, “s”, “th”, “t”, “v”, “w”, “y”, “z”) were flanked by each of three vowels (/a/ [“ah”], /i/ [“ee”], /u/ [“oo”]), generating 60 VCVs per talker. Recordings were edited to maintain relatively constant overall duration (≈460 ms). Waveforms were normalized so that amplitudes of the vowels reflected differences in naturally spoken vowels (/a/ +5.4 dB relative to /i/ and +4.4 dB relative to /u/; ref. 30). Onsets and offsets of VCVs (64 ms) were excluded, and cumulative CSE was measured for each VCV in the same way as for experiment 2. Averaged across talkers and consonants, there was more CSE in low-vowel contexts (/a/) than in high-vowel contexts (/i,u/) (Fig. 6A). Across talkers, vowels, laterals, and glides had the highest CSE, followed by nasals, fricatives, affricates, and stops (Fig. 6B). Patterns of CSE for both vowel and consonant analyses follow the sonority hierarchy, corroborating findings from experiment 2.
Fig. 6.
Measures of cochlea-scaled spectral entropy for VCVs averaged across six talkers. (A) Mean-centered CSE measures organized in descending order for one low vowel (/a/) and two high vowels (/u,i/). (B) Mean-centered CSE measures organized in descending order of consonants: laterals and glides, nasals, fricatives, affricates, then stops. These patterns of differences in CSE corroborate experiment 2 findings and follow the sonority hierarchy.
Discussion
Experiment 1 replicates in part previous findings that suggest a vowel superiority effect (4–6) in as much as intelligibility is impaired more substantially when Vs are replaced with noise than when Cs are replaced. However, concurrent findings render this straightforward interpretation inadequate. Instead of patterns of intelligibility for replaced CVs and VCs being intermediate to those for Cs and Vs, performance is indistinguishable from that for just Vs. More important, intelligibility of 100%-vowels-replaced sentences was significantly better than 100%-consonants-replaced sentences.
In an effort to better predict intelligibility, a measure of psychoacoustic potential information, cochlea-scaled spectral entropy, was used and traditional linguistic constructs of consonants and vowels were abandoned. This metric for estimating perceptually significant portions of a speech signal is inspired by Shannon information theory (16), which was quickly adopted by vision scientists (17, 18) and continues to be theoretically useful in contemporary theories of “efficient coding” (22). Shannon conceptualized information with respect to entropy, defined as the uncertainty associated with an event. Relatively uncertain events (e.g., change) carry more information than more certain events (e.g., relatively little change). Thus, information is inversely related to predictability.
There are additional ways through which psychoacoustic and physiological estimates of auditory entropy could be improved. For example, measures of periodicity could be incorporated to capture differences between periodic and relatively aperiodic portions of the signal or other changes in fundamental frequency. Potential improvement does not detract from the fact that the present psychoacoustic method of measuring uncertainty in the speech signal provides strong evidence that sensory change, not consonants, vowels, or duration, better predicts speech intelligibility.
Phonetic composition of high- versus low-entropy segments may be surprising. One might expect that consonants, created by vocal tract constrictions with corresponding relatively rapid acoustic changes, would be more prevalent than vowels in high-entropy speech segments. However, vowels and vowel-like sounds have greater cochlea-scaled entropy because roughly logarithmic psychoacoustic and physiologic indices of frequency weight lower-frequency spectral prominences (formants, F1 and F2) more. This explanation depends, however, on vowel and vowel-like sounds being amply kinematic to convey substantial change. In fact, contrary to customary consideration of vowels as being “quasi-stationary” (13), frequencies of vowel formants in North American English change substantially over time with the exception of high vowels /i/ and /u/ (31, 32).
In studies concerning limited classes of speech sounds, some investigators have been drawn to the significance of spectral change for perception [e.g., formant transitions for Cs (33), Vs (31), or CVCs (9)]. None of these efforts have used biologically scaled spectra. Also using a linear frequency scale, Stevens (34) tracked changes in low-frequency energy (amplitude and frequency in the region of the first formant) in the first of a sequence of steps aimed toward recovering abstract discrete segments (phonemes) from connected speech. Characteristics of these low-frequency “acoustic landmarks” are intended to provide a coarse parse of the signal according to broad classes of speech sounds. Peaks, valleys, and discontinuities in low-frequency energy correspond to regions of the signal affiliated with vowels, glides, and consonants.
It has been hypothesized (34) that identification of “landmarks” provides a basis for extracting a sequence of phonemes, defined by a set of binary distinctive features. For example, consonants can be further divided by a feature ([continuant]) that distinguishes between stop consonants and fricatives. By introducing another feature ([strident]), voiced fricatives can be distinguished from voiceless fricatives. Such an approach begins with an assumption of distinctive features within a formal linguistic system of phonology, and these features relate to articulatory gestures with greater or lesser precision. By and large, it has been difficult to identify distinct acoustic signatures for either formal binary features or the articulatory gestures to which they are assigned.
Owing to the low-frequency emphasis imposed by cochleotopic scaling, there is some overlap between CSE and indicators of landmarks revealed by properties of the first formant. In both cases, measures correspond to general characteristics of constrictions of the vocal tract and correlate with linguistic distinctions such as vowels, glides, and consonants. However, in contrast to landmarks, the present approach is founded on quite general principles of auditory sensorineural processing and is free of linguistic assumptions. In fact, there are no assumptions that the signal is created by a vocal tract. Without introduction of constructs such as distinctive features, CSE reveals distinctions between classes of speech sounds that mirror those in the sonority hierarchy. Although the present results are agnostic to linguistic constructs and theory, CSE could be construed as providing a case in which some linguistic distinctions are natural consequences of operating characteristics of the mammalian auditory system. It may prove fruitful to investigate the extent to which this auditorily defined correlate of sonority could serve as a framework upon which other distinctions (e.g., place of articulation) could be extracted, presumably upon similarly realistic measures of speech signals.
Finally, linear regression ought not to be overly interpreted to suggest that fully 80% or more of speech intelligibility can be accounted for solely by psychoacoustic indices of potential information. The erroneous implication within such a simple linear model is that less than one-fifth of sentence understanding remains to be explained by joint contributions of linguistics, psycholinguistcs, and error variance. Instead, sentences provide numerous linguistic cues (syntax, semantics, prosody, etc.), so understanding one word in a sentence greatly increases predictability of adjacent words (35, 36). Consequently, a little more acoustics can serve to engage predictability at higher levels in distinctly nonlinear ways.
These patterns of performance suggest that psychoacoustically principled informational analysis is superior to traditional constructs of consonant and vowel sounds for predicting intelligibility and, perhaps surprisingly, the distinction between Cs and Vs appears to play little predictive role in listeners' performance. Although only a few phoneticians have gone so far as to abandon the consonant-vowel distinction (37, 38), Port (39–42) has argued that confident intuitions about segmental description of speech (in terms of letter-like units) are largely a consequence of the literacy training of modern scientists, and that consonant and vowel segments play no role in the real-time production and perception of speech. The present results provide another case where a segmental model should make strong claims for a role of phonetic or phonological segments, but the data fail to support it (43, 44).
Data and analyses presented here support an information-theoretic approach to speech perception (24, 25). At the heart of this perspective lies the fundamental principle that perceptual systems respond primarily to change in the interest of maximizing transmission of new information (15). Results emphasize the importance of information (change), more than consonants, vowels, or time, for speech perception.
Methods
Participants.
Sixty-nine undergraduate native English speakers were recruited from the Department of Psychology at the University of Wisconsin-Madison (48 participated in experiment 1, 21 in experiment 2; no listener participated in both experiments). None reported any hearing impairment, and all received course credit for their participation.
Stimuli.
Experimental materials were 132 sentences selected from the TIMIT database (12) based on comparable length (2,112.4 ms, SD = 356.7). All were grammatical and contained no proper nouns. Sentences were comprised of 5–8 words (mean = 6.66, SD = 1.05) and 9–11 syllables (mean = 9.98, SD = 0.83). Experiment 1 presented 12 practice and 120 experimental sentences. Experiment 2 presented 14 practice and 70 experimental sentences, all of which were a subset of experimental sentences from experiment 1.
Experiment 1.
Four speech intervals were replaced with noise: Cs, Vs, CVs, and VCs. The TIMIT database provides phonetic classification to distinguish American English consonant and vowels (45–47); this classification was adopted with one modification. When an interval marked “closure” (labeled separately in the TIMIT database) preceded one labeled stop consonant or affricate, these intervals were combined and treated as a single consonant. Initially, six percentages of speech segments were replaced: 50–100% in 10% steps. The authors discovered that replacing up to 100% of CVs or VCs with noise rendered sentences unintelligible; therefore, 25–50% of CVs and VCs were replaced in 5% steps. This adjustment brought mean segment durations in closer agreement (mean C duration: 77.2 ms; V: 104.0 ms; one-half CV duration: 83.8 ms; one-half VC duration: 88.7 ms). TIMIT phonetic boundaries were used to locate the center of the segment (C, V) or segment pair (CV, VC; not at TIMIT-marked C/V boundary but overall center). Then, “speech-like” noise (1/f; see ref. 14) was generated by filtering white noise with a first-order Butterworth filter, producing a −6 dB/octave rolloff. Replacement with noise was centered on segment midpoint (e.g., 50% replacement denotes replacing the center 50% of the C, V, CV, and VC with noise). Novel noise samples were generated for each replacement, RMS-matched to the amplitude of speech being replaced. All sentence processing was conducted in MATLAB.
Experiment 2.
A psychoacoustically motivated measure of spectral change was designed to capture the degree to which successive portions of the speech signal are similar to, or can be predicted from, preceding portions (Fig. S1). Sentences were RMS-intensity-normalized and divided into 16-ms slices independent of TIMIT demarcations. Slices were passed through 33 filters that capture nonlinear weighting and frequency distribution along the cochlea (27). Filters were spaced one equivalent rectangular bandwidth (ERB) apart from 26 to 7743 Hz. ERBs provide a close approximation to tonotopic distribution along the cochlea and psychophysical auditory filters derived from normal-hearing listeners (26). Euclidean distances between adjacent 16-ms slices were calculated across the 33-filter output levels. Distances were then summed in boxcars of either five (80 ms, approximate mean consonant duration) or seven successive slices (112 ms, approximate mean vowel duration). Cumulative Euclidean distances within a boxcar are taken as measures of spectral entropy.
After convolving boxcars of summed distances across entire sentences, entropy measures were sorted into ascending order (low entropy condition), descending order (high entropy), or ascending absolute difference from median boxcar value (medium entropy). The boxcar ranked first (lowest, highest, or median entropy) was replaced by 1/f noise matched to average sentence level (following Kewley-Port and colleagues; ref. 5), with 5-ms linear ramps at onset and offset. Eighty milliseconds before and after selected boxcars were preserved to avoid boxcars overlapping, and the first 80 ms of every sentence was always left intact. The procedure proceeded iteratively to the next-highest-ranked boxcar, which was replaced only if its content had not already been replaced or preserved. Owing to these constraints, entropy conditions overlap because, for example, only medium/low eligible boxcars remain after replacement of higher-entropy boxcars. On average, 34.8% (80-ms; SD = 6.6%) and 38.7% (112-ms; SD = 8.0%) of sentences were replaced by noise. The same total duration was replaced for each sentence across all entropy conditions for a given boxcar-duration condition. Segment duration (2) and entropy level (3) were fully crossed to generate six experimental conditions; a seventh control condition was added to assess baseline intelligibility.
Procedure.
Listeners heard sentences played over headphones in a soundproof booth, then they were prompted to type any words they understood on a computer. Responses were scored offline by independent raters. Please see SI Methods for further details.
Supplementary Material
Acknowledgments
We thank Brian C.J. Moore for useful insights concerning CSE, Daniel Fogerty, Diane Kewley-Port, Robert Port, and Eric Raimy for helpful comments on an earlier draft of this paper, and Michael Kiefte for discussions regarding experiment 1. This work was supported by National Institute on Deafness and Other Communication Disorders Grants DC 009532 (to C.E.S.) and DC 004072 (to K.R.K.).
Footnotes
The authors declare no conflict of interest.
This article is a PNAS Direct Submission.
This article contains supporting information online at www.pnas.org/lookup/suppl/doi:10.1073/pnas.0913625107/-/DCSupplemental.
References
- 1.Adams MJ. In: Perception of Print. Tzeng OJL, Singer H, editors. Hillsdale, NJ: Erlbaum; 1981. pp. 197–221. [Google Scholar]
- 2.Lee H-W, Rayner K, Pollatsek A. The relative contribution of consonants and vowels to word identification during reading. J Mem Lang. 2001;44:189–205. [Google Scholar]
- 3.Shimron J. The role of vowels in reading: A review of studies of English and Hebrew. Psychol Bull. 1993;114:52–67. [Google Scholar]
- 4.Cole R, Yan Y, Mak B, Fanty M, Bailey T. The contribution of consonants versus vowels to word recognition in fluent speech. Proc Internatl Conf Acoustics Speech Signal Processing, 1996:853–856. [Google Scholar]
- 5.Kewley-Port D, Burkle TZ, Lee JH. Contribution of consonant versus vowel information to sentence intelligibility for young normal-hearing and elderly hearing-impaired listeners. J Acoust Soc Am. 2007;122:2365–2375. doi: 10.1121/1.2773986. [DOI] [PubMed] [Google Scholar]
- 6.Fogerty D, Kewley-Port D. Perceptual contributions of the consonant-vowel boundary to sentence intelligibility. J Acoust Soc Am. 2009;126:847–857. doi: 10.1121/1.3159302. [DOI] [PMC free article] [PubMed] [Google Scholar]
- 7.Owren MJ, Cardillo GC. The relative roles of vowels and consonants in discriminating talker identity versus word meaning. J Acoust Soc Am. 2006;119:1727–1739. doi: 10.1121/1.2161431. [DOI] [PubMed] [Google Scholar]
- 8.Liberman AM, Harris KS, Hoffman HS, Griffith BC. The discrimination of speech sounds within and across phoneme boundaries. J. Exp Psychol. 1957;54:358–368. doi: 10.1037/h0044417. [DOI] [PubMed] [Google Scholar]
- 9.Jenkins JJ, Strange W, Edman TR. Identification of vowels in “vowelless” syllables. Percept Psychophys. 1983;34:441–450. doi: 10.3758/bf03203059. [DOI] [PubMed] [Google Scholar]
- 10.Sussman HM, McCaffrey HA, Matthews SA. An investigation of locus equations as a source of relational invariance for stop place categorization. J Acoust Soc Am. 1991;90:1309–1325. [Google Scholar]
- 11.Kluender KR, Stilp CE, Rogers TT. Vowel-inherent spectral change enhances adaptive dispersion. J Acoust Soc Am. 2009;125:2695. [Google Scholar]
- 12.Garofolo JS, et al. TIMIT Acoustic-Phonetic Continuous Speech Corpus. Philadelphia: Linguistic Data Consortium; 1993. [Google Scholar]
- 13.Lee JH, Kewley-Port D. Intelligibility of interrupted sentences at subsegmental levels in young normal-hearing and elderly hearing-impaired listeners. J Acoust Soc Am. 2009;125:1153–1163. doi: 10.1121/1.3021304. [DOI] [PMC free article] [PubMed] [Google Scholar]
- 14.Voss RF, Clarke J. ‘1/f noise’ in music and speech. Nature. 1975;258:317–318. [Google Scholar]
- 15.Kluender KR, Coady JA, Kiefte M. Sensitivity to change in perception of speech. Speech Commun. 2003;41:59–69. doi: 10.1016/S0167-6393(02)00093-6. [DOI] [PMC free article] [PubMed] [Google Scholar]
- 16.Shannon CE. A mathematical theory of communication. Bell Syst Tech J. 1948;27:379–423. [Google Scholar]
- 17.Attneave F. Some informational aspects of visual perception. Psychol Rev. 1954;61:183–193. doi: 10.1037/h0054663. [DOI] [PubMed] [Google Scholar]
- 18.Barlow HB. In: Sensory Communication. Rosenblith WA, editor. Cambridge, MA: MIT Press; 1961. pp. 53–85. [Google Scholar]
- 19.Field DJ. Relations between the statistics of natural images and the response properties of cortical cells. J Opt Soc Am. 1987;4:2379–2394. doi: 10.1364/josaa.4.002379. [DOI] [PubMed] [Google Scholar]
- 20.Olshausen BA, Field DJ. Emergence of simple-cell receptive field properties by learning a sparse code for natural images. Nature. 1996;381:607–609. doi: 10.1038/381607a0. [DOI] [PubMed] [Google Scholar]
- 21.Schwartz O, Simoncelli EP. Natural signal statistics and sensory gain control. Nat Neurosci. 2001;4:819–825. doi: 10.1038/90526. [DOI] [PubMed] [Google Scholar]
- 22.Simoncelli EP. Vision and the statistics of the visual environment. Curr Opin Neurobiol. 2003;13:144–149. doi: 10.1016/s0959-4388(03)00047-3. [DOI] [PubMed] [Google Scholar]
- 23.Overath T, et al. An information theoretic characterisation of auditory encoding. PLoS Biol. 2007;5:e288. doi: 10.1371/journal.pbio.0050288. [DOI] [PMC free article] [PubMed] [Google Scholar]
- 24.Kluender KR, Kiefte M. In: Handbook of Psycholinguistics. Gernsbacher MA, Traxler M, editors. London: Elsevier; 2006. pp. 153–199. [Google Scholar]
- 25.Kluender KR, Alexander JM. In: The Senses: A Comprehensive Reference. Dallos P, Oertel, D, editors. San Diego: Academic; 2008. pp. 829–860. [Google Scholar]
- 26.Glasberg BR, Moore BCJ. Derivation of auditory filter shapes from notched-noise data. Hear Res. 1990;47:103–138. doi: 10.1016/0378-5955(90)90170-t. [DOI] [PubMed] [Google Scholar]
- 27.Patterson RD, Nimmo-Smith I, Weber DL, Milroy R. The deterioration of hearing with age: Frequency selectivity, the critical ratio, the audiogram, and speech threshold. J Acoust Soc Am. 1982;72:1788–1803. doi: 10.1121/1.388652. [DOI] [PubMed] [Google Scholar]
- 28.Ohala JJ. There is no interface between phonology and phonetics: A personal view. J Phonetics. 1990;18:153–171. [Google Scholar]
- 29.Clements GN. In: Contemporary Views on Architecture and Representations in Phonology. Raimy E, Cairns CE, editors. Cambridge, MA: MIT Press; 2009. pp. 165–175. [Google Scholar]
- 30.Edwards HT. Applied Phonetics: The Sounds of American English. 2nd Ed. San Diego: Singular; 1997. [Google Scholar]
- 31.Nearey TM, Assmann P. Modeling the role of vowel inherent spectral change in vowel identification. J Acoust Soc Am. 1986;80:1297–1308. [Google Scholar]
- 32.Hillenbrand JM, Nearey TM. Identification of resynthesized /hVd/ utterances: effects of formant contour. J Acoust Soc Am. 1999;105:3509–3523. doi: 10.1121/1.424676. [DOI] [PubMed] [Google Scholar]
- 33.Kewley-Port D. Time-varying features as correlates of place of articulation in stop consonants. J Acoust Soc Am. 1983;73:322–335. doi: 10.1121/1.388813. [DOI] [PubMed] [Google Scholar]
- 34.Stevens KN. Toward a model for lexical access based on acoustic landmarks and distinctive features. J Acoust Soc Am. 2002;111:1872–1891. doi: 10.1121/1.1458026. [DOI] [PubMed] [Google Scholar]
- 35.Boothroyd A, Nittrouer S. Mathematical treatment of context effects in phoneme and word recognition. J Acoust Soc Am. 1988;84:101–114. doi: 10.1121/1.396976. [DOI] [PubMed] [Google Scholar]
- 36.van Rooij JCGM, Plomp R. The effect of linguistic entropy on speech perception in noise in young and elderly listeners. J Acoust Soc Am. 1991;90:2985–2991. doi: 10.1121/1.401772. [DOI] [PubMed] [Google Scholar]
- 37.Linell P. The Written Language Bias in Linguistics: Its Nature, Origins and Transformations. Oxford: Routledge; 2005. [Google Scholar]
- 38.Faber A. In: The Linguistics of Literacy. Downing P, Lima S, Noonan M, editors. Amsterdam: John Benjamins; 1992. pp. 111–134. [Google Scholar]
- 39.Port RF, Leary A. Against formal phonology. Language. 2005;85:927–964. [Google Scholar]
- 40.Port R. In: Second Language Speech Learning: The Role of Language Experience in Speech Perception and Production. Munro M, Bohn O-S, editors. Amsterdam: John Benjamins; 2006. pp. 349–365. [Google Scholar]
- 41.Port R. How are words stored in memory? Beyond phones and phonemes. N Ideas Psychol. 2007;25:143–170. [Google Scholar]
- 42.Port R. All is prosody: Phones and phonemes are the ghosts of letters. Proc 4th Internal Conf Speech Prosody, 2008:7–16. [Google Scholar]
- 43.Palmeri TJ, Goldinger SD, Pisoni DB. Episodic encoding of voice attributes and recognition memory for spoken words. J Exp Psychol Learn Mem Cogn. 1993;19:309–328. doi: 10.1037//0278-7393.19.2.309. [DOI] [PMC free article] [PubMed] [Google Scholar]
- 44.Goldinger SD, Azuma T. Puzzle-solving science: The quixotic quest for units in speech perception. J Phonetics. 2003;31:305–320. doi: 10.1016/S0095-4470(03)00030-5. [DOI] [PMC free article] [PubMed] [Google Scholar]
- 45.Leung HC, Zue VW. A procedure for automatic alignment of phonetic transcriptions with continuous speech. Proc Internatl Conf Acoustics Speech Signal Processing. 1984:2.7.1–2.7.4. [Google Scholar]
- 46.Seneff S, Zue VW. Transcription and alignment of the TIMIT Database. Unpublished technical report. Cambridge: MIT Research Laboratory of Electronics; 1988. [Google Scholar]
- 47.Zue VW, Seneff S, Glass J. Speech Database Development at MIT: TIMIT and Beyond. Speech Commun. 1990;9:351–356. [Google Scholar]
Associated Data
This section collects any data citations, data availability statements, or supplementary materials included in this article.


