Abstract
Protein arrays that measure multiple protein cancer biomarkers in clinical samples hold great promise for reliable early cancer detection. Herein we report a prototype 4-unit electrochemical immunoarray based on single-wall carbon nanotube forests for the simultaneous detection of multiple protein biomarkers for prostate cancer. Immunoarray procedures were designed to measure prostate specific antigen (PSA), prostate specific membrane antigen (PSMA), platelet factor-4 (PF-4) and interleukin-6 (IL-6) simultaneously in a single serum sample. All of these proteins are elevated in serum of patients with prostate cancer, but they have widely different relative levels of serum concentration. Horseradish peroxidase (HRP) was used as label on detection (secondary) antibodies in a sandwich immunoassay scheme. Biotinylated secondary antibodies (Ab2) that bind specifically to streptavidin-HRP conjugates provided 14–16 labels per antibody and gave the necessary higher sensitivity required for PF-4 and IL-6 detection at physiological levels. Conventional singly labeled Ab2-HRP conjugates were sufficient for PSA and PSMA detection. Immunoarrays were used to measure 4 biomarkers in clinical human serum samples of prostate cancer patients and controls with excellent correlation to referee enzyme-linked immunosorbent (ELISA) assays.
Introduction
Proteins present at elevated levels in blood serum that are indicative of disease states are known as biomarkers and have great potential in early cancer diagnostics and therapeutic monitoring.1,2 While single biomarkers typified by prostate specific antigen (PSA)3 are currently used for most diagnostic applications, many have limited predictive ability, e.g. ~75% for PSA. It has become increasingly apparent that sensitive and accurate detection of multiple proteins with low sample consumption is necessary for accurate disease diagnostics.1,2,4 Measurement of panels of biomarkers for a specific cancer can greatly improve prediction statistics.1,4,5–12
Ideally, multiple protein measurements in serum for cancer detection should feature low cost, high sensitivity and accuracy, and point-of-care application to avoid sample decomposition, facilitate rapid diagnosis, and minimize patient stress. Considering these requirements along with the vast number of proteins present in serum and the low (pg mL−1) normal levels of some biomarkers, development of simple bioanalytical devices to measure multiple cancer biomarkers in serum is a daunting challenge. Enzyme-linked immunosorbent assays (ELISA) have served as the workhorse for clinical protein determinations, with detection limits (DL) as low as 3 pg mL−1 for protein biomarkers,3,13,14 but they are difficult to adapt to point-of-care use. ELISA suffers limitations in analysis time, sample size, and simultaneous measurement of collections of proteins. Recently commercialized bead-based immunoassay systems based on electrochemiluminescence provide very good DL for proteins but require relatively expensive instruments for automated analyses.15 Commercial kits for one protein per sample, and kits for selected sets of up to 10 specific proteins are also available (Roche Diagnostics, Meso Scale Discovery, Millipore). Modern LC-MS proteomics can achieve multiple biomarker measurements approaching the necessary sensitivity and DL,4,6,16 but current technology is too costly, labor intensive, and complex for routine point-of-care diagnostics. Other emerging methodologies for sensitive protein measurement include polymerase amplification of affinity DNA probes17 and systems based on nanomaterials, including nanowire transistors.18–20
Bioelectronic and optical protein microarrays may have more immediate promise to achieve relatively simple but accurate and sensitive point-of-care devices.7,21–25 Examples of high sensitivity bioelectronic immunosensors for single-tumor markers with excellent DL suitable for cancer screening have been reported.26–29 Wilson et al. used small immunoelectrochemical arrays to obtain excellent detection limits and sensitivities for several proteins.30,31
We recently utilized nanostructured electrodes coupled with multilabel immunoelectrochemical detection to achieve low pg mL−1 detection limits for PSA28,29 and interleukin-6 (IL-6) in serum.32 The accuracy of these sensors was demonstrated for PSA in serum of cancer patients as well as in tissue lysates.28,29 These studies established DLs below that of normal serum levels of most cancer biomarker proteins and laid the groundwork for developing arrays utilizing similar design principles.
In the present paper, we report a simple 4-electrode array to simultaneously and accurately detect four different cancer biomarkers in serum, all of which are elevated in prostate cancer patients. The biomaker proteins are PSA,3 prostate specific membrane antigen (PSMA),33 platelet factor-4 (PF-4)34 and Interleukin-6 (IL-6)13a (See Supporting Information for background). Each sensor unit in the 4-electrode array was coated with a nanostructured assembly consisting of a dense layer of upright single-wall carbon nanotubes (SWNT) called a SWNT forest.19,28 This layer features carboxylated nanotube ends extending outward from the sensor surface to provide a conductive, high area surface for covalent attachment of a large population of capture antibodies. As with individual SWNT protein immunosensors,28 the array method employed a sandwich assay format in which the primary antibodies attached onto each individual sensor unit captured the analyte protein from the sample. After washing with solutions of detergents and proteins to block nonspecific binding (NSB) of labeled species, a labeled secondary antibody is added that binds to the analyte on the sensor surface. The label here is horseradish peroxidase (HRP), which gives a large catalytic amperometric reduction signal when activated by hydrogen peroxide using a quinone mediator. For PSA and PSMA, detection of clinically relevant levels in serum was possible using a singly labeled secondary antibody. However, PF-4 and IL-6 required higher sensitivity and necessitated a strategy involving the use of biotinylated secondary antibodies (Ab2) that bind specifically to a streptavidin-HRP bioconjugate to provide 14 to 16 labels on each Ab2.32 SWNT immunoarrays were used to measure the 4 biomarkers in human serum samples with excellent correlations to standard enzyme-linked immunosorbent (ELISA) assays.
EXPERIMENTAL SECTION
Chemicals and Materials
Bovine serum albumin (BSA), casein and Tween-20 were from Sigma-Aldrich. To obtain pure prostate specific membrane antigen (PSMA), the human coding sequence was subcloned into a pEF1/His expression vector (Invitrogen, Carlsbad, CA), expressed, and purified (see Supporting Information). Monoclonal (Mouse) primary anti-human prostate specific antigen (PSA) antibody (clone no. CHYH1), tracer secondary anti-PSA antibody (clone no. CHYH2) with HRP conjugation, monoclonal (Mouse) primary anti-human PSMA antibody (clone no. CHYH2), secondary anti-PSMA antibody (clone no. CHYH1) with HRP conjugation were obtained from Anogen/Yes Biotech Lab, Ltd. PSA standard was from Sigma-Aldrich. Monoclonal anti-human Interleukin-6 (IL-6) antibody (clone no. 6708), biotinylated anti-human IL-6 antibody, recombinant human IL-6 (carrier-free) in calf serum and streptavidin-horseradish peroxidase (HRP) were from R&D systems. Monoclonal anti-human CXCL4/PF-4 antibody, recombinant human PF-4 (carrier-free), and biotinylated anti-human PF-4 antibody were obtained from R&D systems. Human serum samples were obtained from Capital Biosciences (Rockville, MD). Ten samples were from males who were diagnosed with prostate cancer and 4 samples were from normal females and served as normal controls. Single-walled carbon nanotubes (HiPco) were from Carbon Nanotechnologies, Inc. 2,2’-Azino-Bis(3-ethylbenzthiazoline- 6-sulfonic acid) was from Sigma. Immunoreagents were dissolved in pH 7.0 phosphate saline (PBS) buffer (0.01 M in phosphate, 0.14 M NaCl, 2.7 mM KCl) unless otherwise noted. 1-(3-(dimethylamino)-propyl)-3-ethylcarbodiimide hydrochloride (EDC) and N-hydroxysulfosuccinimide (Sulfo-NHS) from Sigma were dissolved in water immediately before use. Hydrogen peroxide (H2O2, 30%) was from Fisher.
Instrumentation
An eight-electrode CHI 1030 electrochemical workstation was used for amperometry at ambient temperature (22±2 °C) in an electrochemical cell with a top that accommodated the bundled 4-electrode array. Amperometry was done at −0.3 V vs SCE with the SWNT immunosensor array with solution magnetically stirred at 2500 rpm.
Fabrication of SWNT Immunoarrays
The 4-electrode arrays were similar to those used earlier for toxicity screening.35 They consisted of 4 demountable bundled, abraded disks (A= 0.16 cm2) of ordinary pyrolytic graphite (Momentive Performance Materials) embedded in heat shrinkable tubing each separated by ~10 mm. SWNT forests were assembled onto each electrode from aged, oxidized SWNT dispersions in DMF on these disks using procedures reported previously for individual sensors.28
Antibody attachment to the SWNT sensors and assay protocols were designed starting with optimal conditions found for each individual protein standard, and evolving a common method to obtain appropriate responses in physiological concentration ranges for all 4 biomarkers. Capture antibodies (Ab1) were attached by first depositing 30 µL freshly prepared 400 mM EDC and 100 mM NHSS in water onto the SWNT forest sensor units, and washing with water after 10 min. This was followed by treatment for 3 h with 20 µL of 2 nmol mL−1 primary anti-PSA, anti-PSMA, anti-PF-4 or anti-IL-6 antibody in pH 7.0 PBS buffer on the relevant sensor unit. Arrays were then washed successively with 0.05% Tween-20 in PBS buffer and PBS buffer to remove unreacted antibodies. Sensitivity of the immunoarray was improved by minimizing non-specific binding (NSB) employing washing steps to block labeled antibody binding on the array surface. Thus, array elements were incubated for 1 h with 20 µL 0.4% saturated casein + 0.05% Tween-20, followed by 0.05% Tween-20 in PBS buffer and PBS buffer for 3 min each. After washing the electrodes thoroughly with PBS Tween-20 and PBS buffer for 3 min, 10 µL of standard solution containing PSA (0 – 40 ng mL−1), PSMA (10 – 250 ng mL−1), PF-4 (0 – 40 ng mL−1), IL-6 (0 – 2 ng mL−1) in undiluted calf serum was incubated with each sensor unit for 1.25 h.
For patient serum analysis, 10 µL of sample was incubated with each immunosensor unit (40 µl total). Most serum samples were analyzed undiluted, but sample 8 was diluted 3x with calf serum assay because of its very high PSA levels. As normal PSMA levels are large, most of the patient samples were also diluted for the PSMA immunoassays. After washing with 0.05% Tween-20 and PBS buffer, the PSA and PSMA immunosensor units were incubated with singly labeled secondary antibody (Ab2)-HRP conjugates for 1.25 h, while PF-4 and IL-6 immunosensor units were incubated with biotinylated-Ab2 conjugates for 1 h. The electrodes were then rinsed thoroughly with PBS-Tween 20 and PBS buffer. The PF-4 and IL-6 units were incubated with streptavidin-HRP conjugates, washed after 0.5 h and the 4-unit arrays were either used immediately for assays or stored overnight at 4 °C before measurement. Measurements were made after the array was placed in an electrochemical cell containing pH 7.0 PBS and 1 mM hydroquinone mediator. The amperometric signal was developed at −0.3 V vs SCE by injecting 10 µL of 0.4 M H2O2 to achieve a 0.4 mM H2O2 concentration while stirring the solution at 2500 RPM.
Biomarkers in the serum samples were also measured using standard ELISA assays. PSA ELISA kit was from Anogen, PF-4 and IL-6 ELISA kits were from R&D systems, while for PSMA, an ELISA developed in-house was employed.
RESULTS
Immunoarray calibration
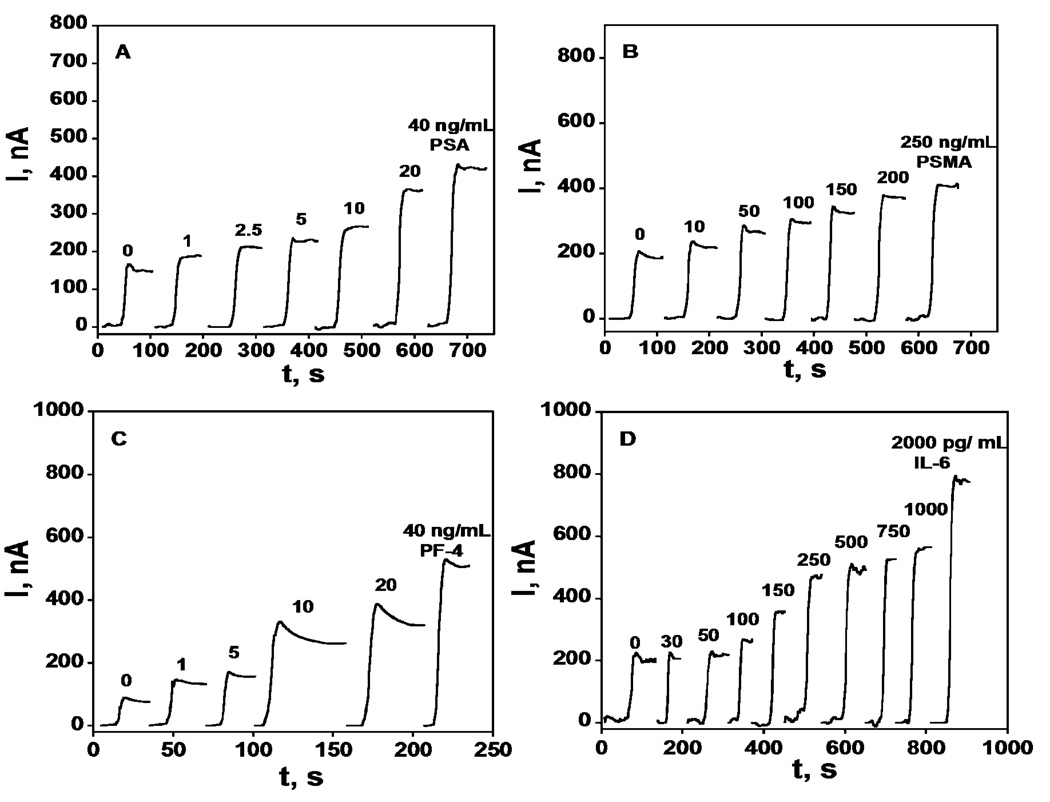
Arrays were configured with attached primary antibodies for each protein analyte on a different SWNT forest sensing unit (see Experimental). Minimizing nonspecific binding (NSB) of the labeled antibodies was crucial to achieve good sensitivity, and was done by employing a common blocking procedure evolved as a compromise for all the labeled antibodies featuring saturated casein and detergent Tween-20 in PBS buffer. After the blocking step on arrays with attached capture antibodies, arrays were incubated with analyte standards in undiluted calf serum. We previously showed that calf serum provides a very good approximation for human serum and can be used reliably in immunosensor standardization.28 PSA and PSMA sensor units were incubated with HRP-labeled secondary antibodies (Ab2-HRP) while PF-4 and IL-6 sensor units were incubated with biotinylated secondary antibodies followed by incubation with HRP-streptavidin complex to give 14–16 HRP labels per antibody,32 to enhance sensitivity. Only the Ab2-HRP specific to the analyte being measured was deposited onto the relevant array unit. After final washing, the immunoarray was placed into an electrochemical cell containing the mediator hydroquinone in buffer and hydrogen peroxide was injected to develop the amperometric response (Figure 1). Control experiments (0 ng mL−1 standard) represent a SWNT immunoarray taken through the full procedure without exposure to antigens (PSA, PSMA, PF-4, IL-6) and the response reflects the sum of residual NSB and direct reduction of hydrogen peroxide.
Figure 1.
Amperometry at −0.3 V and 2500 rpm after placing arrays in buffer containing 1 mM hydroquinone and then injecting H2O2 to 0.4 mM for SWNT immunoarrays incubated with antigen standards in 10 µL undiluted calf serum for 1.25 h followed by Ab2-HRP (A & B) or Ab2-streptavidin-HRP (C & D) in 10 µL 0.4% w/v casein and 0.05% tween 20 PBS buffer: (A) PSA, (B) PSMA, (C) PF-4, and (D) IL-6.
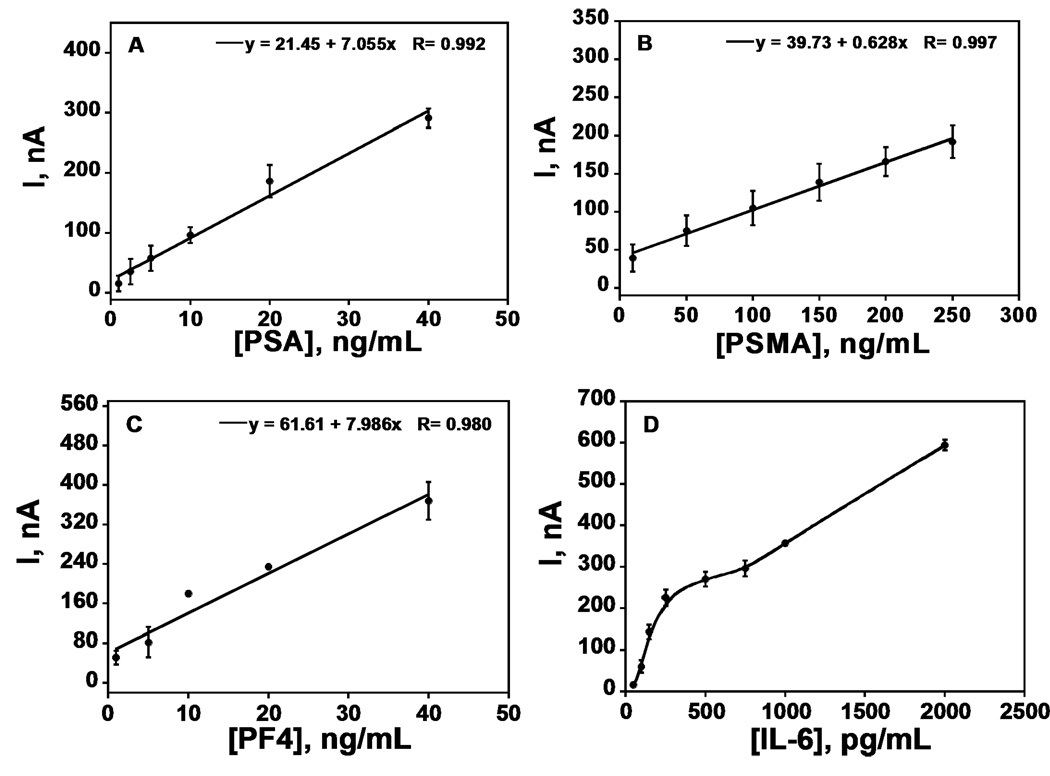
Steady state current increased linearly in clinically relevant ranges for PSA (1 – 40 ng mL−1), PSMA (10 – 250 ng mL−1), PF-4 (1 – 40 ng mL−1) (Figure 2ABC). The calibration plot for IL-6 (50 – 500 pg mL−1) was biphasic with better sensitivity below 350 pg mL−1, but overall sensitivity was appropriate for accurate measurements in the clinical range. Excellent device-to-device reproducibility is illustrated by the small error bars in Figure 2.
Figure 2.
Immunoarray calibration plots with standards in calf serum for (A) PSA, (B) PSMA, (C) PF-4, (D) IL-6 (n = 3).
The limit of detection (LD) and sensitivity of the immunoarray to each biomarker is reported in Table 1. The detection limit was measured as 3 times the average noise above the zero protein control, and was near the low end of the normal range for all biomarkers except IL-6. However, IL-6 levels are elevated well above normal in cancer patient serum (Cf. Table 1), so the DL slightly above the normal range is not a serious analytical limitation. Immunoarrays showed good sensitivities within the normal and cancer serum range for PSA, PSMA, and PF-4, and for the cancer serum range with IL-6. Table 1 also show amounts by which serum PSA PSMA, PF-4 and IL-6 levels are elevated in prostate cancer patients (Table 1).
TABLE 1.
Normal and cancer patient serum ranges, limit of detection (LD), and sensitivity of the immunosensor array
Determination of Cancer Biomarkers in Human Serum Samples
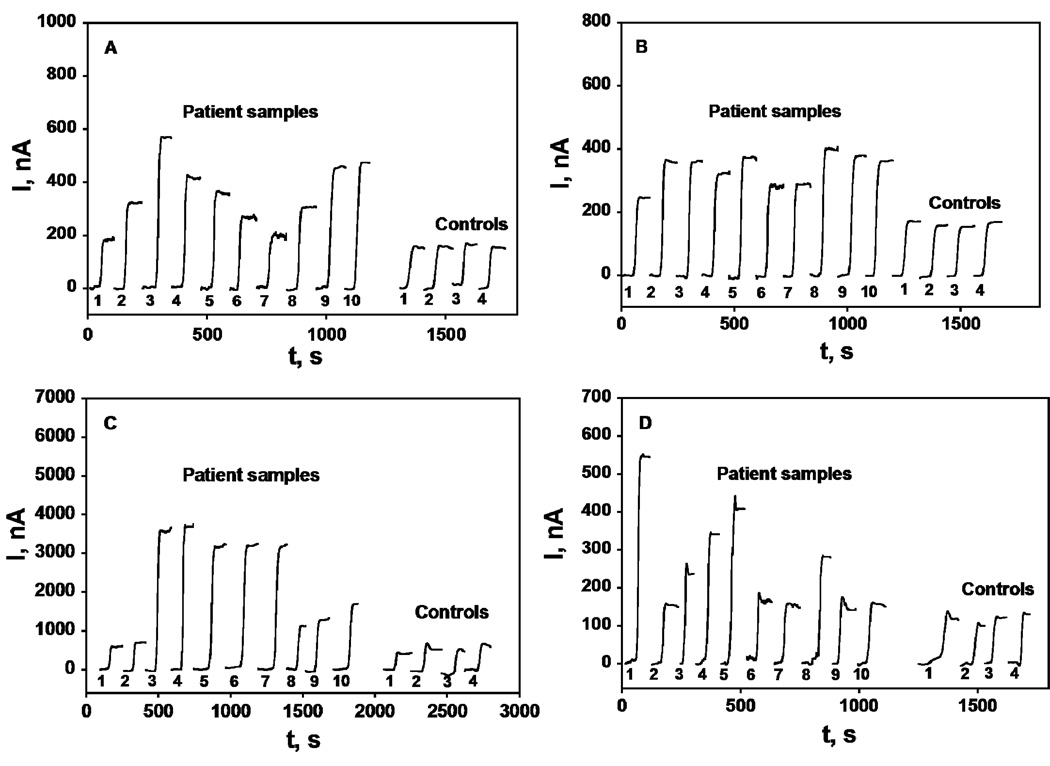
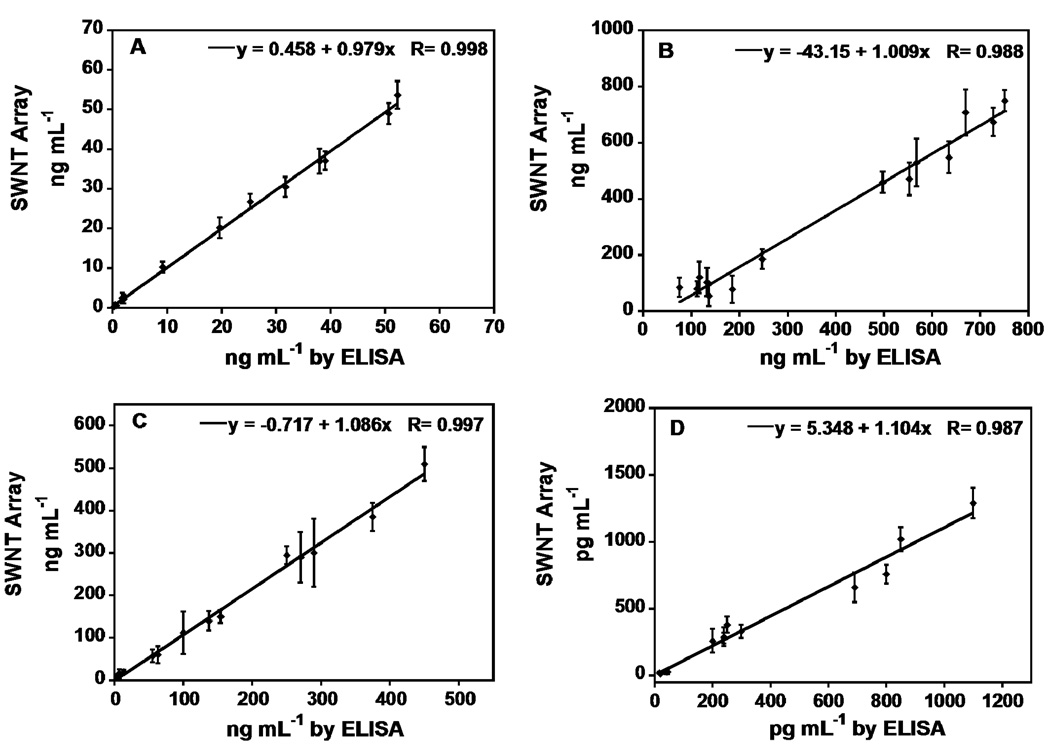
Fourteen human serum samples, 10 from male prostate cancer patients and 4 from cancer-free females, were used to evaluate the accuracy of the immunoarray. Array responses to the serum samples are shown in Figure 3. The human serum samples were also analyzed by standard ELISA methods, and results were compared with the immunoarray response (Figure 4). Immunosensor results showed a very good correlation with ELISA for all the serum samples with slopes of correlation plots close to 1.0 and intercepts near zero (see Supporting information for statistical analysis). The average deviation of the immunoarray determination from ELISA was ±10%. PSA levels were well below 1 ng mL−1 in the control samples while PSMA, PF-4 and IL-6 amounts were also normal. Samples 1–10 from cancer patients showed much higher levels of all biomarkers, as expected.
Figure 3.
Amperometry at −0.3 V and 2500 rpm after placing array in buffer containing 1 mM hydroquinone and then injecting H2O2 to 0.4 mM results for SWNT immunoarrays incubated with 40 µL human serum samples for 1.25 h followed by Ab2-HRP (A & B) or Ab2-streptavidin-HRP (C & D) in 10 µL 0.4% w/v casein and 0.05% tween 20 PBS buffer; (A) PSA, (B) PSMA, (C) PF-4 and (D) IL-6.
Figure 4.
Correlation plots of SWNT immunoarray results for human serum samples against results from ELISA determinations for the same samples (A) PSA, (B) PSMA, (C) PF-4, (D) IL-6.
Discussion
Results described above show that the SWNT immunoarrays provide good sensitivity for serum samples in clinically relevant ranges (Figure 2, Table 1), and can accurately identify and detect cancer biomarkers in complex clinical serum samples (Figure 4). These experiments also demonstrate high selectivity of the arrays for the four proteins, which are selectively determined in the presence of hundreds to thousands of additional proteins in human serum. Further, the immunoarrays are quite reproducible in the single use mode, as demonstrated by very good device-to-device standard deviations with both conventional single-label HRP-Ab2 and Ab2-strptavidin-HRP bioconjugates.
A number of cancer biomarkers have normal levels in the low pg mL−1 range with others in the ng mL−1 range (cf. Table 1).13 In this work, we have demonstrated an array procedure capable of measuring both low serum levels representative of cancer-free patients and high levels and elevated levels indicative of cancer patients. Thus, to achieve the necessary sensitivity in the very different serum concentrations ranges, singly labeled Ab2-HRP bioconjugates were sufficient for obtaining good sensitivity for PSA and PSMA, while for PF-4 and IL-6, Ab2-streptavidin-HRP bioconjugates with 14–16 HRP/Ab2 ratios were adequate for additional signal amplification. This strategy can be readily adapted to other sets of biomarkers where some member of the set require greater sensitivities than others. In addition, multiple-label nanoparticle-Ab2 bioconjugates28,29 with thousands of labels could be employed if ultrahigh sensitivity is required for some biomarkers in a set.
Signal amplification strategies also depend critically on minimizing nonspecific binding (NSB) of the labeled secondary antibody material, which often controls the detection limit of sandwich immunoassays.7,14 The procedure used here utilizing casein and detergent washed was evolved as a compromise for the 4 individual analytes, and in fact a much better DL was obtained for IL-6 using an alternative NSB blocking procedure that was not applicable to all 4 biomarkers.
For all 4 biomarkers, the immunoarrays gave accurate determinations of human serum samples, as shown by excellent correlation of SWNT immunoarrays results with standard ELISA (Figure 4). The SWNT immunoarrays required 40 µL samples, 2–10 times less than commercial assays such as ELISA, Elecsys, IMX, and Tandem-R.14,36,37,38 An advantage of our approach is that SWNT forest fabrication to achieve the high surface area sensors is simple, and requires only room temperature, solution-based fabrication steps. SWNT forests have previously shown 4–10-fold increases in sensitivity over sensors built on bare PG surfaces.28,39 The nanotube forests also have high conductivity, and the large surface area provides a high density of primary antibodies, presumably the reason for the sensitivity enhancement.19
In summary, we have demonstrated reproducible and accurate electrochemical detection of four protein cancer biomarkers in serum using a common procedure with SWNT-based immunoarrays. These studies suggest the excellent potential for array fabrication leading to real time multiplexed cancer biomarker detection for point-of-care diagnostic assays. We are currently exploring several microelectronic arrays with larger numbers of sensing elements of micrometer size, and interfacing with microfluidics for automated sample processing.
Supplementary Material
ACKNOWLEDGEMENTS
This work was supported by PHS grant ES013557 from NIEHS/NIH and partially by the Intramural Research Program, NIDCR, NIH. We thank Debra Rood and Lawrence K. Silbart for assistance with ELISA measurements.
Footnotes
SUPPORTING INFORMATION.
Additional information on all 4 biomarkers, experimental methods, SWNT immunoarray fabrication, in-house developed ELISA protocol for PSMA detection and a graph correlating Immunoarray results with ELISA for serum samples are shown.
References
- 1.Wulfkuhle JD, Liotta LA, Petricoin EF. Proteomic applications for the early detection of cancer. Nature Rev. Cancer. 2003;3:267–275. doi: 10.1038/nrc1043. [DOI] [PubMed] [Google Scholar]
- 2.Hawkridge AM, Muddiman DC. Ann. Rev. Anal. Chem. 2009 doi: 10.1146/annurev.anchem.1.031207.112942. online, ANRV395-AC02-13. [DOI] [PMC free article] [PubMed] [Google Scholar]
- 3.Lilja H, Ulmert D, Vickers AJ. Nature Rev. Cancer. 2008;8:268–278. doi: 10.1038/nrc2351. [DOI] [PubMed] [Google Scholar]
- 4.Ferrari M. Nature Rev. Cancer. 2005;5:161–171. doi: 10.1038/nrc1566. [DOI] [PubMed] [Google Scholar]
- 5.Aebersold R, Anderson L, Caprioli R, Drucker B, Hartwell L, Smith R. J. Proteome Res. 2005;4:1104–1109. doi: 10.1021/pr050027n. [DOI] [PubMed] [Google Scholar]
- 6.Etzioni R, Urban N, Ramsey S, McIntosh M, Schwartz S, Reid B, Radich J, Anderson G, Hartwell L. Nat. Rev. Cancer. 2003;4:243–252. doi: 10.1038/nrc1041. [DOI] [PubMed] [Google Scholar]
- 7.Wilson DS, Nock S. Angew. Chem. Int. Ed. 2003;42:494–500. doi: 10.1002/anie.200390150. [DOI] [PubMed] [Google Scholar]
- 8.Weston AD, Hood L. J. Proteome Res. 2004;3:179–196. doi: 10.1021/pr0499693. [DOI] [PubMed] [Google Scholar]
- 9.Wagner PD, Verma M, Srivastava S. Ann. N. Y. Acad. Sci. 2004;1022:9–16. doi: 10.1196/annals.1318.003. [DOI] [PubMed] [Google Scholar]
- 10.Sidransky D. Nat. Rev. Cancer. 2002;2:210–219. doi: 10.1038/nrc755. [DOI] [PubMed] [Google Scholar]
- 11.Bidart JM, Thuillier F, Augereau C, Chalas J, Daver A, Jacob N, Labrousse F, Voitot H. Clin. Chem. 1995;45:1695–1707. [PubMed] [Google Scholar]
- 12.Maruvada P, Wang W, Wagner PD, Srivastava S. Biotechniques. 2005 Suppl 1:9–15. doi: 10.2144/05384su04. [DOI] [PubMed] [Google Scholar]
- 13.(a) Riedel F, Zaiss I, Herzog D, Götte K, Naim R, Hörman K. Anticancer Res. 2005;25:2761–2766. [PubMed] [Google Scholar]; (b) Williams TI, Toups KL, Saggese DA, Kalli KR, Cliby WA, Muddiman DC. J. Proteome Res. 2007;6:2936–2962. doi: 10.1021/pr070041v. [DOI] [PubMed] [Google Scholar]
- 14.Ward AM, Catto JWF, Hamdy FC. Ann. Clin. Biochem. 2001;38:633–651. doi: 10.1258/0004563011901055. [DOI] [PubMed] [Google Scholar]
- 15.Debad JB, Glezer EN, Leland JK, Sigal GB, Wholstadter J. In: Electrogenerated Chemiluminescence. Bard AJ, editor. New York: Marcel Dekker; 2004. p. 359. [Google Scholar]
- 16.Aebersold R, Mann M. Nature. 2003;422:198–207. doi: 10.1038/nature01511. [DOI] [PubMed] [Google Scholar]
- 17.Zhang H, Zhao Q, Li XF, Le XC. Analyst. 2007;132:724–737. doi: 10.1039/b704256f. [DOI] [PubMed] [Google Scholar]
- 18.Wang J. Electroanalysis. 2007;19:769–776. [Google Scholar]
- 19.Kim SN, Rusling JF, Papadimitrakopolous F. Adv. Mat. 2007;19:3214–3228. doi: 10.1002/adma.200700665. [DOI] [PMC free article] [PubMed] [Google Scholar]
- 20.Zheng G, Patolsky F, Cui Y, Wang WU, Lieber CM. Nat. Biotech. 2005;23:1294–1301. doi: 10.1038/nbt1138. [DOI] [PubMed] [Google Scholar]
- 21.Bensmail H, Haoudi A. J. Biomed. Biotechnol. 2003;4:217–230. doi: 10.1155/S1110724303209207. [DOI] [PMC free article] [PubMed] [Google Scholar]
- 22.Phelan ML, Nock S. Proteomics. 2003;3:2123–2134. doi: 10.1002/pmic.200300596. [DOI] [PubMed] [Google Scholar]
- 23.Kingsmore SF. Nature Rev. Drug Discov. 2006;5:310–321. doi: 10.1038/nrd2006. [DOI] [PMC free article] [PubMed] [Google Scholar]
- 24.Lee HJ, Wark AW, Corn RM. Analyst. 2008;133:975–983. doi: 10.1039/b717527b. [DOI] [PMC free article] [PubMed] [Google Scholar]
- 25.Warsinke A, Stocklein W, Leupold E, Micheel E, Scheller FW. Perspectives in Bioanalysis. Vol. 1. Amsterdam: Elsevier B. V.; 2007. [Google Scholar]
- 26.Ghindilis AL, Atanasov P, Wilkins M, Wilkins E. Biosens. Bioelectron. 1998;13:113–131. doi: 10.1016/s0956-5663(97)00031-6. [DOI] [PubMed] [Google Scholar]
- 27.Lin J, Ju H. Biosens. Bioelectron. 2005;20:1461–1470. doi: 10.1016/j.bios.2004.05.008. [DOI] [PubMed] [Google Scholar]
- 28.Yu X, Munge B, Patel V, Jensen G, Bhirde A, Gong JD, Kim SN, Gillespie J, Gutkind JS, Papadimitrakopoulos F, Rusling JF. J. Am. Chem. Soc. 2006;128:11199–11205. doi: 10.1021/ja062117e. [DOI] [PMC free article] [PubMed] [Google Scholar]
- 29.Mani V, Chikkaveeraiah BV, Patel V, Gutkind JS, Rusling JF. ACS Nano. 2009;3:585–594. doi: 10.1021/nn800863w. [DOI] [PMC free article] [PubMed] [Google Scholar]
- 30.Zheng G, Patolsky F, Cui Y, Wang WU, Lieber CM. Nat. Biotech. 2005;23:1294–1301. doi: 10.1038/nbt1138. [DOI] [PubMed] [Google Scholar]
- 31.Wilson MS, Nie WY. Anal. Chem. 2006;78:2507–2513. doi: 10.1021/ac0518452. [DOI] [PubMed] [Google Scholar]
- 32.Munge BS, Krause CE, Malhotra R, Patel V, Gutkind JS, Rusling JF. Electrochem. Comm. 2009;11:1009–1012. doi: 10.1016/j.elecom.2009.02.044. [DOI] [PMC free article] [PubMed] [Google Scholar]
- 33.Gosh A, Heston WDW. J. Cell. Biochem. 2004;91:528–539. doi: 10.1002/jcb.10661. [DOI] [PubMed] [Google Scholar]
- 34.Kim JY, Song HJ, Lim HJ, Shin MG, Kim JS, Kim HJ, Kim BY, Lee SW. Mol. Cell. Proteomics. 2008;7:431–441. doi: 10.1074/mcp.M700194-MCP200. [DOI] [PubMed] [Google Scholar]
- 35.Wang B, Jansson I, Schenkman JB, Rusling JF. Anal Chem. 2005;77:1361–1367. doi: 10.1021/ac0485536. [DOI] [PubMed] [Google Scholar]
- 36.Vessella R, Noteboom J, Lange PH. Clin. Chem. 1992;38:2044–2054. [PubMed] [Google Scholar]
- 37.Woodruma D, French CM, Hill TM, Roman SJ, Slatore HL, Shaffer JL, York LG, Eure KL, Loveland KG, Gasior GH, Southwick PC, Shamel LB. Clin. Chem. 1997;43:1203–1208. [PubMed] [Google Scholar]
- 38.Butch AW, Crary D, Yee M. Clin. BioChem. 2002;35:143–145. doi: 10.1016/s0009-9120(02)00280-1. [DOI] [PubMed] [Google Scholar]
- 39.Yu X, Kim S, Papadimitrakopoulos F, Rusling JF. Mol. Biosys. 2005;1:70–78. doi: 10.1039/b502124c. [DOI] [PubMed] [Google Scholar]
Associated Data
This section collects any data citations, data availability statements, or supplementary materials included in this article.


