

Abstract
Although the fungus Candida albicans is a commensal colonizer of humans, the organism is also an important opportunistic pathogen. Most infections caused by C. albicans arise from organisms that were previously colonizing the host as commensals, and therefore successful establishment of colonization is a prerequisite for pathogenicity. To elucidate fungal activities that promote colonization, an analysis of the transcription profile of C. albicans cells recovered from the intestinal tracts of mice was performed. The results showed that within the C. albicans colonizing population, cells expressed genes characteristic of the laboratory-grown exponential phase and genes characteristic of post-exponential-phase cells. Thus, gene expression both promoted the ability to grow rapidly (a characteristic of exponential-phase cells) and enhanced the ability to resist stresses (a characteristic of post-exponential-phase cells). Similarities in gene expression in commensal colonizing cells and cells invading host tissue during disease were found, showing that C. albicans cells adopt a particular cell surface when growing within a host in both situations. In addition, transcription factors Cph2p and Tec1p were shown to regulate C. albicans gene expression during intestinal colonization.
The opportunistic human pathogen, Candida albicans, is commonly found as a component of the normal flora of humans, residing in the gastrointestinal tract, in the genitourinary tract, and on the skin (43, 54). Colonizing organisms are thought to be benign, but in an immunocompromised host, colonizing organisms give rise to invasive organisms that are capable of causing life-threatening infections. Since C. albicans lacks any apparent environmental reservoir, C. albicans cells generally grow in association with a mammalian host. C. albicans is a very effective colonizer of humans. For example, Russell and Lay found that 47% of 1-month-old infants were orally colonized with C. albicans, and 49% were colonized with other fungi (46). To achieve such efficient colonization, C. albicans cells must possess adaptations that optimize their ability to colonize. The activities that promote commensal colonization in a healthy host could uniquely function only during colonization, or they may be identical to the activities that promote virulence in an immunocompromised host.
Some activities that determine the level of intestinal colonization that C. albicans can achieve have been described. For example, proteins that influence adherence (Ece1p [7, 41] and Int1p [18]) affect colonization (26, 66). In addition, the transcription factor Efh1p regulates colonization levels in the murine intestinal tract, although Efh1p is not required for producing fatal disseminated disease after intravenous inoculation of mice (66). Therefore, this gene encodes an activity that affects growth in the commensal state but is not needed for causing disease.
In addition to factors associated with C. albicans, host activities, such as cytokines or T cells, influence the level of colonization by C. albicans. Helstrom and Balish showed that thymus intact BALB/c mice orally inoculated with C. albicans cleared the organism by 16 days postinoculation, but nude mice were colonized at high levels at the same time point (22). In mutant mice lacking the immunosuppressive cytokine interleukin-10 (IL-10), C. albicans colonizes the gastrointestinal tract at lower levels (11). In contrast, mice lacking the protective cytokine IL-12 are colonized to higher levels (68). Therefore, changes in host status change the level of C. albicans colonization, and colonization levels thus reflect an interplay between activities of the fungal cells and activities of the host.
To understand how C. albicans adapts to an environment within the host, we undertook an analysis of gene expression in C. albicans cells colonizing the murine intestinal tract. The results showed that colonizing cells expressed many genes that were characteristic of cells growing in post-exponential phase in laboratory conditions. For example, like post-exponential-phase cells, cells growing in the cecum expressed stress-induced genes. However, colonizing cells also expressed genes that are characteristically expressed in growing, exponential-phase cells. Thus, cells growing in the host were not strictly analogous to either laboratory-defined growth phase. Cells colonizing the intestinal tract and cells invading host tissue were found to express many of the same cell surface protein-encoding genes. In the laboratory, expression of many of these genes is coupled to cellular morphology, specifically to filamentous, hyphal morphology. In the host, in contrast, these genes are expressed in either yeast-form cells that are colonizing the intestinal tract or filamentous cells that are invading tissue (60). Thus, the expression of these genes defines a particular cell surface that is expressed during growth within a host, independent of cellular morphology. In addition, previous studies showed that the regulatory circuit that governs expression of these genes in the host differs from the regulatory circuits that regulate their expression in laboratory studies (57, 66). We show here that the transcription factors Cph2p and Tec1p are important for gene expression during colonization.
MATERIALS AND METHODS
Strains.
Genotypes of C. albicans strains are described in Table S7 in the supplemental material. All C. albicans strains were derived from the wild-type (WT) clinical strain SC5314 (17). UAU mutants (16) in which either CPH2 or TEC1 were disrupted were kindly provided by A. Mitchell (Carnegie Mellon). Strain HLY1928 (30), a homozygous cph2 deletion mutant, and HLY1929 (30), the reconstituted strain in which CPH2 was added back to the deletion mutant, were kindly provided by H. Liu (University of California, Irvine). Laboratory strains DAY185 (10) or SN100 (42), kindly provided by A. Mitchell (Carnegie Mellon) and A. Johnson (University of California, San Francisco), respectively, were used as WT controls.
Laboratory growth conditions.
Standard rich media was YPD (1% yeast extract, 2% peptone, 2% glucose). Minimal dropout medium (lacking uracil, histidine, arginine, or combinations) were as described previously (52). For plating contents of the intestinal tract, YPD agar medium supplemented with 50 μg of ampicillin/ml and 100 μg of streptomycin/ml (YPD SA) was used.
For gene expression studies, reference cells were grown in YPD liquid medium at 37°C for 3 days. Cells were also grown in YPD liquid medium at 37°C for 5 h (exponential phase).
RNA extraction.
Female C57BL/6 mice (5 to 7 weeks old) were treated with tetracycline (1 mg/ml), streptomycin (2 mg/ml), and gentamicin (0.1 mg/ml) added to their drinking water for the duration of the experiment, beginning 4 days prior to inoculation with C. albicans. C. albicans cells (5 × 10⁷ cells) were orally inoculated into the mice by gavage. At 3 days postinoculation, the mice were sacrificed, and the contents of the cecum were recovered and frozen in RNALater (Ambion) at −80°C. Cecum contents were filtered through 500-μm-pore-size polypropylene mesh (Small Parts, Inc.) to remove large particles, and RNA was extracted by bead beating with 0.5-mm zirconia/silica beads in TRIzol (Invitrogen). After the TRIzol RNA purification procedure described by the manufacturer, RNA was further purified on Qiagen columns with on-column DNase treatment. Four biological replicates of cecum-derived C. albicans RNA were analyzed.
Reference RNA from cells grown in YPD medium at 37°C was extracted by using Qiagen procedures with mechanical disruption and on-column DNase digestion (four biological replicates).
Microarrays.
Microarrays containing 70-mer oligonucleotide probes for 6,333 open reading frames (ORFs) encoded in the C. albicans genome were performed as described previously (39). Methods used for probe construction with oligo(dT) priming and hybridization were as described by Nantel et al. (39), with modifications made as described by Dignard and Whiteway (13).
Searching for SRE-1 in C. albicans genomic sequence.
Using an SRE-1 weight matrix obtained from examining 11 SRE-1 elements (34), adapted from (30), the Matrix Scan tool from the RSA Tools website (http://rsat.ulb.ac.be/rsat/) was used to look for multiple consecutive SRE-1 sequences in upstream regions of genes.
Quantitative real-time RT-PCR.
For the quantitative real-time reverse transcription-PCR (RT-PCR) experiments, RNA was extracted from new sets of mice as described above. Total RNA was converted to cDNA by incubation with Superscript II reverse transcriptase (Invitrogen) using an oligo(dT) primer and purified as described previously (66). The primer pairs described in Table S8 in the supplemental material were used to detect gene expression.
Quantitative real-time RT PCR was performed using SYBR green detection, according to manufacturer's protocols (Qiagen). All reactions were performed in triplicate. Melting-curve analysis and/or agarose gel electrophoresis was performed after the RT-PCR amplification to verify the presence of a single product.
Measurement of intestinal colonization.
Female Swiss-Webster mice (18 to 20 g) were treated with antibiotics and inoculated with C. albicans by oral gavage, as described previously (66). Colonization was monitored by collecting fecal pellets (produced within 10 min prior to collection) on various days postinoculation and measuring the C. albicans concentrations in the pellets by plating homogenates on YPD SA plates. Mice were sacrificed on various days postinoculation, and the C. albicans concentrations in cecum contents, stomach contents, and homogenates of the ileum, kidneys, liver, and tongue were measured by plating them on YPD SA plates. Composite results from at least two experiments are shown.
RESULTS
Analysis of the transcriptome of C. albicans cells growing in the murine cecum.
To gain a more complete understanding of adaptations made by C. albicans to commensal growth in the intestinal tract, transcription profiling of C. albicans cells recovered from the murine intestinal tract was performed. C57BL/6 mice were orally inoculated with C. albicans to establish intestinal colonization. At 3 days postinoculation, the mice were sacrificed, the cecum contents were collected, and the RNA was isolated from the C. albicans cells as described in Materials and Methods. This RNA was then used as a template for synthesis of labeled cDNA, which was hybridized to microarrays containing 70-mer oligonucleotide probes for 6,333 annotated genes encoded in the C. albicans genome (39). Probes derived from C. albicans cells growing in the mouse cecum were compared to probes obtained from laboratory-grown cells cultured for 3 days in YPD broth at 37°C. For comparison, we also determined the profiles of cells grown in exponential phase at 37°C in YPD broth relative to cells grown for 3 days at 37°C in YPD broth.
Results showed that a total of 440 genes were differentially regulated by C. albicans cells growing in the cecum in comparison to post-exponential-phase growth in laboratory conditions, with 197 genes upregulated by >1.5-fold (P < 0.05) and 244 genes downregulated by <0.67-fold (P < 0.05) (see Table S1 in the supplemental material).
cDNA produced from RNA extracted from the cecum contents of uninfected mice showed no hybridization with the C. albicans microarrays, and RNA isolated from the cecum contents of C. albicans-colonized mice showed minimal hybridization with a mouse-gene microarray, showing that hybridizations represented bona fide C. albicans transcripts.
The physiological state of C. albicans growing in the cecum is distinct from laboratory-defined exponential and post-exponential phases.
To define exponential-phase genes (genes more highly expressed in exponential phase versus post-exponential phase) and post-exponential-phase genes (genes more highly expressed in the post-exponential phase versus the exponential phase), gene expression in laboratory-grown exponential-phase cells was compared to gene expression in laboratory-grown post-exponential-phase cells. Five hundred 56 exponential phase genes (P < 0.05; Table S2) and 567 post-exponential phase genes (P < 0.05; see Table S2 in the supplemental material) were identified. As observed previously (63), major processes whose genes were upregulated in exponential-phase cells included glucose metabolism (P < 2.2 × 10⁻¹¹), pyruvate metabolism (P < 5.6 × 10⁻⁹), and translation (P < 2.1 × 10⁻²⁸), including ribosome biogenesis (P < 1.5 × 10⁻⁵) and translation regulation (P < 3.1 × 10⁻⁵), as well as biosynthetic pathways for amino acids (P < 1.2 × 10⁻³), ergosterol (P < 1.2 × 10⁻⁸), and nucleotides (P < 2.0 × 10⁻⁶). The results were consistent with the previous observation (3, 24, 63) that C. albicans is Crabtree negative and preferentially performs oxidative phosphorylation in the presence of glucose and oxygen rather than fermentation. Accordingly, many exponential-phase genes were related to mitochondrial function, ATP synthesis, or cytochrome oxidase.
In contrast, among post-exponential-phase genes (see Table S2 in the supplemental material), fewer gene ontology (GO) terms (2) were enriched. Categories included protein refolding (chaperone proteins; P < 6.3 × 10⁻⁶), responses to nutrient levels (including starvation responses; P < 6 × 10⁻⁵), nitrogen utilization (P < 0.026), and response to stress (P < 0.042). These responses presumably reflect the exhaustion of the preferred carbon source glucose and adaptation to slower rates of growth. Many stress response genes, i.e., genes upregulated in the first 10 min of exposure to stress conditions (15), were post-exponential-phase genes (e.g., Fig. 1 and Table 1, genes 28 to 42). In other words, these genes were upregulated in post-exponential phase in the absence of exogenous stress. As noted previously, this gene expression may contribute to the higher stress resistance of post-exponential-phase cells relative to exponential-phase cells (1, 14).
Fig. 1.

Expression of growth-phase-regulated genes during growth in the cecum. Relative expression of the genes described in Table 1 is shown. A white bar indicates expression in C. albicans cells grown in YPD for 5 h (exponential phase) relative to expression in cells grown in YPD for 3 days (post-exponential phase). A black bar indicates expression in C. albicans cells recovered from the cecum relative to expression in cells grown in YPD for 3 days. Genes 1 to 27 are expressed more highly in exponential phase than in post-exponential phase (white bar > 1.5). Genes 28 to 42 are expressed more highly in post-exponential phase (white bar < 0.67).
Table 1.
Distinct physiological state of C. albicans cells recovered from the murine cecume

Gene numbering corresponds to the genes whose expression is shown in Fig. 1.
Expo indicates fold up- or downregulation in exponential-phase cells compared to that in post-exponential-phase cells.
Cecum indicates fold up- or downregulation in C. albicans cells from the cecum compared to that in post-exponential-phase cells.
Cecum/expo indicates the ratio of up- or downregulation in the cecum to that in exponential-phase cells.
P values were determined by using the Student t test. Black-shaded values, >1.5; gray-shaded values, <0.67.
In C. albicans cells recovered from the cecum, 60% of the post-exponential-phase genes (342 of 567) were expressed at levels similar to those of the post-exponential phase or higher (i.e., not at the low levels characteristic of exponential phase). These post-exponential-phase genes included genes involved in carboxylic acid transport and the glyoxylate cycle. Most of the stress response genes that were upregulated in the post-exponential phase were also upregulated during growth in the cecum (Fig. 1, Table 1). Therefore, the profile of cells growing in the cecum had substantial similarity to the post-exponential-phase profile, a finding consistent with our previous observations (66).
A total of 40% of the post-exponential-phase genes (225 of 567) were expressed at levels lower than in post-exponential-phase cells, i.e., at levels similar to expression in exponential-phase cells. These genes included protein folding genes (e.g., chaperones KAR2, HSP10, HSP12, HSP90, and HSP78) and proteolysis genes. Therefore, the levels of protein turnover were predicted to be low during growth in the cecum, as seen in exponential-phase cells.
For exponential-phase genes (those expressed more highly in the exponential phase relative to the post-exponential phase), 72% (398 of 556) were expressed in cells from the cecum at levels similar to the levels in post-exponential-phase cells, reinforcing the notion that cecum-grown cells have significant similarities to post-exponential-phase cells. However, 28% of these genes (158 of 556) were expressed more highly in cells grown in the cecum in comparison to post-exponential-phase cells (i.e., similar to their expression in exponential-phase cells; Fig. 1, Table 1). Some important categories of exponential-phase genes that were upregulated in the cecum compared to post-exponential-phase cells are discussed below.
Central metabolic pathways.
Genes encoding enzymes of glucose metabolism and other central metabolic pathways were expressed at relatively high levels during growth in the cecum (e.g., Fig. 1, Table 1, genes 1 to 8). Of note, some but not all of these genes are also upregulated during laboratory growth in a low-oxygen environment (50). Genes encoding proteins needed for the conversion of pyruvate to ethanol (e.g., PDC1 [pyruvate decarboxylase] and ADH1 [alcohol dehydrogenase]) were expressed at relatively high levels in the cecum.
In addition, the gluconeogenesis gene PCK1 was more highly expressed in cells recovered from the cecum relative to laboratory growth. Similarly, C. albicans populations recovered from murine kidneys following intravenous inoculation express both glycolytic genes and PCK1 (4). This finding is thought to reflect the occurrence of microenvironments in which glucose levels vary.
Glycolysis and fermentation genes are coordinately regulated through the function of two transcription factors, Gal4p and Tye7p (3). Genes regulated by only one of the two factors, e.g., the Gal4p-regulated genes PDA1, PDB1, and PDX1, encoding subunits of the pyruvate dehydrogenase complex, and Tye7p-regulated genes involved in trehalose, glycogen, and glycerol metabolism (3), were mostly expressed at relatively low, post-exponential-phase levels. In summary, genes related to glucose metabolism and fermentation, particularly those regulated by both Gal4p and Tye7p, were upregulated in the cecum relative to post-exponential-phase laboratory-grown cells.
Many genes involved in the mitochondrial electron transport chain were upregulated by C. albicans growing in the cecum. Since the cecum is an environment with minimal oxygen (21), this result suggests that cytochrome c oxidase could have a second function, as observed in Saccharomyces cerevisiae (9).
Translation.
Many ribosomal protein genes were expressed at levels intermediate between exponential phase and post-exponential-phase laboratory-grown cells (e.g., Fig. 1 and Table 1, genes 9 to 18). Translation elongation genes were mostly expressed at levels above the levels seen in post-exponential-phase cells, i.e., at intermediate- or exponential-phase levels. In contrast, aminoacyl-tRNA synthetases that were growth phase regulated were expressed at levels resembling post-exponential phase cells (e.g., Fig. 1 and Table 1, genes 19 to 27). Similarly, translation initiation genes were mostly expressed at levels similar to those seen in post-exponential-phase cells. Thus, some components required for translation were upregulated relative to post-exponential-phase cells, but not all.
In summary, C. albicans cells growing in the cecum appear to be actively growing and utilizing fermentative pathways. The population of cells growing in the cecum expressed genes characteristic of both laboratory grown exponential-phase cells and laboratory grown post-exponential-phase cells. Some pathways were expressed as highly in cells from the cecum as in exponential-phase cells (glucose metabolism), some genes were expressed at intermediate levels (ribosomal genes)- and other genes were expressed at the same levels as in post-exponential-phase cells (isocitrate lyase, aminoacyl-tRNA synthetase genes).
Expression of genes not regulated by growth phase during growth in the cecum.
To study those genes whose expression is not linked to growth phase during laboratory growth, the data set was filtered to remove from consideration all genes that were differentially expressed in the exponential phase versus the post-exponential phase by a factor of >1.5-fold. Analysis of this subset of genes revealed a number of categories that were differentially expressed in cells recovered from the cecum relative to laboratory-grown cells.
Consistent with our previous findings (66), genes that were upregulated in laboratory grown hyphae were upregulated in cells recovered from the cecum. These genes included hypha-coregulated genes such as HWP1, PGA7/RBT6, and ECE1. Four genes that are galactose inducible in the laboratory (GAL1, GAL7, GAL10, and PCK1 [36]) and MAL31, a putative maltose permease, were upregulated during growth in the cecum, reflecting the low levels of glucose in the intestinal tract (37).
Among genes downregulated in the cecum relative to laboratory growth, several genes represented functions related to proteolysis (proteasome components, a chaperone, a ubiquitin-related gene, and vacuolar proteins). This finding is consistent with the observation that post-exponential phase-expressed chaperones and proteolysis genes were expressed at relatively low levels.
An additional group of genes that were downregulated in the cecum belong to the subtelomeric TLO family (64). This family of putative transcription factors has 14 members and 13 of the 14 are located in subtelomeric regions. These genes are regulated by C. albicans Gal4p (36), but their function is unknown. The relatively low expression of these genes was consistent with the relatively low expression of the Gal4p-regulated pyruvate dehydrogenase genes PDA1, PDB1, and PDX1.
Gene expression during growth in the cecum in comparison with laboratory conditions.
To learn more about the physiological state of C. albicans growing in the cecum and the relevant features of the cecum environment, gene expression in cells recovered from the cecum was compared to gene expression in cells growing in various lab conditions. A total of 6,321 genes with ORF19 designations were used for this analysis. Most published studies of laboratory-grown cells use exponential-phase cells as their reference condition. Therefore, to compensate for the fact that our study used post-exponential-phase cells as the reference condition, the microarray data for cecum-grown cells were divided by the microarray data for exponential-phase cells, and the resulting data were analyzed to obtain genes that were upregulated during growth in the cecum relative to exponential-phase cells. From this analysis, 408 genes (see Table S3 in the supplemental material) that fell into the following categories were selected to define the cecum-upregulated collection: (i) genes that were not growth phase regulated and were upregulated during growth in the cecum (P < 0.05) (55 genes), (ii) post-exponential-phase genes (P < 0.05) that were expressed at post-exponential (i.e., relatively high) levels during growth in the cecum (325 genes), (iii) exponential-phase genes (P < 0.05) that were very highly upregulated (P < 0.05) during growth in the cecum (27 genes), and (iv) TEC1 (P = 0.055).
From the frequencies with which up- or downregulated genes were observed under various conditions, the number of common genes expected to be up- or downregulated in both the cecum and another condition was calculated and compared to the number of genes observed to be up- or downregulated in both the cecum and another condition (Table 2, Fig. 2A). In several cases, the number of observed cecum upregulated genes that were also upregulated in another condition was significantly greater than the number expected by chance (Table 2, Fig. 2A). These conditions included biofilm growth (40), growth at alkaline pH (6), growth in hypoxic conditions (50), growth in galactose (36), and growth in the following stress conditions: temperature upshift (15), osmotic shock (15), growth in the presence of 3-aminotriazole (3-AT; a competitive inhibitor of an enzyme involved in histidine biosynthesis) (62), or carbon starvation (33).
Table 2.
Comparison of C. albicans gene expression during growth in the cecum and growth under laboratory conditions
| Gene type and condition | No. of genes | No. of genes |
Pc | No. of filtered upregulated genesd | Filtered overlap (no. of genes)f |
Filtered P valued | ||
|---|---|---|---|---|---|---|---|---|
| Overlap expecteda | Overlap observedb | Expected | Observed | |||||
| Upregulated genes | ||||||||
| Cecum | 408 | 358 | ||||||
| Alkaline pHe | 247 | 16 | 49 | 4 × 10⁻¹⁶ | 204 | 12 | 35 | 2 × 10⁻¹⁰ |
| Hypoxiaf | 46 | 3 | 17 | 3 × 10⁻¹⁵ | 36 | 2 | 10 | 6 × 10⁻⁷ |
| Galactoseg | 82 | 5 | 30 | 8 × 10⁻²⁷ | 71 | 4 | 25 | 7 × 10⁻²⁴ |
| Biofilmh | 479 | 31 | 104 | 1 × 10−42 | 444 | 26 | 91 | 1 × 10−39 |
| 37°C, 10 mini | 81 | 4 | 26 | 7 × 10⁻¹⁹ | 71 | 4 | 24 | 1 × 10⁻²¹ |
| Osmotic shock, 10 mini | 106 | 7 | 28 | 4 × 10⁻¹⁵ | 94 | 6 | 23 | 6 × 10⁻¹³ |
| 3-ATj | 336 | 22 | 76 | 9 × 10⁻³³ | 303 | 18 | 60 | 7 × 10⁻²⁴ |
| C starvationk | 102 | 7 | 25 | 5 × 10⁻¹² | 95 | 6 | 21 | 7 × 10⁻¹⁰ |
| Downregulated genes | ||||||||
| Cecum | 467 | |||||||
| Alkaline pHe | 221 | 16 | 12 | NS | ||||
| Hypoxiaf | 20 | 1 | 2 | NS | ||||
| Biofilmh | 457 | 34 | 107 | 9 × 10−40 | ||||
| 37°C, 10 mini | 154 | 11 | 8 | NS | ||||
| Osmotic shock, 10 mini | 105 | 8 | 8 | NS | ||||
| Oxidative stress, 60 mini | 39 | 3 | 9 | 3 × 10⁻³ | ||||
| C starvationk | 31 | 2 | 8 | 2 × 10⁻³ | ||||
| 3-ATj | 313 | 23 | 143 | 6 × 10−153 | ||||
Calculated as: (total genes) × (frequency upregulated in cecum) × (frequency upregulated under the indicated condition).
That is, cecum upregulated genes that were also upregulated under the indicated condition.
That is, the P value determined by the chi-square test. NS, not significant.
Filtering to remove genes that were upregulated in hyphal cells was performed using the data of Goyard et al. (19) or Kadosh et al. (25).
According to Bensen et al. (6).
According to Setiadi et al. (50).
According to Martchenko et al. (36).
According to Nett et al. (40).
According to Enjalbert et al. (15).
According to Tournu et al. (62).
According to Lorenz et al. (33).
Fig. 2.

Genes upregulated during growth in the cecum and in laboratory conditions. (A) Expected number of genes that would be upregulated during both growth in the cecum and growth in another condition, based on chance (gray bar). The value was calculated from the frequencies of upregulated genes that were observed in each data set. The black bar shows the number of genes that were observed to be upregulated in both conditions. E, expected; O, observed. **, P < 10−30; *, P < 10−10. (B) Percentage of genes in different classes. The white bar with thick lines indicates the percentage of hyphal genes (upregulated during hyphal growth in either the study of Kadosh and Johnson [25] or the study of Goyard et al. [19]). Genes that were not hyphal genes and were upregulated in at least one stress condition (oxidative stress [any of three time points] [15], osmotic shock [three time points] [15], temperature shift [three time points] [15], 3-AT [62], or starvation [carbon or nitrogen] [33]) were defined as stress genes (gray section). The percentage of genes that were neither hyphal nor stress genes and were upregulated in one of the other conditions is shown in the white section. The percentage of genes that were upregulated only in the indicated condition is shown in the black section.
As described above, hypha-coregulated genes were expressed in cells growing in the cecum. To determine whether expression of the hyphal regulon accounted for the common genes observed above, the data were filtered to remove from consideration all genes that were upregulated in hyphae in either the study of Goyard et al. (19) or the study of Kadosh and Johnson (25). In the absence of hypha-coregulated genes, statistically significant overlaps between the cecum upregulated genes, and the same conditions were still observed (Table 2).
To determine whether the overlapping genes were the same in each condition or were different, we analyzed the expression of specific genes in different conditions (see Table S5 in the supplemental material). No genes were upregulated in all conditions but several genes were upregulated in more than one condition. A total of 17 to 42% of the genes were upregulated in only one of the characterized conditions (Fig. 2B). Therefore, upregulation of these genes was characteristic of a given condition. This analysis showed that cells grown in the cecum expressed genes that were characteristic of cells grown in alkaline pH, in hypoxic conditions, and with low levels of glucose. Therefore, it is likely that a response to environmental pH promotes upregulation of pH-regulated genes, a response to low oxygen levels leads to expression of hypoxia-regulated genes and a response to low levels of glucose promotes expression of low-glucose upregulated genes. Some of the cells adhere to surfaces within the intestinal tract, establish a sessile state, and express genes characteristic of biofilms.
In addition, cecum-grown cells expressed genes characteristic of various stress conditions. Stress-responsive genes that were upregulated in more than one stress condition and also during growth in the cecum included heat shock genes (HSP12, HSP104, HSP30), GRP2 (similar to S. cerevisiae methylglyoxal reductase), GPX2 (similar to glutathione peroxidase), SOD5 (encoding a superoxide dismutase [35]), and YHB1 (encoding a flavohemoglobin [23, 32]). Therefore, cells in the cecum express a variety of stress response genes. For downregulated genes, fewer conditions showed significant similarity to the profile of gene expression in the cecum. Biofilm growth (40), growth in 3-AT (62), and carbon starvation (33) showed similarity (Table 2). In these cases, 75 to 86% of the genes were downregulated in only one of the three conditions; one gene was downregulated in all three conditions (see Table S6 in the supplemental material).
Some aspects of gene expression in the cecum were not seen in other data sets. For example, the increased expression of genes encoding mitochondrial electron transport components was not observed in other laboratory growth conditions. In addition, upregulation of a number of transporters was observed during growth in the cecum but not in other conditions.
In summary, the relevant features of the environment that influence gene expression in colonizing cells include oxygen levels, pH levels, and glucose levels.
Expression of a host-adapted cell surface during colonization.
C. albicans cells may colonize a host as commensals or may initiate disease and invade host tissue. To compare gene expression in these two situations, the transcription profile of colonizing cells was compared to the profile of cells invading the liver after intraperitoneal inoculation (60), the kidney after intravenous inoculation (65), or the tongue in oral infection (67).
As shown in Table 3, the number of genes that were upregulated during both cecum colonization and growth in the murine liver (P < 10−3), in the murine kidney (P < 10−55), or during oral infection (P < 10−9) was higher than the number expected by chance. For invasion of the liver, the number of downregulated genes in common was also higher than expected by chance. These data show that cells colonizing the cecum or causing infection express common genes.
Table 3.
Comparison of C. albicans gene expression during commensal colonization of the cecum and during candidiasis
| Gene type and condition | No. of genes | No. of genes |
Pc | No. of filtered upregulated genesd | Filtered overlap (no. of genes)d |
Filtered P valued | ||
|---|---|---|---|---|---|---|---|---|
| Overlap expecteda | Overlap observedb | Expected | Observed | |||||
| Upregulated genes | ||||||||
| Cecum | 408 | 358 | ||||||
| Kidneye | 35 | 2 | 26 | 1 × 10−56 | 31 | 2 | 20 | 3 × 10−42 |
| Liver, 5 hf | 167 | 11 | 24 | 6 × 10⁻⁴ | 145 | 9 | 15 | NS |
| Thrushg | 49 | 3 | 15 | 4 × 10⁻¹⁰ | 37 | 2 | 8 | 1 × 10⁻³ |
| Downregulated genes | ||||||||
| Cecum | 467 | |||||||
| Kidneye | 37 | 3 | 9 | 1 × 10⁻³ | ||||
| Liver, 5 hf | 92 | 8 | 20 | 2 × 10⁻⁴ | ||||
| Thrushg | none | |||||||
Calculated as: (total genes) × (frequency upregulated in cecum) × (frequency upregulated under the indicated condition).
That is, cecum upregulated genes that were also upregulated under the indicated condition.
That is, the P value determined by the chi-square test.
Filtering to remove genes that were upregulated in hyphal cells was performed using the data of Goyard et al. (19) or Kadosh et al. (25). NS, not significant.
According to Walker et al. (65).
According to Thewes et al. (60).
According to Zakikhany et al. (67).
To analyze individual genes, genes upregulated in at least one of the tissue invasion datasets were considered to be invasion upregulated genes (235 genes) and were compared to the 408 genes defined as cecum upregulated. Forty-six genes were upregulated during both intestinal tract colonization and tissue invasion (Table 4).
Table 4.
C. albicans genes upregulated during colonization of the cecum and invasion of host tissue
| Function or location | Genesa |
|---|---|
| Adhesion | ALS10, ALS1, SUN41, ECE1 |
| Response to chemical stimuli | PHR1, TOS1, GAL10, SOD5 |
| Transporter | HGT1, ENA2, COR1, PHO84, PHO89, FRP2, FRP3, CDR1, CAN2,DIP5, ORF19.1172, ORF19.2292 |
| Cell surface | IHD1, PLB4, PGA7, PGA54 |
| Metabolic activity | ADH5, MLS1, ENO1, PCK1, IDP2, CTN3, FAA4 |
| Miscellaneous | GAC1, PPQ1, AFG3, MRK1 (RIM11), POL93, ADR1, PRB2, VPS21 |
| Unknown | ORF19.2659, ORF19.3902, ORF19.5848, ORF19.2515, ORF19.6688, ORF19.6169, ORF19.3713 |
Underlined genes are upregulated in laboratory-grown hyphae (19, 25) and as presented in the Candida Genome Database (www.candidagenome.org).
Many of the common genes encoded cell surface proteins (Table 4), some of which were previously shown to be involved in pathogenesis or host cell interaction. Thus, during intestinal tract colonization or invasion of tissue, a particular cell surface, defined by expression of these genes, is presented to the host. Many of the genes in this category were previously identified as hypha-coregulated genes based on expression in laboratory-grown hyphae (e.g., ECE1 [7]; underlined in Table 4). However, during growth within a host these genes are expressed when C. albicans is in either the hyphal form (tissue invasion) or the yeast form (intestinal tract colonization). Therefore, expression of these genes produces a certain cell surface during growth within a host, independent of cellular morphology.
Differences in gene expression between cells colonizing the intestinal tract and cells invading deep tissue identify invasion-specific functions.
The C. albicans genome contains multigene families encoding secreted aspartic proteases and phospholipases. These enzymes promote the virulence of C. albicans in some animal models of infection (48). Therefore, it might be expected that these genes would show an invasion specific pattern of expression. However, SAP5, encoding a secreted aspartic protease, is expressed in multiple host niches, including the intestinal tract (27) and, in our data, showed a trend toward upregulation (2.4-fold upregulated in cecum [P < 0.11], not growth phase regulated) in cells colonizing the intestinal tract. This gene is upregulated during tissue invasion (60). Other SAP genes showed no evidence of upregulation in either colonizing or invading cells based on microarray data.
Using a highly sensitive technique, Staib et al. detected expression of SAP2, SAP5, and SAP6 during murine infection (56). The technique used relies on expression of a site-specific recombinase under the control of the promoter of a gene of interest. With this technique, while transient expression of a gene of interest results in transient expression of recombinase, recombinase activity results in permanent excision of a marker gene. Thus, the relationship between the percentage of cells that have undergone excision and the percentage of cells that are expressing the gene of interest at any given time is complex. Microarray results suggest that, except for SAP5, the number of cells expressing a SAP gene at the same time is not large enough to permit detection of SAP gene upregulation by hybridization.
Similarly, microarray results show that PLB4, encoding a phospholipase, was upregulated in both colonizing and invading cells, and PLB1, PLB2, PLB3, and PLB5 were not upregulated in either. Therefore, contrary to expectations, lytic enzymes did not show a clear invasion-specific pattern of expression.
Hypha-coregulated genes have also been proposed to promote virulence (28, 31). However, these genes are upregulated in both commensal cells colonizing the intestine and in cells undergoing tissue invasion. Thus, these genes also fail to show an invasion-specific pattern of gene expression.
On the other hand, DEF1 (EED1), identified by Zakikhany et al. as a factor that promotes invasive growth within host epithelium (67), was upregulated during invasion but not in cells colonizing the cecum. DFG16, encoding a putative pH sensor (5) that is both upregulated during invasion and required for tissue invasion (60), showed a similar invasion-specific pattern of expression. These results support the previous conclusions that DEF1 and DFG16 play important roles in events that promote disease.
In summary, there are common and distinct features of cells invading tissue and cells colonizing the cecum in the commensal state. Common genes may be important for adaptation to the host environment. Genes specific for colonization or invasion may have roles that are specific to each situation. These genes may provide genetic signatures of invading cells and could have important roles in invasive candidiasis. The results of our studies show that it has been difficult to predict invasion-specific genes based only on laboratory studies.
Role of Cph2p and Tec1p in intestinal colonization and regulation of gene expression.
Hypha-coregulated genes were upregulated in cells colonizing the intestinal tract. In the laboratory, expression of these genes is dependent on transcription factor Efg1p (8, 51) but during growth in the intestinal tract, these genes do not require Efg1p for expression (66). Therefore, an alternative pathway is responsible for expression of these genes during growth in the intestinal tract.
To identify the transcription factor that upregulates the hypha-coregulated genes, the expression of transcription factors and signaling proteins that regulate hyphal growth was studied. CPH2 (1.7-fold upregulated, P < 0.04) encoding a transcription factor (30) was observed to be upregulated during growth in the cecum and not growth phase regulated. TEC1, encoding another transcription factor (30, 49), showed a trend toward upregulation (1.7-fold, P = 0.055). Cph2p is required for hyphal development during laboratory growth in a particular hypha-inducing medium, Lee's medium and for expression of hypha-coregulated genes under these conditions (29, 30). Cph2p also regulates the expression of TEC1 by binding to two adjacent sterol response elements (SRE-1) located in the TEC1 promoter (30). Tec1p is required for hyphal growth and expression of hyphal genes under certain lab conditions (29, 30, 49).
To search for other potential targets for Cph2p, an in silico search for double SRE-1-containing promoters was conducted. A single gene, orf19.4450.1, was found to have two adjacent upstream SRE-1 elements, from −482 to −463. Interestingly, this gene was one of the most highly upregulated genes in cecum-grown cells, showing 17-fold upregulation relative to laboratory grown post-exponential-phase cells (P < 0.002). Quantitative RT-PCR results confirmed the upregulation of this gene in cells recovered from the cecum relative to exponential-phase cells (Fig. 3). orf19.4450.1 encodes a predicted 68-amino-acid polypeptide of unknown function that is conserved among the “CTG-clade” of fungi, which translate the CTG codon as a serine.
Fig. 3.
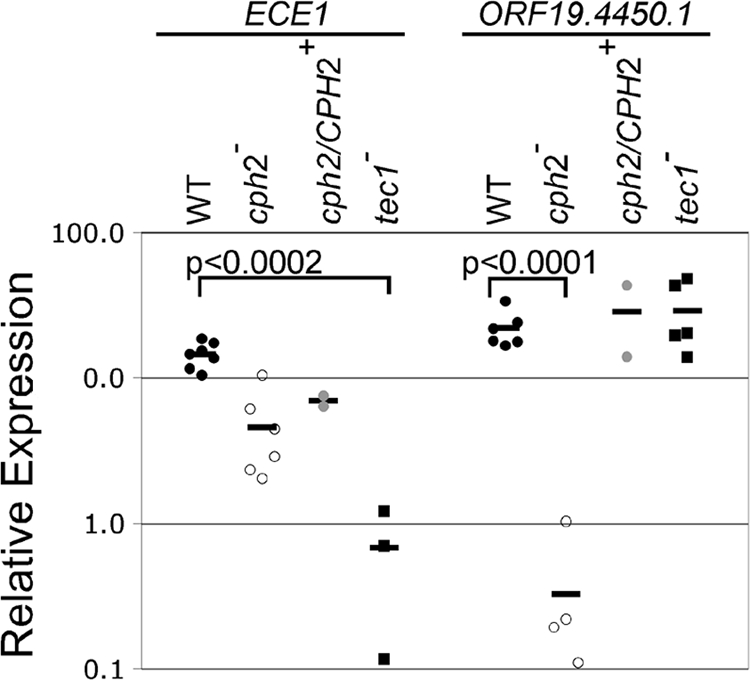
Gene expression in C. albicans cells lacking Cph2p or Tec1p. RNA was prepared from C. albicans cells grown in the murine cecum. Expression of the genes indicated at top of graph was measured by quantitative real time RT-PCR and normalized using the expression of ACT1. Expression is shown relative to expression in WT laboratory-grown exponential-phase cells. Each symbol represents the average of triplicate measurements from a different RNA sample. Strains were as follows: black circles, WT; open circles, cph2-null mutant; gray circles, cph2/CPH2+ reconstituted mutant; black squares, tec1-null mutant. Black bar indicates mean.
Tec1p, in turn, has been shown to recognize CATTCY sequences (30). These motifs are disproportionately present in the promoter regions of several hypha-coregulated genes, such as HWP1, ECE1, and ALS3.
These observations suggested that Cph2p or Tec1p or both might be important for regulation of gene expression during growth within the host intestinal tract. To determine whether gene expression was altered by the absence of either Cph2p or Tec1p, C. albicans WT, cph2-null mutant, a cph2/CPH2 reconstituted strain, and tec1UAU mutant cells were inoculated into mice and harvested from the cecum. RNA was prepared from these cells as described in Materials and Methods, and expression of genes in cDNA prepared from the RNA was determined by quantitative RT-PCR, and normalized using the expression of ACT1. Expression of orf19.4450.1, and ECE1 was strongly upregulated in cells recovered from the cecum relative to exponential-phase growth in laboratory conditions, confirming the results from the microarrays (Fig. 3). In the cph2-null mutant, the mean value for expression of orf19.4450.1 was 70-fold lower than the value for WT cells (Fig. 3; P < 0.0001 [Student t test]); expression was similar to WT in the CPH2+ reconstituted strain (Fig. 3). Therefore, as predicted from the presence of SRE elements, orf19.4450.1 was dependent on Cph2p for upregulation during growth in the cecum.
ECE1 was upregulated in the cph2 null mutant but its mean expression was 20-fold lower in the strain lacking Tec1p compared to the WT strain (Fig. 3; P < 0.0002 [Student t test]), a finding consistent with the presence of CATTY sequences in its promoter region (30). These results demonstrate that both Cph2p and Tec1p are required for normal patterns of gene expression in C. albicans cells growing in the cecum.
To determine whether Cph2p or Tec1p or both were important for the colonization of the intestinal tract, colonization by strains lacking Cph2p due to either a homozygous deletion mutation or a homozygous UAU insertion mutation (16), or a strain lacking Tec1p due to a homozygous UAU insertion mutation (16) were tested for their ability to colonize mice after oral inoculation. WT, cph2UAU, cph2-null, cph2/CPH2 reconstituted, and tec1UAU mutant cells were inoculated by gavage into antibiotic-treated Swiss Webster mice as described in Materials and Methods. Fecal pellets were collected from mice on various days and analyzed for C. albicans CFU per g of fecal pellet. The results showed that the cph2-null strains colonized at lower levels than WT or CPH2 reconstituted C. albicans (Fig. 4A).
Fig. 4.
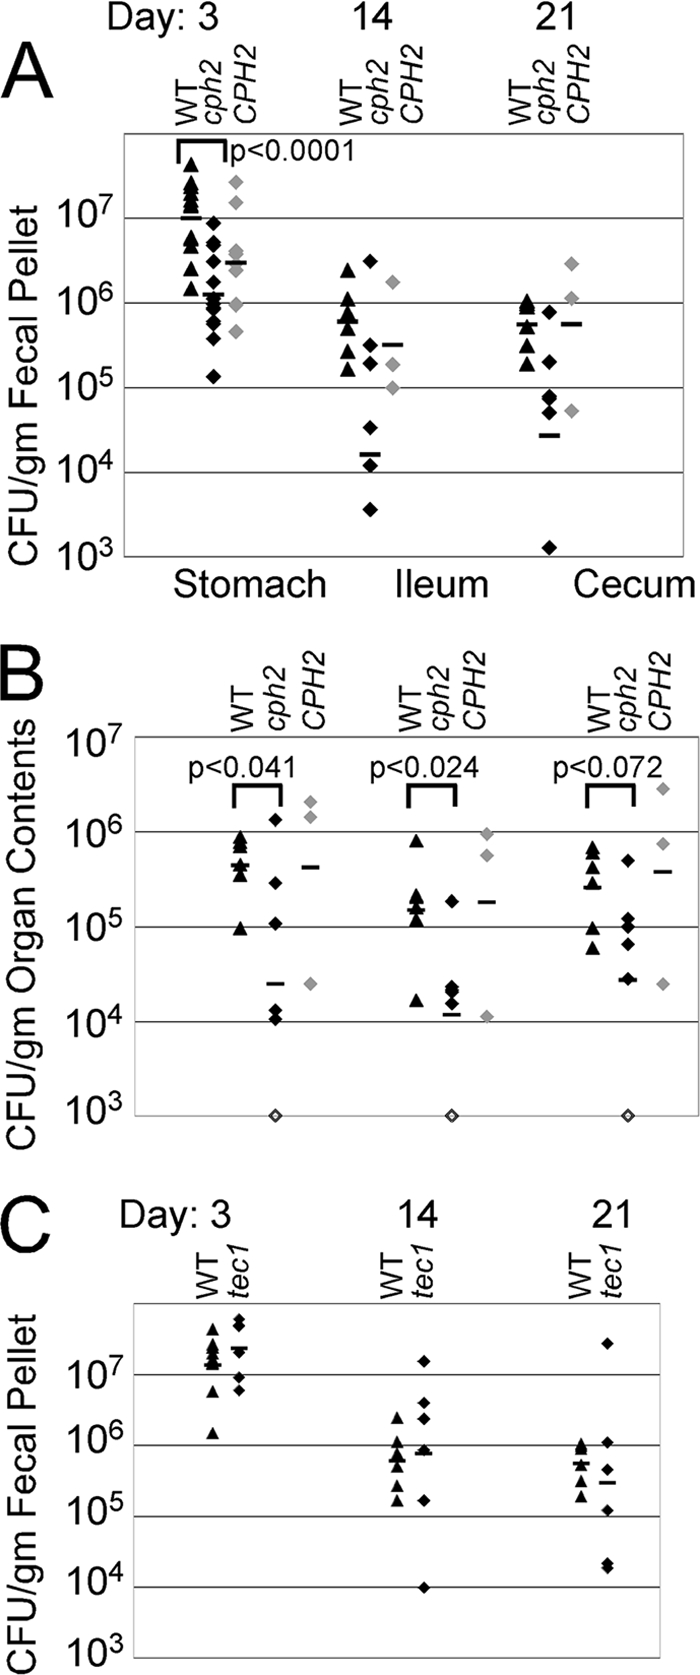
Lack of Cph2p alters murine intestinal colonization. WT (DAY185 or SN100), cph2 deletion mutant, cph2UAU mutant, CPH2 reconstituted null mutant, or tec1UAU mutant were orally inoculated by gavage into Swiss Webster mice. At various days postinoculation, the amounts of C. albicans in fecal pellets were measured. The amounts of C. albicans in organs of the intestinal tract were measured after sacrifice. (A) CFU per gram of fecal pellet. Mice were sampled repeatedly, and each symbol represents a sample from a different mouse. Black triangles, WT C. albicans; black diamonds, cph2 mutant strain; gray diamonds, CPH2 reconstituted strain; bars, geometric means. (B) CFU per gram of organ or organ contents from mice sacrificed on day 21 postinoculation. Each symbol represents a sample from a different mouse. For the stomach and cecum, the colonization in the contents is shown. For the ileum, the contents plus wall were homogenized. Organs are indicated at the top of the graph. Black triangles, WT C. albicans; black diamonds, cph2 mutant strain; open diamonds indicate CFU/g below the limit of detection; gray diamonds, CPH2 reconstituted strain; bars, geometric means. (C) CFU per gram of fecal pellet. Mice were sampled repeatedly, and each symbol represents a sample from a different mouse. Black triangles, WT C. albicans; black diamonds, tec1UAU mutant strain; bars, geometric means.
Colonization in the stomach, ileum, and cecum was measured after sacrificing the mice at day 21 postinoculation (Fig. 4B). Mutants lacking Cph2p showed reduced colonization in the stomach (P < 0.041) and the ileum (P < 0.024) and showed a trend toward lower colonization in the cecum (P < 0.072) relative to the WT strain. The CPH2+ reconstituted mutant showed higher colonization than the null mutant. In contrast, colonization by the tec1UAU mutant was not attenuated relative to the WT strain (Fig. 4C). These results showed that Cph2p is required for establishment of normal levels of intestinal tract colonization. Thus, Cph2p is an important regulator of gene expression during colonization of the intestinal tract.
DISCUSSION
In mice, C. albicans cells are capable of colonizing the intestinal tract for many days without causing disease. Gene expression in such colonizing cells showed distinct features that distinguished the pattern of expression from that of cells growing in the laboratory. The majority of growth-phase-regulated genes were expressed at levels characteristic of post-exponential-phase cells. These findings and the fact that numerous bacterial virulence factors are post-exponential-phase genes (e.g., virulence factors of Bacillus anthracis [47], Staphylococcus aureus [45], Helicobacter pylori [61], Legionella pneumophila [38], or Salmonella [20]) show that expression of post-exponential-phase genes is a common feature of microbes that are colonizing a host. Relatively high expression of post-exponential-phase genes such as stress response genes or genes encoding transporters gives cells the characteristics of post-exponential phase such as enhanced stress resistance and the ability to grow in suboptimal nutritional conditions.
In addition to genes characteristic of post-exponential phase, colonizing C. albicans cells express genes characteristic of exponential phase (Fig. 1, Table 1). These findings could be explained by the existence of multiple subpopulations of cells in different physiological states. Indeed, evidence of heterogeneity in cells recovered from a host has been observed. Barelle et al. observed that GFP reporter gene fluorescence was not uniform in cells recovered from the kidneys of animals after intravenous inoculation (4). Heterogeneity in the number of cells that expressed a recombinase reporter gene has been observed (56). In the intestinal tract, differences in cellular morphology among colonizing cells were noted previously (26, 66).
Despite these observations, heterogeneity does not entirely explain the pattern of gene expression exhibited by C. albicans cells colonizing the intestinal tract. For example, expression of the exponential-phase genes encoding glycolytic enzymes was, in most cases, higher than their expression in laboratory-grown exponential-phase cells (Fig. 1, Table 1). Therefore, either a majority of cells express these genes or a minority of cells express them at very high levels. The exponential-phase genes encoding tRNA synthetases were expressed at relatively low levels and the exponential-phase genes encoding ribosomal proteins were expressed at intermediate levels. These observations cannot be accounted for by assuming that colonizing cells are a mixture of cells equivalent to laboratory-grown exponential-phase and post-exponential-phase cells. Therefore, we conclude that cells colonizing the intestinal tract exhibited a physiological state that is distinct from that of laboratory-grown cells.
In addition, colonizing cells expressed post-exponential-phase, stress response genes at relatively high, post-exponential-phase levels. Again, either the majority of cells express these genes or a minority of cells express them at high levels. Since the majority of cells probably also express relatively high levels of genes encoding glycolytic enzymes, we favor the model that some individual cells express both glycolytic enzymes and stress response genes. Thus, the physiological state of some cells colonizing a host may combine the ability to grow rapidly with the ability to resist stresses producing a distinct physiological state adapted for host colonization.
When the host becomes immunocompromised, initiation of invasive candidiasis can occur. The analysis described here showed that invading, disease-producing cells have many similarities to colonizing cells. For example, in both situations, the glycolysis pathway, the glyoxylate cycle, and PCK1, encoding phosphoenolpyruvate carboxykinase, are relatively highly expressed. Commensal colonizers and invaders also showed similarity in expression of a collection of genes encoding cell surface proteins. In the laboratory, expression of this group of genes is not observed unless the cells are induced to form hyphae (19, 25, 29, 39, 53). This observation has led to the hypothesis that hypha-coregulated genes function to promote virulence (28, 31). The fact that these genes encode adhesins, proteases, and other activities that might promote virulence appears to support this model. However, these and other results show that in the host, expression of the hypha-coregulated genes is not strictly tied to either cellular morphology (57, 66) or virulent invasiveness. Therefore, it is more likely that the cell surface defined by the hyphal regulon represents a cell surface that allows optimal interaction with the host. Thus, this surface would promote both commensal colonization in a healthy host and invasion of tissue in a compromised host. Consistent with this model, some of the proteins expressed in the hyphal regulon, such as Ece1p, are required for normal colonization of the intestinal tract (66).
There are also numerous differences in gene expression between colonizing C. albicans cells and invading cells. Although genes expressed by both commensal cells and invading cells probably represent adaptations for growth in the host environment, genes expressed in invading cells but not in commensals could represent activities that have specific roles in invasion. Examples of the latter type of genes include DFG16 and DEF1 (EED1).
DFG16, encoding a transmembrane protein that may function as a pH receptor, was found to be expressed by an invasive strain of C. albicans during invasion of the liver but not by a noninvasive strain growing under the same conditions (60). Mutants lacking Dfg16p are attenuated in the ability to cause lethal infection after intravenous inoculation of mice (60). The observation that DFG16 is not upregulated in cells colonizing the intestinal tract further supports the conclusion of an association between DFG16 expression, invasiveness and disease.
DEF1 (EED1), encoding a protein similar to an RNA polymerase II regulatory factor, was upregulated during oral thrush (67) but not during colonization of the cecum. Mutants lacking Def1p, although able to invade mammalian cells within a cultured, reconstituted tissue were unable to escape from these host cells and disseminate throughout the reconstituted tissue (67).
Neither DFG16 nor DEF1 (EED1) was reported to be upregulated during infection of the rabbit kidney (65). However, at least in the case of DEF1 (EED1), this finding may reflect the use of cells grown under conditions that promoted filamentation for the reference sample.
Thus, both Def1p and Dfg16p have invasion/disease-associated functions (60, 67). The many uncharacterized genes that are upregulated during tissue invasion but not during colonization of the intestinal tract may have as-yet-undescribed functions in tissue invasion. Since there are numerous such genes, there are many potential novel invasion factors that could be used as targets for antifungal therapy. In addition, the products of these genes could be particularly attractive as targets for vaccine development or for use in diagnostic methodologies.
Genes encoding mitochondrial electron transport chain subunits (COX genes, encoding cytochrome c oxidase subunits and QCR genes, encoding ubiquinol cytochrome c reductase subunits) were upregulated in C. albicans cells growing in the cecum. During laboratory growth, the expression of most of the COX and QCR genes was unaffected by the growth phase. Upregulation of these genes in response to hypoxia (50) or other laboratory conditions was also not observed. These results contrast with the situation in S. cerevisiae, where expression of these genes is catabolite repressed in the presence of glucose (59) and, therefore, expression shows growth phase regulation in glucose-containing medium (12).
Since the cecum is an environment with very low O2, upregulation of these genes was unexpected. One possible explanation for these findings is that under hypoxic conditions, cytochrome c oxidase has another function in addition to its role in respiration. For example, S. cerevisiae cytochrome c oxidase can generate NO from NO2− in the absence of oxygen (9). C. albicans cytochrome oxidase could have a similar activity. It is also possible that the cecum contains microenvironments where oxygen levels are higher.
The transcription factor Cph2p is upregulated during colonization of the cecum and is important for normal colonization. In contrast, Tec1p, a transcription factor whose expression is regulated by Cph2p (30), is dispensable for colonization. Although cells lacking Tec1p colonize the intestinal tract normally, during growth in the cecum, Tec1p is required for upregulation of Ece1p, a factor that influences adherence (41) although, using the recombinase reporter gene, Staib et al. observed Tec1p-independent expression of SAP5 during murine infection (55).
Since previous results showed that Ece1p is important for intestinal colonization by C. albicans (66), the basal level of expression of Ece1p that occurs in the absence of Tec1p is sufficient for normal colonization. In addition, the basal level of Tec1p produced in the absence of Cph2p is sufficient for the expression of Ece1p. These results demonstrate that Cph2p and Tec1p regulate the expression of activities that promote intestinal colonization by C. albicans.
It is noteworthy that C. albicans strains vary considerably in their ability to colonize mucosal sites (44, 58). The gene expression pattern exhibited by strains with enhanced ability to colonize may differ in interesting ways from the pattern of gene expression observed in this study. Also, the use of antibiotics to create niches for C. albicans colonization and the subsequent alteration in bacterial flora would be expected to impact the C. albicans gene expression profile. These factors suggest that additional studies of different strains and conditions would reveal further features of C. albicans adaptation to the host environment.
In conclusion, adaptation to growth in the host involves expression of genes required for active growth, as well as genes such as stress response genes and transporter-encoding genes that are expressed in laboratory-defined post-exponential phase. A particular cell surface that allows optimal interaction with the host is produced during colonization and the Cph2p/Tec1p pathway controls expression of some cecum-upregulated genes. During growth within the intestinal tract, the organism senses pH, oxygen, carbon sources, and the presence of surfaces allowing it to optimize gene expression for a particular environment. With these mechanisms for sensing, C. albicans is able to efficiently colonize humans in infancy, establishing itself in its most important natural niche.
Supplementary Material
ACKNOWLEDGMENTS
We thank Jose Bachier, Jin Packard, and Stephanie Tornberg for experimental assistance and Arturo Casadevall, Eric Rubin, Joan Mecsas, Henry Wortis, Sasha Poltorak, Linc Sonenshein, and members of the Kumamoto lab for helpful discussions. We are grateful to Haoping Liu and Aaron Mitchell for kindly providing the mutants used here.
This study was supported in part by grant R21 AI076156 from the National Institute of Allergy and Infectious Diseases (to C.A.K.). A.R. was supported by training grant T32 AI55407, and J.V.P. was supported by training grant T32 AI07422 from the National Institutes of Health.
This is NRC publication 50699.
Footnotes
Supplemental material for this article may be found at http://ec.asm.org/.
Published ahead of print on 30 April 2010.
REFERENCES
- 1.Aragon A. D., Quinones G. A., Thomas E. V., Roy S., Werner-Washburne M. 2006. Release of extraction-resistant mRNA in stationary phase Saccharomyces cerevisiae produces a massive increase in transcript abundance in response to stress. Genome Biol. 7:R9. [DOI] [PMC free article] [PubMed] [Google Scholar]
- 2.Ashburner M., Ball C. A., Blake J. A., Botstein D., Butler H., Cherry J. M., Davis A. P., Dolinski K., Dwight S. S., Eppig J. T., Harris M. A., Hill D. P., Issel-Tarver L., Kasarskis A., Lewis S., Matese J. C., Richardson J. E., Ringwald M., Rubin G. M., Sherlock G. 2000. Gene ontology: tool for the unification of biology. Gene Ontol. Consort. Nat. Genet. 25:25–29 [DOI] [PMC free article] [PubMed] [Google Scholar]
- 3.Askew C., Sellam A., Epp E., Hogues H., Mullick A., Nantel A., Whiteway M. 2009. Transcriptional regulation of carbohydrate metabolism in the human pathogen Candida albicans. PLoS Pathog. 5:e1000612. [DOI] [PMC free article] [PubMed] [Google Scholar]
- 4.Barelle C. J., Priest C. L., Maccallum D. M., Gow N. A., Odds F. C., Brown A. J. 2006. Niche-specific regulation of central metabolic pathways in a fungal pathogen. Cell. Microbiol. 8:961–971 [DOI] [PMC free article] [PubMed] [Google Scholar]
- 5.Barwell K. J., Boysen J. H., Xu W., Mitchell A. P. 2005. Relationship of DFG16 to the Rim101p pH response pathway in Saccharomyces cerevisiae and Candida albicans. Eukaryot. Cell 4:890–899 [DOI] [PMC free article] [PubMed] [Google Scholar]
- 6.Bensen E. S., Martin S. J., Li M., Berman J., Davis D. A. 2004. Transcriptional profiling in Candida albicans reveals new adaptive responses to extracellular pH and functions for Rim101p. Mol. Microbiol. 54:1335–1351 [DOI] [PubMed] [Google Scholar]
- 7.Birse C. E., Irwin M. Y., Fonzi W. A., Sypherd P. S. 1993. Cloning and characterization of ECE1, a gene expressed in association with cell elongation of the dimorphic pathogen Candida albicans. Infect. Immun. 61:3648–3655 [DOI] [PMC free article] [PubMed] [Google Scholar]
- 8.Braun B. R., Johnson A. D. 2000. TUP1, CPH1 and EFG1 make independent contributions to filamentation in Candida albicans. Genetics 155:57–67 [DOI] [PMC free article] [PubMed] [Google Scholar]
- 9.Castello P. R., David P. S., McClure T., Crook Z., Poyton R. O. 2006. Mitochondrial cytochrome oxidase produces nitric oxide under hypoxic conditions: implications for oxygen sensing and hypoxic signaling in eukaryotes. Cell Metab. 3:277–287 [DOI] [PubMed] [Google Scholar]
- 10.Davis D., Edwards J. E., Jr., Mitchell A. P., Ibrahim A. S. 2000. Candida albicans RIM101 pH response pathway is required for host-pathogen interactions. Infect. Immun. 68:5953–5959 [DOI] [PMC free article] [PubMed] [Google Scholar]
- 11.Del Sero G., Mencacci A., Cenci E., d'Ostiani C. F., Montagnoli C., Bacci A., Mosci P., Kopf M., Romani L. 1999. Antifungal type 1 responses are upregulated in IL-10-deficient mice. Microbes Infect. 1:1169–1180 [DOI] [PubMed] [Google Scholar]
- 12.DeRisi J. L., Iyer V. R., Brown P. O. 1997. Exploring the metabolic and genetic control of gene expression on a genomic scale. Science 278:680–686 [DOI] [PubMed] [Google Scholar]
- 13.Dignard D., Whiteway M. 2006. SST2, a regulator of G-protein signaling for the Candida albicans mating response pathway. Eukaryot. Cell 5:192–202 [DOI] [PMC free article] [PubMed] [Google Scholar]
- 14.Elliott B., Futcher B. 1993. Stress resistance of yeast cells is largely independent of cell cycle phase. Yeast 9:33–42 [DOI] [PubMed] [Google Scholar]
- 15.Enjalbert B., Nantel A., Whiteway M. 2003. Stress-induced gene expression in Candida albicans: absence of a general stress response. Mol. Biol. Cell 14:1460–1467 [DOI] [PMC free article] [PubMed] [Google Scholar]
- 16.Enloe B., Diamond A., Mitchell A. P. 2000. A single-transformation gene function test in diploid Candida albicans. J. Bacteriol. 182:5730–5736 [DOI] [PMC free article] [PubMed] [Google Scholar]
- 17.Fonzi W. A., Irwin M. Y. 1993. Isogenic strain construction and gene mapping in Candida albicans. Genetics 134:717–728 [DOI] [PMC free article] [PubMed] [Google Scholar]
- 18.Gale C. A., Bendel C. M., McClellan M., Hauser M., Becker J. M., Berman J., Hostetter M. K. 1998. Linkage of adhesion, filamentous growth, and virulence in Candida albicans to a single gene, INT1. Science 279:1355–1358 [DOI] [PubMed] [Google Scholar]
- 19.Goyard S., Knechtle P., Chauvel M., Mallet A., Prevost M. C., Proux C., Coppee J. Y., Schwartz P., Dromer F., Park H., Filler S. G., Janbon G., d'Enfert C. 2008. The Yak1 kinase is involved in the initiation and maintenance of hyphal growth in Candida albicans. Mol. Biol. Cell 19:2251–2266 [DOI] [PMC free article] [PubMed] [Google Scholar]
- 20.Guiney D. G., Libby S., Fang F. C., Krause M., Fierer J. 1995. Growth-phase regulation of plasmid virulence genes in Salmonella. Trends Microbiol. 3:275–279 [DOI] [PubMed] [Google Scholar]
- 21.He G., Shankar R. A., Chzhan M., Samouilov A., Kuppusamy P., Zweier J. L. 1999. Noninvasive measurement of anatomic structure and intraluminal oxygenation in the gastrointestinal tract of living mice with spatial and spectral EPR imaging. Proc. Natl. Acad. Sci. U. S. A. 96:4586–4591 [DOI] [PMC free article] [PubMed] [Google Scholar]
- 22.Helstrom P. B., Balish E. 1979. Effect of oral tetracycline, the microbial flora, and the athymic state on gastrointestinal colonization and infection of BALB/c mice with Candida albicans. Infect. Immun. 23:764–774 [DOI] [PMC free article] [PubMed] [Google Scholar]
- 23.Hromatka B. S., Noble S. M., Johnson A. D. 2005. Transcriptional response of Candida albicans to nitric oxide and the role of the YHB1 gene in nitrosative stress and virulence. Mol. Biol. Cell 16:4814–4826 [DOI] [PMC free article] [PubMed] [Google Scholar]
- 24.Ihmels J., Bergmann S., Gerami-Nejad M., Yanai I., McClellan M., Berman J., Barkai N. 2005. Rewiring of the yeast transcriptional network through the evolution of motif usage. Science 309:938–940 [DOI] [PubMed] [Google Scholar]
- 25.Kadosh D., Johnson A. D. 2005. Induction of the Candida albicans filamentous growth program by relief of transcriptional repression: a genome-wide analysis. Mol. Biol. Cell 16:2903–2912 [DOI] [PMC free article] [PubMed] [Google Scholar]
- 26.Kinneberg K. M., Bendel C. M., Jechorek R. P., Cebelinski E. A., Gale C. A., Berman J. G., Erlandsen S. L., Hostetter M. K., Wells C. L. 1999. Effect of INT1 gene on Candida albicans murine intestinal colonization. J. Surg. Res. 87:245–251 [DOI] [PubMed] [Google Scholar]
- 27.Kretschmar M., Felk A., Staib P., Schaller M., Hess D., Callapina M., Morschhauser J., Schafer W., Korting H. C., Hof H., Hube B., Nichterlein T. 2002. Individual acid aspartic proteinases (Saps) 1-6 of Candida albicans are not essential for invasion and colonization of the gastrointestinal tract in mice. Microb. Pathog. 32:61–70 [DOI] [PubMed] [Google Scholar]
- 28.Kumamoto C. A., Vinces M. D. 2005. Contributions of hyphae and hypha-co-regulated genes to Candida albicans virulence. Cell. Microbiol. 7:1546–1554 [DOI] [PubMed] [Google Scholar]
- 29.Lane S., Birse C., Zhou S., Matson R., Liu H. 2001. DNA array studies demonstrate convergent regulation of virulence factors by Cph1, Cph2, and Efg1 in Candida albicans. J. Biol. Chem. 276:48988–48996 [DOI] [PubMed] [Google Scholar]
- 30.Lane S., Zhou S., Pan T., Dai Q., Liu H. 2001. The basic helix-loop-helix transcription factor Cph2 regulates hyphal development in Candida albicans partly via TEC1. Mol. Cell. Biol. 21:6418–6428 [DOI] [PMC free article] [PubMed] [Google Scholar]
- 31.Liu H. 2002. Co-regulation of pathogenesis with dimorphism and phenotypic switching in Candida albicans, a commensal and a pathogen. Int. J. Med. Microbiol. 292:299–311 [DOI] [PubMed] [Google Scholar]
- 32.Liu L., Zeng M., Hausladen A., Heitman J., Stamler J. S. 2000. Protection from nitrosative stress by yeast flavohemoglobin. Proc. Natl. Acad. Sci. U. S. A. 97:4672–4676 [DOI] [PMC free article] [PubMed] [Google Scholar]
- 33.Lorenz M. C., Bender J. A., Fink G. R. 2004. Transcriptional response of Candida albicans upon internalization by macrophages. Eukaryot. Cell 3:1076–1087 [DOI] [PMC free article] [PubMed] [Google Scholar]
- 34.Magana M. M., Osborne T. F. 1996. Two tandem binding sites for sterol regulatory element binding proteins are required for sterol regulation of fatty-acid synthase promoter. J. Biol. Chem. 271:32689–32694 [DOI] [PubMed] [Google Scholar]
- 35.Martchenko M., Alarco A. M., Harcus D., Whiteway M. 2004. Superoxide dismutases in Candida albicans: transcriptional regulation and functional characterization of the hyphal-induced SOD5 gene. Mol. Biol. Cell 15:456–467 [DOI] [PMC free article] [PubMed] [Google Scholar]
- 36.Martchenko M., Levitin A., Hogues H., Nantel A., Whiteway M. 2007. Transcriptional rewiring of fungal galactose-metabolism circuitry. Curr. Biol. 17:1007–1013 [DOI] [PMC free article] [PubMed] [Google Scholar]
- 37.McAllan A. B. 1981. Changes in the composition of digesta during passage through the small intestines of steers. Br. J. Nutr. 46:431–440 [DOI] [PubMed] [Google Scholar]
- 38.Molofsky A. B., Swanson M. S. 2004. Differentiate to thrive: lessons from the Legionella pneumophila life cycle. Mol. Microbiol. 53:29–40 [DOI] [PubMed] [Google Scholar]
- 39.Nantel A., Dignard D., Bachewich C., Harcus D., Marcil A., Bouin A. P., Sensen C. W., Hogues H., van het Hoog M., Gordon P., Rigby T., Benoit F., Tessier D. C., Thomas D. Y., Whiteway M. 2002. Transcription profiling of Candida albicans cells undergoing the yeast-to-hyphal transition. Mol. Biol. Cell 13:3452–3465 [DOI] [PMC free article] [PubMed] [Google Scholar]
- 40.Nett J. E., Lepak A. J., Marchillo K., Andes D. R. 2009. Time course global gene expression analysis of an in vivo Candida biofilm. J. Infect. Dis. 200:307–313 [DOI] [PMC free article] [PubMed] [Google Scholar]
- 41.Nobile C. J., Mitchell A. P. 2005. Regulation of cell-surface genes and biofilm formation by the Candida albicans transcription factor Bcr1p. Curr. Biol. 15:1150–1155 [DOI] [PubMed] [Google Scholar]
- 42.Noble S. M., Johnson A. D. 2005. Strains and strategies for large-scale gene deletion studies of the diploid human fungal pathogen Candida albicans. Eukaryot. Cell 4:298–309 [DOI] [PMC free article] [PubMed] [Google Scholar]
- 43.Odds F. C. 1987. Candida infections: an overview. Crit. Rev. Microbiol. 15:1–5 [DOI] [PubMed] [Google Scholar]
- 44.Rahman D., Mistry M., Thavaraj S., Challacombe S. J., Naglik J. R. 2007. Murine model of concurrent oral and vaginal Candida albicans colonization to study epithelial host-pathogen interactions. Microbes Infect. 9:615–622 [DOI] [PMC free article] [PubMed] [Google Scholar]
- 45.Recsei P., Kreiswirth B., O'Reilly M., Schlievert P., Gruss A., Novick R. P. 1986. Regulation of exoprotein gene expression in Staphylococcus aureus by agr. Mol. Gen. Genet. 202:58–61 [DOI] [PubMed] [Google Scholar]
- 46.Russell C., Lay K. M. 1973. Natural history of Candida species and yeasts in the oral cavities of infants. Arch. Oral Biol. 18:957–962 [DOI] [PubMed] [Google Scholar]
- 47.Saile E., Koehler T. M. 2002. Control of anthrax toxin gene expression by the transition state regulator abrB. J. Bacteriol. 184:370–380 [DOI] [PMC free article] [PubMed] [Google Scholar]
- 48.Schaller M., Borelli C., Korting H. C., Hube B. 2005. Hydrolytic enzymes as virulence factors of Candida albicans. Mycoses 48:365–377 [DOI] [PubMed] [Google Scholar]
- 49.Schweizer A., Rupp S., Taylor B. N., Rollinghoff M., Schroppel K. 2000. The TEA/ATTS transcription factor CaTec1p regulates hyphal development and virulence in Candida albicans. Mol. Microbiol. 38:435–445 [DOI] [PubMed] [Google Scholar]
- 50.Setiadi E. R., Doedt T., Cottier F., Noffz C., Ernst J. F. 2006. Transcriptional response of Candida albicans to hypoxia: linkage of oxygen sensing and Efg1p-regulatory networks. J. Mol. Biol. 361:399–411 [DOI] [PubMed] [Google Scholar]
- 51.Sharkey L. L., McNemar M. D., Saporito-Irwin S. M., Sypherd P. S., Fonzi W. A. 1999. HWP1 functions in the morphological development of Candida albicans downstream of EFG1, TUP1, and RBF1. J. Bacteriol. 181:5273–5279 [DOI] [PMC free article] [PubMed] [Google Scholar]
- 52.Sherman F. 1991. Getting started with yeast. Academic Press, Inc., San Diego, CA [Google Scholar]
- 53.Sohn K., Urban C., Brunner H., Rupp S. 2003. EFG1 is a major regulator of cell wall dynamics in Candida albicans as revealed by DNA microarrays. Mol. Microbiol. 47:89–102 [DOI] [PubMed] [Google Scholar]
- 54.Soll D. R., Galask R., Schmid J., Hanna C., Mac K., Morrow B. 1991. Genetic dissimilarity of commensal strains of Candida spp. carried in different anatomical locations of the same healthy women. J. Clin. Microbiol 29:1702–1710 [DOI] [PMC free article] [PubMed] [Google Scholar]
- 55.Staib P., Binder A., Kretschmar M., Nichterlein T., Schroppel K., Morschhauser J. 2004. Tec1p-independent activation of a hypha-associated Candida albicans virulence gene during infection. Infect. Immun. 72:2386–2389 [DOI] [PMC free article] [PubMed] [Google Scholar]
- 56.Staib P., Kretschmar M., Nichterlein T., Hof H., Morschhauser J. 2000. Differential activation of a Candida albicans virulence gene family during infection. Proc. Natl. Acad. Sci. U. S. A. 97:6102–6107 [DOI] [PMC free article] [PubMed] [Google Scholar]
- 57.Staib P., Kretschmar M., Nichterlein T., Hof H., Morschhauser J. 2002. Transcriptional regulators Cph1p and Efg1p mediate activation of the Candida albicans virulence gene SAP5 during infection. Infect. Immun. 70:921–927 [DOI] [PMC free article] [PubMed] [Google Scholar]
- 58.Taylor B. N., Fichtenbaum C., Saavedra M., Slavinsky I. J., Swoboda R., Wozniak K., Arribas A., Powderly W., Fidel P. L., Jr 2000. In vivo virulence of Candida albicans isolates causing mucosal infections in people infected with the human immunodeficiency virus. J. Infect. Dis. 182:955–959 [DOI] [PubMed] [Google Scholar]
- 59.ter Linde J. J., Liang H., Davis R. W., Steensma H. Y., van Dijken J. P., Pronk J. T. 1999. Genome-wide transcriptional analysis of aerobic and anaerobic chemostat cultures of Saccharomyces cerevisiae. J. Bacteriol. 181:7409–7413 [DOI] [PMC free article] [PubMed] [Google Scholar]
- 60.Thewes S., Kretschmar M., Park H., Schaller M., Filler S. G., Hube B. 2007. In vivo and ex vivo comparative transcriptional profiling of invasive and non-invasive Candida albicans isolates identifies genes associated with tissue invasion. Mol. Microbiol. 63:1606–1628 [DOI] [PubMed] [Google Scholar]
- 61.Thompson L. J., Merrell D. S., Neilan B. A., Mitchell H., Lee A., Falkow S. 2003. Gene expression profiling of Helicobacter pylori reveals a growth-phase-dependent switch in virulence gene expression. Infect. Immun. 71:2643–2655 [DOI] [PMC free article] [PubMed] [Google Scholar]
- 62.Tournu H., Tripathi G., Bertram G., Macaskill S., Mavor A., Walker L., Odds F. C., Gow N. A., Brown A. J. 2005. Global role of the protein kinase Gcn2 in the human pathogen Candida albicans. Eukaryot. Cell 4:1687–1696 [DOI] [PMC free article] [PubMed] [Google Scholar]
- 63.Uppuluri P., Chaffin W. L. 2007. Defining Candida albicans stationary phase by cellular and DNA replication, gene expression and regulation. Mol. Microbiol. 64:1572–1586 [DOI] [PubMed] [Google Scholar]
- 64.van het Hoog M., Rast T. J., Martchenko M., Grindle S., Dignard D., Hogues H., Cuomo C., Berriman M., Scherer S., Magee B. B., Whiteway M., Chibana H., Nantel A., Magee P. T. 2007. Assembly of the Candida albicans genome into sixteen supercontigs aligned on the eight chromosomes. Genome Biol. 8:R52. [DOI] [PMC free article] [PubMed] [Google Scholar]
- 65.Walker L. A., Maccallum D. M., Bertram G., Gow N. A., Odds F. C., Brown A. J. 2009. Genome-wide analysis of Candida albicans gene expression patterns during infection of the mammalian kidney. Fungal Genet. Biol. 46:210–219 [DOI] [PMC free article] [PubMed] [Google Scholar]
- 66.White S. J., Rosenbach A., Lephart P., Nguyen D., Benjamin A., Tzipori S., Whiteway M., Mecsas J., Kumamoto C. A. 2007. Self-regulation of Candida albicans population size during GI colonization. PLoS Pathog. 3:e184. [DOI] [PMC free article] [PubMed] [Google Scholar]
- 67.Zakikhany K., Naglik J. R., Schmidt-Westhausen A., Holland G., Schaller M., Hube B. 2007. In vivo transcript profiling of Candida albicans identifies a gene essential for interepithelial dissemination. Cell. Microbiol. 9:2938–2954 [DOI] [PubMed] [Google Scholar]
- 68.Zelante T., De Luca A., Bonifazi P., Montagnoli C., Bozza S., Moretti S., Belladonna M. L., Vacca C., Conte C., Mosci P., Bistoni F., Puccetti P., Kastelein R. A., Kopf M., Romani L. 2007. IL-23 and the Th17 pathway promote inflammation and impair antifungal immune resistance. Eur. J. Immunol. 37:2695–2706 [DOI] [PubMed] [Google Scholar]
Associated Data
This section collects any data citations, data availability statements, or supplementary materials included in this article.