

Abstract
In an experiment delineating aciduric strains, food and clinical Listeria monocytogenes isolates tended to produce the most biomass whereas ovine and avian strains produced comparatively less biomass when exposed to high levels of sodium diacetate (SD) and potassium sorbate. Compared to reference strains that exhibited greater acid sensitivity, representative food isolates with comparatively good growth capacities in the presence of 21 mM SD at pH 5.0 accumulated reduced levels of acetate anion and K+ ion. The aciduric nature of SD-resistant strains was also reflected by comparatively high tolerance to pH 2.4 (HCl) acid challenges, a property boosted by the presence of SD. Exposure to elevated levels of SD (21 mM SD at pH 5.0) was found to have broad effects on gene expression, as differentiated from effects caused by mildly acidic conditions (pH 5.0). SD-resistant strain FW04/0025 was more responsive to elevated SD, increasing the expression of 222 genes (>2-fold change [P < 0.05]), compared to the more sensitive EGD reference strain, which exhibited increases in expression of 112 genes. Key differences between the strains in relation to SD-enhanced transcripts were notably associated with the cell envelope, oxidative stress management, and intermediary metabolism. SD thus appears to differentially influence growth efficiency and survival of strains, under conditions relevant to acidic foods, that could be due to altered cell wall and metabolic phenotypes.
Many food formulations include weak organic acids such as sodium diacetate (SD), sodium lactate, potassium benzoate, and potassium sorbate that act as effective preservatives against microbial growth, providing both safety and extended shelf life. Inhibition of microbial growth occurs due to the diffusion of unprotonated organic acids through lipid moieties of the cell wall and membrane into the cytoplasm, where subsequent dissociation lowers the internal pH (pHi) or, in the case of sorbate, interferes with membrane-associated processes (64). Since the cell envelope is relatively impermeable for the ionized form of organic acids, they tend to accumulate in the cytoplasm (54). Reduction of the pHi impedes generation of ATP and other cell processes such as motility and nutrient transport by diminishing the transmembrane ΔpH and electrochemical gradients. Homeostatic mechanisms maintaining a stable intracytoplasmic pH in Listeria spp. involve extrusion of protons (H+) from cells (59) or consumption of H+ by enzymatic systems, including the glutamate decarboxylase (GAD) and arginine deiminase (ADI) systems (14, 55).
The addition of 0.3% (21 mM) SD to ground beef and beef slurries (pH ∼5.2) under conditions of refrigerated storage is usually sufficient to prevent the growth of Listeria monocytogenes (60). However, customer sensorial demands restrict applications of sodium diacetate to <0.2%; thus, lower levels of sodium diacetate are usually combined with sodium lactate to achieve similar effects in a range of food formulations (25). To accelerate the processing time and maintain acceptable flavors, meat products are often dipped into lactate and acetate mixtures. There is a possibility that transient exposures to organic acids may contribute to survival and potential persistence of L. monocytogenes strains in factory environments by selecting for acid-resistant strains (39, 56, 62).
As with many other bacteria, when L. monocytogenes is grown under or encounters acidic conditions, an acid tolerance response (ATR) may occur that subsequently protects cells from growth-inactivating acidic conditions (46). The ATR is also cross-protective against other causes of stress, including heat exposure, oxidative stress, antimicrobials, and increased osmotic pressure, and can modulate virulence (13). Since the metabolism of L. monocytogenes relies on carbohydrates, it is naturally exposed during growth to accumulations of acidic end products that it forms, including lactate and acetate (53), and external pH declines in the absence of substantial buffering. Thus, L. monocytogenes has an inherent aciduric capacity, which is an important reason that this species is a persistent food safety problem. Its virulence to humans is closely associated with its aciduric nature, allowing it to survive in various acidic food products, in stomach gastric acid, and in the intestinal environment, which contains hydrolytic enzymes, bile, and organic acids accumulating from bacterial fermentative decomposition (5). Recent evidence suggests that the degree of survival in the alimentary canal could be dependent on the strain and its origin (49). Adaptation to acidic conditions involves induction of many genes, of which the best known are various RNA polymerase alternative sigma factor SigB-regulated genes (18, 63). However, adaptations that may specifically provide protection from or tolerance of organic acids and other forms of chemically imposed acid stress may not be linked (at least not directly) to known SigB-activated stress-protective systems (2, 22). Werbrouck et al. (66) also demonstrated that considerable strain variability occurs in response to survival of challenges involving acetate, including variations in gene expression, as determined by quantitative PCR (QPCR)-based assessments. There is little information available on intrinsic resistance to organic acids and whether specific adaptations occur among L. monocytogenes strains. Information about how L. monocytogenes strains cope with an external environment where high levels of unprotonated organic acid occur could be useful for a better understanding of L. monocytogenes physiology and ecology in acidic foods and within the gastrointestinal environment.
Acid resistance, when mentioned here, is defined as the ability to produce biomass within an acidic environment that remains growth permissive. Thus, this report focuses on the aciduric nature of L. monocytogenes and on its ability to grow in an acidic environment rather than on the process of acid adaptation per se. In this study, the initial goal was to determine the range of levels of organic acid resistance that occur among members of a genetically diverse set of L. monocytogenes strains isolated from throughout the food supply chain and to determine whether resistance patterns correlate with genetic type or strain origin. A second goal was to identify variations in phenotypic properties related to tolerance to SD, including the capacity for growth under acidic conditions, inherent acid tolerance, and relative intracellular accumulation of the acetate anion. Finally, the gene expression responses of different L. monocytogenes strains exposed to mineral acid (HCl [pH 5.0]) in comparison to the responses of the strains when exposed to elevated levels of SD were determined using cDNA microarray analysis. The goal was to define in detail the responses specific to SD exposure as opposed to mineral acid exposure. It is shown here that strains possessing heightened SD resistance have quite different growth and acid tolerance patterns and levels of acetate accumulation and gene expression.
MATERIALS AND METHODS
Strains.
A total of 117 L. monocytogenes strains (summarized in Table 1) were routinely cultivated on brain heart infusion (BHI) agar or in BHI broth (BHIB) at 25°C. The strains were procured from the Medical Microbiological Diagnostic Unit, University of Melbourne, Victoria, Australia, and from the Campden and Chorleywood Research Association, Chipping Campden, Gloucestershire, United Kingdom. Isolates from smoked salmon fillet samples and factory environment isolates were obtained from University of Tasmania Food Safety Centre, and the animal-derived isolates used in the study were collected by the Department of Primary Industries in Tasmania from 1962 to 1990. The reference strains utilized included EGD (ATCC BAA-679), ATCC 19111, ATCC 19112, ATCC 19113, ATCC 19114, ATCC 19115, ATCC 7644, LO28, 10403S, and Scott A. Long-term preservation of these strains included either cryopreservation in BHIB containing 20% glycerol stored at −85°C or lyophilization using fetal calf serum as a cryoprotectant.
TABLE 1.
Distribution of L. monocytogenes strains used in this study to assess organic acid resistance in relation to lineage, serotype, and origin and numbers of comparatively resistant and sensitive strains
| Genetic lineage and serotype | No. of strains from indicated source |
||||||
|---|---|---|---|---|---|---|---|
| Clinical | Food | Factory environment | Bovine | Poultry | Ovine | Other animals | |
| Lineage I | |||||||
| 1/2b | 1 (1b) | 2 | 1 | 1 | |||
| 3b | 1 (1b) | ||||||
| 4b | 5 (2b) | 1 (1b) | 9 (1a, 3b) | 2 | 11 (2a) | 3 | |
| 4e | 2 | 1 | 2 | 1 | |||
| Lineage II | |||||||
| 1/2a | 1 | 9 (3b) | 3 | 3 (1a) | 7 (3a) | 13 (4a) | 5 (1a, 1b) |
| 1/2c | 4 (1a) | 1 | 3 | ||||
| 3a | 1 | 1 | |||||
| Lineage III | |||||||
| 4a | 2 (1b) | 1 | 13 (2a, 1b) | 1 | |||
| 4c | 3 | 1 | |||||
Numbers of strains comparatively sensitive to organic acids (bottom 10% of growth responses).
Numbers of strains comparatively resistant to organic acids (top 10% of growth responses).
Strain typing.
The serotypes of the strains were determined or confirmed using a commercial L. monocytogenes-specific antigen test kit (Denka-Seiken, Japan). All strains were further assessed by PCR analysis of the inlJ (locus tag lmo2821) gene to confirm the identity of lineage III members, which lack this gene (17), and utilized forward primer 5′-TGT AAC CCC GCT TAC ACA GTT-3′ and reverse primer 5′-TTA CGG CTG GAT TGT CTG TG-3′, producing a 611-bp product. PCRs were performed using a volume of 50 μl containing 5 to 10 ng of template DNA, a 0.5 μM concentration of each primer, and 25 μl of HotStar TaqMaster Mix (Qiagen) under the following conditions: 95°C for 15 min, followed by 25 cycles of 94°C for 20 s, 60°C for 20 s, and 72°C for 45 s and a final 2-min step at72°C.
Organic acid tolerance screening and growth experiments.
Organic acid salt stock solutions were prepared in BHI broth and then diluted in BHI broth adjusted to pH 5.0 (±0.1) using HCl prior to autoclave sterilization. The pH was checked following autoclaving, and 0.2 ml of the solution was dispensed into 96-well microtiter plates in duplicate rows. Uninoculated blank wells and inoculated positive-control wells containing BHIB at pH 5.0 were also included. Different concentrations of four organic acid salts were tested: 8.9 to 156 mM sodium lactate, 3.3 to 33 mM potassium sorbate, 2.3 to 23 mM potassium benzoate (Sigma-Aldrich), and 0.35 to 70.3 mM sodium diacetate (Hoechst). Microtiter trays were inoculated with approximately 106 cells diluted from L. monocytogenes cultures grown in BHI broth at pH 5.0 for 48 h at 25°C. Trays were sealed with PCR adhesive film (Abgene, Epsom, United Kingdom) to avoid cross-contamination and evaporation, and changes in turbidity were monitored for up to 6 days using a Bio-Rad Benchmark microplate reader at 540 nm. Since we recognized that the initial amounts of cells that were inoculated into the wells might have differed, an alternative calculation method was established to enable comparison of strain growth responses for all treatments. For this purpose, an average absorbance reading ( ) was determined by averaging A540 readings obtained between 24 h and 48 h. The averaged absorbance reading for the pH 5.0 control (
 ) was subtracted from the corresponding averaged absorbance readings for organic acid salt treatments (
 ) to obtain a net absorbance increase (
 ). Based on the assumption that L. monocytogenes strains grow better in the absence of organic acid salts, the relative sizes of the
  values indicate the degrees of tolerance for a given organic acid salt, i.e., the lower the value, the better the growth in the presence of a given organic acid salt. All strains were compared by ranking
  values using the rank and percentile statistical function in Microsoft Excel. The experiment was repeated in triplicate, and the values determined were averaged and compared in box plots created using an online box plot calculator (http://www.physics.csbsju.edu/stats/box2.html). The differences between datasets, as determined on the basis of strain origin and genetic lineage, were determined using one-way analysis of variance (ANOVA) (SAS version 9.1; SAS Institute, Inc.).
Growth and acid challenge experiments.
Strains FW04/0025 (SD-resistant strain) and EGD (average SD resistance), both serotype 1/2a, were grown statically at 25°C in 20-cm-long L-shaped tubes that contained 10 ml of BHI broth adjusted to different pH values (pH 5 to 8) and that also contained 0, 10, or 20 mM sodium diacetate. The turbidity of the tubes, compared to the turbidity of an uninoculated blank tube, was monitored at A600 (Spectronic 20 tube spectrophotometer). The Microsoft Excel DMFit plug-in (4) was used to analyze the data to determine growth rates and yields (maximum A600 value). The same selected strains were also tested for survival after exposure to BHI broth adjusted to pH 2.4 using HCl for 2 h. Just prior to and following the acid exposure, agar plate counts were determined by serial dilution onto BHI agar with incubation at 25°C for 48 h before colony number enumeration was performed.
Intracellular K+ and acetate levels.
Strains EGD, ATCC 19111, FW04/0025, and FW04/0023 were grown to the mid-exponential-growth phase or stationary-growth phase in BHI broth at 25°C with pH left unadjusted, adjusted to pH 5.0, or adjusted pH 5.0 and amended with 20 mM sodium diacetate and 0.37 MBq [2-14C]acetate. The cell suspensions were centrifuged (14,000 rpm, 5 min) through silicone oil, supernatant samples were collected, and the pellets were clipped directly from the tubes. Supernatants and pellets were then fully resuspended in scintillation fluid, and counts for [2-14C]acetate were obtained using scintillation counting. Intracellular acetate levels were estimated according to the method of Riebeling et al. (51). Replicate pellets were also washed three times at 4°C in 0.25 M NaCl-1 mM MgCl2 (pH 7.0) solution and then boiled for 30 min to release K+ ions. The supernatant K+ concentration was determined using flame photometry (58). The cell volumes were assumed to be equal to 3.0 μl of protein mg−1 (52), since the cell dimensions of the strains were similar for the various strains and under the various acidic conditions tested.
cDNA microarray-related treatments.
For microarray experiments, strains EGD and FW04/0025 were independently compared. The strains were grown in BHI broth under three different sets of conditions: nonstressed (pH 7.3), mildly acidic (pH 5.0), and high SD concentrations (21 mM SD at pH 5.0). In all cases, cultures were grown to the mid-exponential-growth phase (A600 = ∼0.15 to 0.20) in a Ratek shaking water bath (100 oscillations min−1) at 25°C, utilizing 200-ml side-arm flasks that allowed regular checking of cell suspension turbidity. The neutral pH control cultures were grown in 50 ml of BHI broth (pH 7.3 ± 0.05), with the culture pH dropping to 6.9 (±0.1) at the time of harvesting. For mildly acidic conditions, cultures were grown in BHI broth adjusted to pH 5.0 (± 0.05) using HCl. At the time of harvesting, the pH remained unchanged. SD treatment cultures included BHI broth at pH 5.0 amended with 0.3% (wt/vol) sodium diacetate; during growth and until the time of harvesting, the pH again remained stable. At pH 5.0, not including any acetate formed during growth, the unprotonated acetate concentration thus remained at 7.6 mM. In order to stabilize the cellular RNA content, the cultures were treated with RNA Protect reagent (Qiagen) according to the manufacturer's protocol.
RNA extraction.
The cultivation processes indicated above were replicated on separate days, resulting in four biologically replicated samples for each experiment. Cell pellets were defrosted and underwent a 6-h (25°C) enzymatic treatment in TE buffer (10 mM Tris HCl, 1 mM disodium EDTA, pH 7.5) containing 20 mg of lysozyme ml−1 and 10 mg of proteinase K ml−1. Cells were suspended in RNAeasy MIDI RNA extraction kit (Qiagen) lysis buffer containing 0.1% β-mercaptoethanol and were completely lysed by sonication. Sonication was performed using a Branson 450 sonifier and three 30-s pulses at maximum power, with samples placed on ice for 20 s between pulses. RNA was then extracted and purified using the RNAeasy kit and subsequently stored at −75°C. RNA quality and quantity were assessed with an Agilent Technologies 2100 Bioanalyzer and RNA LabChip. RNA integrity scores ranged from 6.9 to 8.2.
Microarray analysis.
RNA samples were hybridized to a microarray slide that included an L. monocytogenes AROS version 1 oligonucleotide set (Eurofins MWG Operon, Huntsville, Al), which incorporates all predicted protein-coding genes (and pseudogenes) of the complete, published genome of L. monocytogenes strain EGD-e (GenBank accession no. AL591824). Oligonucleotides were arrayed on glass slides using quill pens at the Australian Genomic Research Facility Ltd. (Walter & Eliza Hall Institute of Medical Research, Parkville, Victoria, Australia,), with each spot measuring 12 μm in diameter. About 10 to 15 μg of total RNA was converted to cDNA and postlabeled using Cy5 (red) and Cy3 (green) fluorescent dyes and a SuperScript III indirect cDNA labeling system (Invitrogen). Details of the slide prehybridization and subsequent hybridization and washing steps have been previously described (11). Slides were scanned using a GenePix 4000B scanner (Axon Instruments). Downstream processing used the GenePix-Pro software package to generate GPX files from TIFF array images. Global normalization of raw data followed the method of Kort et al. (34). Oligonucleotides found to show weak hybridization signals were excluded from subsequent analysis. Weak hybridization signals were defined as fluorescence signals from the background-corrected Cy3 and Cy5 channels totaling a spot intensity (A) of <5.0, where A = [log2(Cy3) + log2(Cy5)]/2.
Significance testing utilized one-way ANOVA analysis (SAS version 9.1) of the normalized signal intensities, with P values adjusted using false discovery rate (FDR) analysis to determine the possibility of false-positive results (6). This was achieved using the PSMOOTH option in SAS version 9.1. Microarray data files for all treatments are available from the Gene Expression Omnibus (GEO) database (http://www.ncbi.nlm.nih.gov/geo/) under accession number GSE19918.
Gene expression trend analysis.
Gene designations and known or predicted functions and categorization of coded proteins from the L. monocytogenes EDG-e genome were based on information obtained from published literature, namely, the Kyoto Encyclopedia of Genes and Genomes (http://www.genome.ad.jp/kegg/) and ListiList (http://genolist.pasteur.fr/ListiList/). A t test-based procedure described by Boorsma et al. (10) was utilized to score the changes in expression of predefined sets of genes. The significance of the T-value score was established by using the associated two-tailed P value. In addition to functional categories, the T-value scores for gene sets equivalent to the regulons that comprise genes under the influence of transcriptional regulators SigB (26, 48), CtsR (29), HrcA (28), PrfA (44), CodY (7), and VirR (40) were determined.
Quantitative PCR of mRNA transcripts.
The Delta-Delta CT estimation method (37) was used to estimate the ratios of a series of 20 different mRNA transcripts in control RNA samples from strains EGD and FW04/0025 compared to RNA obtained from samples grown in BHIB adjusted to pH 5.0 and containing either 0 or 21 mM SD. RNA extraction was performed as indicated above. QPCR analysis was performed using a reaction volume of 10 μl with 2 μl of an RNA sample or a 16S rRNA gene DNA internal standard and 1 pmol of each primer (see Table S1 in the supplemental material) and employing one-step QuantiTect SYBR green QPCR kits. Oligonucleotide primers were defined using Primer3Plus software (65) and included regions that have exact matches to sequenced L. monocytogenes genomes determined in silico (see Table S1 in the supplemental material). PCR experiments were set up automatically using a liquid-handling pipettor robot station (Corbett Research). PCR was performed using a Rotorgene model 3000 thermocycler (Corbett Research, Mortlake, NSW, Australia) under the following thermal-cycling conditions: 30 min at 50°C and 15 min at 95°C followed by 40 repeats of 15 s at 94°C, 30 s at 50°C, and 30 s at 72°C. Data collection and amplification efficiency correction were performed using Rotorgene 6000 software. In each run, two negative controls (RNA-free water) were included. Melt curve analysis (45°C to 95°C) and agarose electrophoresis was performed following each run to ensure the formation of homogenous amplicons. For each RNA sample analyzed, measurements of gene expression were determined in triplicate; the mean of these values was plotted against a standard curve based on known concentrations of the 16S rRNA gene (104 to 108 copies μl−1). The PCR efficiency of the different transcripts assessed was assumed to equal the PCR efficiency of the standard, which averaged 0.93, while repeated 5-point standard curves had regression values of >0.99.
Microarray data accession number.
Microarray hybridization-derived information included in this report has been deposited under Gene Expression Omnibus (GEO) database accession no. GSE19918.
RESULTS AND DISCUSSION
Organic acid resistance and sensitivity among L. monocytogenes strains.
No significant differences between strains exposed to sodium lactate over a wide range of concentrations (9 to 156 mM) were observed. The results seen after addition of 21 mM SD, 26 mM potassium sorbate, and 18 mM potassium benzoate correlated most closely between the strains tested in terms of net growth (r2 = 0.35 to 0.5 [P < 0.05]). The top- and bottom-ranked net growth responses among the strains tested were determined and indicated that the highest proportions of organic-acid-resistant strains were mainly derived from food and clinical samples (Table 1). Overall, on the basis of net growth, lineage I strains appeared to be more resistant to SD than lineage II strains (F1,94 = 8.25 [P = 0.005]); however, the distributions of growth responses in box plots were similar (Fig. 1). This result was likely influenced by the choice of strain source, since large numbers of ovine and avian strains are concentrated within lineage II (Table 1). Differences between genetic lineages related to growth performance in the presence of potassium sorbate and benzoate were less significant (P = 0.08 to 0.11). There was no statistical correlation with organic acid resistance with regard to strain serotype. Poultry and sheep strains tended to be significantly (P = <0.01) more sensitive to SD and potassium sorbate than strains from other sources, including cattle, factory environments, and food and clinical samples (Fig. 1B and C).
FIG. 1.

Box plots showing the interquartile ranges (boxes contain 50% of values) and standard deviations of absolute net growth of L. monocytogenes in the presence of different organic acids (in BHIB adjusted to pH 5.0). Graph A indicates the distribution of growth differences between genetic lineages I, II, and II in response to SD and potassium sorbate; graphs B and C show growth responses in relation to strain origin. Open circles represent outlier values. The horizontal lines within the boxes represent mean values, while error bars represent standard deviations. Genetic and source distributions of strain tests are shown in Table S1 in the supplemental material.
Strain diversity within L. monocytogenes may affect phenotypic characteristics, for example, virulence (57), and may lead to variants with different levels of resistance to and tolerance of different forms of stress (56, 62). These differences may affect the incidence of the strains in the environment, including the food supply chain (39), and their presence in human clinical samples (23). Differences in inactivation rates among serotype groups have been previously observed following exposure to dry coleslaw mix at pH 3.5 (20). Some serotype 4b isolates were found to be more resistant to exposure to broth acidified to pH 3.0 with lactate (36). Though no significant differences in sodium lactate resistance under growth-permissive conditions were observed here, inherent resistance varies more for the other higher-pKa-value organic acids, in particular, SD. The bias toward organic-acid-tolerant strains among strains from different sources (Fig. 1B and C) may suggest that strain selection occurs in food-processing settings and in other food environments; however, a wider range of strains from clinical, food, and factory environment samples would need to be investigated to determine whether this trend is consistent and whether it can be attributed to definable phenotypes.
Intrinsic acid resistance of SD-resistant strain FW04/0025.
Since SD had a substantial effect on growth for different strains and is a widely used preservative in food, the growth rates and growth yields (determined here as modeled optical density [OD] endpoints) of strains were compared in greater detail to determine whether good growth in the presence of SD relates to intrinsic acid resistance. The selected FW04/0025 SD-resistant strain, a serotype 1/2a isolate from a fermented seafood product, grew consistently better than the more sensitive EGD reference strain in BHIB (initially adjusted to pH 5.0 to 8.0, the BHIB acidified to different extents due to end product formation) (Fig. 2). This acidification of the media occurred very similarly for the strains tested despite differences in growth yields. Growth yields declined slowly with lower initial pH in a linear fashion until the initial pH dropped below pH 4.8 to 5.2, depending on the level of exogenous SD added (Fig. 2), at which point a rapid growth decline occurred that seems to have corresponded to substantial increases in intracellular accumulation of acetate anion and K+ ions (Fig. 3). Food isolates FW04/0023 (from a vinegar-containing salad product) and FW04/0025 accumulated less acetate and K+ than reference strains EGD and ATCC 19111 (Fig. 3), despite the culture pH remaining very similar for all the strains. Higher levels of K+ ions have been shown to accumulate when cytoplasmic acetate anion levels increase (15) and apparently act to mitigate the acidification impact of acetate anion by charge neutralization (31). SD-resistant strains such as FW04/0025 and FW04/0023 thus appear to exhibit phenotype-mitigating acetate anion accumulation, which may contribute to the aciduric nature of the strains.
FIG. 2.

Growth rates and maximum growth levels observed for L. monocytogenes strains grown in BHI initially adjusted to a range of different pH values (pH 5.0 to 8.0) in the presence of different levels of SD. The final pH levels (±0.03 pH between strains) indicate the results of acidification of broth due to end product formation during growth. Strains tested included FW04/0025 (closed squares) and EGD (open circles). Data were determined by fitting a logistic D-model (4) to optical density data (collected at 600 nm), with error bars indicating the standard error associated with fitting the model. Model fits had r2 values of >0.98. An A600 of 0.1 equated approximately 2 × 10⁸ CFU ml−1.
FIG. 3.

Intracellular levels of acetate and K+ ion in L. monocytogenes strains grown to the early-stationary-growth phase in BHI broth initially at pH 7.3 (white bars), pH 5.0 (hatched bars), pH 5.0 + 10 mM SD (shaded bars), and pH 5.0 + 20 mM SD (black bars). The pH values for the four different sets of conditions when cells were harvested were pH 6.6, 4.7, 5.0, and 5.0, respectively. Error bars represent standard deviations derived from the results of 3 to 4 separate biological replicate experiments.
Promotion of acid tolerance by SD.
Variations in acid tolerance were examined for strains FW04/0025 and EGD to determine whether an SD resistance phenotype is also associated with better acid tolerance. It was found that exponential-growth-phase cultures exhibited pH-dependent ATR responses (Fig. 4), as indicated by the better rate of survival of pH 2.4 acid challenges, after the cultures were grown in initially more acidic broths. FW04/0025 exhibited considerably better survival than EGD, especially when initially grown under acidic conditions. Addition of 10 mM SD promoted survival considerably, though the dynamics of enhanced survival differed considerably between the strains. Moreover, SD also promoted survival in stationary-growth-phase cultures, especially in the initially less acidic cultures (Fig. 4). The overall results indicate that strain-level variations are considerable with regard to the interacting effects of initial medium pH, growth state, and presence of SD, as is consistent with the results of other studies showing that adapted cells and subsequent acid shock in the presence of acetate led to substantial strain-to-strain variations in survival (66). SD directly promotes acid challenge survival, even in already acidic broths. This indicates that SD may influence separate genetic programs that lead to a more acid-tolerant phenotype, especially in the case of strain FW04/0025.
FIG. 4.
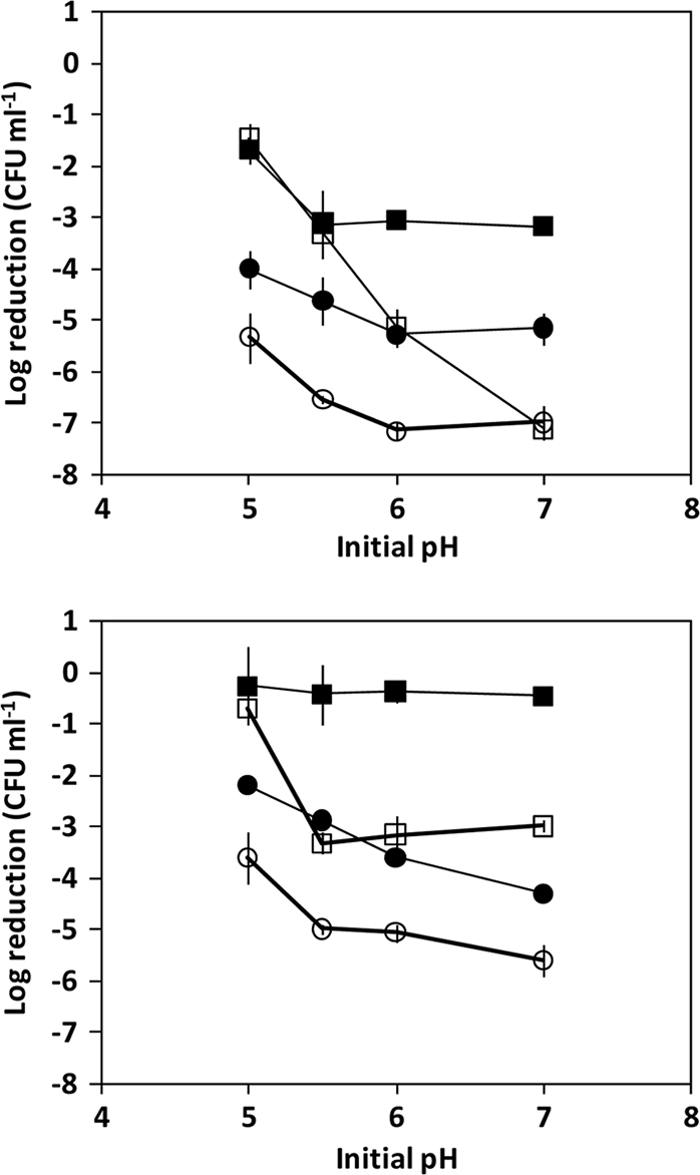
CFU log reduction of L. monocytogenes strain numbers after acid challenge tests in BHI broth acidified to pH 2.0 with HCl and a 120 min of exposure. Cultures were diluted to approximately 108 CFU ml−1 before acid shock was applied after being grown in BHI at a range of initial pH values (pH 5.0 to 7.0) in the absence (open symbols) and presence (closed symbols) of 20 mM SD and tested at the mid-exponential-growth phase (upper graph) and during the early-stationary-growth phase (lower graph). Strains tested included EGD (squares) and FW04/0025 (circles).
Global transcriptomic changes in strains with different acid sensitivities.
To better understand the physiological and phenotypic modifications occurring in L. monocytogenes during exposure to SD, genetic responses that occurred during growth when intracellular acetate anions were present at a high level (21 mM SD at pH 5.0) and a lower level (pH 5.0) (as represented in Fig. 3) were determined by cDNA microarray hybridization analysis. Strains EGD and FW04/0025 were tested independently to compare their different growth, acid tolerance, and accumulation responses in the presence of SD (Fig. 2 to 4). Because strain FW04/0025 was of serotype 1/2a, it was deemed suitable for testing with the strain EGD-based AROS version 1 microarray platform, since a high proportion (95 to 96%) of probes had perfect or near-perfect matches across all serotype 1/2a strains for which either complete or draft genome sequences have been determined (data not shown). However, it should be noted that the comparisons do not reveal whether strain-specific genes are responsible for SD resistance. Nevertheless, the experiments allowed the potential determination of different genetic responses leading to the observed differences between the test strains in levels of intrinsic acid resistance and the determination of the effect of SD itself on gene expression responses. A total of 2,802 genes were compared after filtration had removed transcripts that generated weak or no hybridization signals. The T-profiler approach (10) was found to be useful for a general appraisal of genetic response trends in these experiments, though it should be noted that this approach is limited by the required a priori understanding of the gene functionality and regulatory networks comprising L. monocytogenes genetic data derivable from online databases and literature sources. QPCR of 20 genes (see Table S1 in the supplemental material) was used to validate the results, with regression analysis (r2 = 0.65 to 0.92) indicating good reliability of the data with the normalization approach employed. A slight general trend of underestimation of expression changes appeared to occur for the microarray experiments in relation to the QPCR data (see Fig. S1 in the supplemental material).
A 4-way Venn diagram indicating numbers of genes found to be significantly increased (≥2-fold [P < 0.05]) in expression in comparisons of the strains under the two sets of acidic conditions revealed that a large number of common and differential responses to SD were distinct from the results seen under conditions of mild acid stress, i.e., growth at BHI acidified to pH 5.0 (Fig. 5). Strain FW04/0025 in particular elicited a large number of SD-specific induced responses in comparison to EGD (Fig. 5). Mildly acidic stress and SD itself affected fundamental aspects of the cell, including expression of different regulons and functionally associated gene sets (Table 2). SD was observed to have effects on several genes involved in such processes and that were producing congruent (Table 3) as well as distinct (Table 4) differential response patterns in comparisons of strains EGD and FW04/0025. After an examination of broad trends, the most obvious effects of SD appear to be stimulatory with respect to the SigB, PrfA, HrcA, and CtsR regulons (Table 2) and to be focused on oxidative stress, DNA repair, and intermediary metabolic, cell wall-related, and cofactor and fatty acid biosynthetic processes (Table 2).
FIG. 5.

Four-way Venn diagram showing the distribution of significantly upregulated genes, defined as having increased ≥2.0-fold (P < 0.05) in expression, for strains EGD and FW04/0025 grown to the exponential-growth phase and including a comparison of levels of gene expression in cultures grown at pH 5.0 and pH 7.3 and in cultures grown at pH 5.0 + 21 mM SD and pH 5.0. The numbers in intersections represent the number of genes shared between the different treatments for the two strains. Circled numbers indicate accumulated numbers of genes showing SD-influenced expression responses.
TABLE 2.
Statistical trends in gene expression observed for regulons and for functionally-defined sets of genes in L. monocytogenes strains EGD and FW04/0025 grown in acidified BHI broth
| Gene set | No. of genes in set |
T valuea |
|||
|---|---|---|---|---|---|
| Strain EGD |
Strain FW04/0025 |
||||
| pH 5.0 vs pH 7.3 | pH 5.0 vs pH 5.0 + 21 mM SD | pH 5.0 vs pH 7.3 | pH 5.0 vs pH 5.0 + 21 mM SD | ||
| Regulonsb | |||||
| SigB (act) | 195 | 6.04 | 5.24 | 5.74 | 5.65 |
| PrfA (act) | 66 | 6.68 | 4.87 | 2.14 | 4.46 |
| HrcA (rep) | 25 | 0.54 | 4.22 | −0.66 | 2.24 |
| CtsR (rep) | 43 | 3.26 | 1.53 | −1.16 | 3.61 |
| VirR (act) | 17 | 2.61 | −2.47 | −4.66 | 3.16 |
| CodY (rep) | 84 | −5.69 | −1.07 | −0.64 | −4.50 |
| Functional groups | |||||
| Cellular processes | |||||
| Cell wall biogenesis | 76 | 2.73 | 0.21 | −3.31 | 3.61 |
| Peptidoglycan bound proteins | 49 | −4.46 | −4.77 | −0.18 | −6.09 |
| Phosphotransferase systems | 101 | −5.84 | −2.59 | −0.86 | −5.53 |
| ABC-type transporters | 173 | 0.94 | −1.27 | −3.75 | −2.49 |
| Other transporters | 130 | 0.57 | −1.98 | −2.04 | −4.01 |
| Signal transduction | 45 | 2.29 | 3.74 | −0.49 | 3.56 |
| Membrane energetics | 39 | 5.33 | 2.42 | −0.69 | 4.83 |
| Motility-chemotaxis | 36 | −6.02 | −0.46 | −0.14 | −2.12 |
| Protein export | 29 | 1.43 | −0.90 | −2.10 | 0.95 |
| Cell division | 25 | 1.02 | 0.31 | −2.76 | 2.70 |
| Cellular metabolism | |||||
| Carbohydrate and related compound metabolism | 193 | −1.34 | 2.37 | 2.73 | −2.14 |
| Amino acid and related compound metabolism | 156 | −3.45 | −0.51 | 0.71 | −1.26 |
| Lipid metabolism | 76 | 3.72 | 3.63 | −2.05 | 4.88 |
| Cofactor metabolism | 117 | 2.55 | 3.97 | 2.63 | 3.45 |
| Information-associated processes | |||||
| DNA repair | 63 | 1.84 | 3.40 | 2.21 | 2.40 |
| DNA packaging and partitioning | 23 | 1.67 | 2.34 | −0.28 | 1.57 |
| RNA transcription-regulation | 236 | −2.40 | −0.98 | 0.87 | −0.84 |
| RNA modification | 67 | 3.21 | 3.67 | −0.19 | 4.91 |
| Protein synthesis | 97 | 9.87 | 1.57 | 0.19 | 4.19 |
| Protein folding | 19 | 1.46 | 5.12 | 1.88 | 3.44 |
| Other functions | |||||
| Phage-IS elements | 98 | −6.14 | −5.52 | 3.06 | −8.88 |
| Oxidative stress management | 28 | 3.49 | 3.10 | 1.44 | 4.76 |
| Detoxification | 25 | 0.27 | 1.48 | 3.05 | 0.54 |
Results represent T values determined according to formulae of Boorsma et al. (10). The two-tailed significance value can be determined with the TDIST function in Microsoft Excel using the number of genes minus 2 for the degrees of freedom.
act, activated; rep, repressed; IS, insertional element.
TABLE 3.
Comparison of acidic-stress-related congruent gene expression results for strains EGD and FW04/0025 grown under two different sets of acidic stress conditions
| Gene(s) or locus tag | Regulon(s)a | Predicted or known function | Fold change for strainb: |
|||
|---|---|---|---|---|---|---|
| EGD |
FW04/0025 |
|||||
| pH 5.0 | pH 5.0 + SD | pH 5.0 | pH 5.0 + SD | |||
| lmo0043 | SigB | Arginine deiminase (ADI system) | 1.7 | 1.0 | 1.7 | −1.1 |
| lmo0189 | Unknown | 2.7 | 3.3 | 2.2 | 20.5 | |
| lmo0211 (ctc-rplY) | SigB | Ribosomal protein L25 | 1.6 | 2.0 | 3.4 | 6.0 |
| lmo0231 | SigB, CtsR | Possible arginine-creatine kinase | 1.4 | 2.0 | 1.2 | 2.1 |
| lmo0292 | Heat-oxidative stress responsive serine protease | 1.4 | 2.2 | 4.5 | 3.0 | |
| lmo0486 (rpmF) | SigB | Ribosomal protein L32 | 6.9 | 2.5 | 5.0 | 5.5 |
| lmo0726, lmo0727 (glmS) | HrcA | GlcN6P synthase | −1.9, −2.7 | 2.4, 1.5 | −1.3, −1.4 | 5.1, 3.2 |
| lmo0866 | RNA helicase | 2.9 | 2.1 | 3.7 | 2.1 | |
| lmo0919 | ABC-type transporter, ATP-binding protein | 1.0 | 2.9 | −1.3 | 4.4 | |
| lmo0953 | SigB, PrfA, CodY | Unknown (lipoprotein) | 2.2 | 2.1 | 3.4 | 2.9 |
| lmo0964 | Thioredoxin family protein | 1.9 | 1.7 | 2.2 | 2.9 | |
| lmo1302 (lexA), lmo1303 | SOS response, DNA repair | 1.1, 1.2 | 2.3, 2.0 | 1.2, 1.0 | 2.5, 3.0 | |
| lmo1369-lmo1374 | Branched-chain fatty acid primer synthesis | 1.3, −1.1, −1.1, −1.1, 1.3, 1.0 | 1.4, 1.7, 2.0, 1.5, 1.7, 2.5 | −2.3, −1.5, −1.2,−1.3, 1.4, −1.2 | 2.9, 3.6, 5.2, 3.2, 2.9, 2.4 | |
| lmo1375 (pepT) | SigB | Aminopeptidase | 1.0 | 1.7 | 1.2 | 3.1 |
| lmo1381 | Acylphosphatase | −2.0 | 1.6 | −1.9 | 2.3 | |
| lmo1398 (recA) | SOS response, DNA repair | −1.1 | 1.9 | 1.3 | 3.0 | |
| lmo1501-lmo1503 | Holliday junction resolvase | −1.1, 1.0, 1.1 | 2.1, 1.8, 1.4 | −1.3, 1.5, 1.4 | 5.2, 5.4, 3.4 | |
| lmo1673-lmo1676 (menBHDF) | SigB | Menaquinone biosynthesis | 1.1, 1.1, −1.2, 1.3 | 2.1, 1.9, 1.5, 1.4 | 1.1, 1.2, −1.1, −1.1 | 3.0, 4.1, 2.5, 2.3 |
| lmo1683 (perR) | HrcA | Peroxide-responsive regulator | −1.1 | 1.8 | 1.1 | 5.1 |
| lmo1718-lmo1721 | Phosphotransferase system | −2.2, −1.9, −3.1, 1.1 | 2.7, 1.6, 3.0, 1.7 | −1.2, −1.8, −2.0, 1.0 | 5.5, 3.1, 5.2, 3.4 | |
| lmo1881 | 5′-3′ Exonuclease | 2.5 | 4.4 | 1.8 | 6.7 | |
| lmo1882 (rpsN) | Ribosomal protein S14 | 2.7 | 4.2 | 1.2 | 4.4 | |
| lmo1900-lmo1902 (panDCB) | Coenzyme A biosynthesis | 1.2, 1.4, 1.6 | 2.9, 2.3, 3.5 | 1.1, 1.9, 2.8 | 2.5, 5.7, 11.1 | |
| lmo1903 (trxC) | Thioredoxin | 1.4 | 2.9 | 2.0 | 3.8 | |
| alsD, alsS | CtsR | Acetoin biosynthesis | 2.1, 1.9 | 2.7, 3.7 | 5.4, 4.4 | 3.2, 3.0 |
| lmo2101, lmo2102 (pdxST) | Vitamin B6 biosynthesis | 1.5, 1.3 | 2.8, 2.9 | 2.4, −1.1 | 8.2, 5.6 | |
| lmo2103 (pta) | Phosphate acetyltransferase | 1.5 | 3.0 | 2.6 | 4.7 | |
| lmo2199 (osmC), lmo2200 | Putative organic peroxidase | 1.5, 1.5 | 3.3, 5.0 | 3.0, 3.9 | 8.9, 7.2 | |
| lmo2257 | Unknown | 1.0 | 2.6 | 1.3 | 6.2 | |
| gadCB | Glutamate decarboxylase (GAD) system | 9.8, 7.5 | −2,2, −1.6 | 4.2, 7.1 | −2.4, −1.9 | |
| lmo2471-lmo2473 | SigB | Unknown | 1.7, 2.1, 1.3 | 2.4, 2.9, 2.4 | 2.7, 1.8, −1.2 | 3.3, 2.9, 2.7 |
| lmo2810 (gidA) | tRNA modification | −1.2 | 2.0 | 1.2 | 6.1 | |
Fold change values in bold represent statistically significant increases in expression (P < 0.05 [FDR adjusted]). Fold change values that are underlined represent statistically significant decreases in expression (P < 0.05 [FDR adjusted]).
TABLE 4.
Acidic-stress-related differential and congruent gene expression responses, mainly comprising specific SD exposure-related responses occurring with strains EGD and FW04/0025
| Strain and gene and/or locus tag(s) | Regulon(s)a | Predicted or known function | Fold change for strainb: |
|||
|---|---|---|---|---|---|---|
| EGD: |
FW04/0025: |
|||||
| pH 5.0 | pH 5.0 + SD | pH 5.0 | pH 5.0 + SD | |||
| EGD | ||||||
| lmo0136, lmo0137 | SigB | Putative glutathione transport | 2.5, 1.9 | −1.6, −1.3 | −1.8, −2.0 | −5.3, −2.1 |
| lmo0361, lmo0362 (tatAC) | SigB, CtsR | Tat protein export | 5.9, 7.5 | 1.1, −1.7 | −1.2, 1.2 | −6.1, −3.2 |
| lmo0367, lmo0377 | SigB | Iron peroxidase-transport | 3.0, 4.5 | −1.2, −1.7 | −1.3, −1.4 | −3.4, −3.8 |
| lmo0477-lmo0479 | CodY | Unknown secreted proteins | 4.9, 2.5, 2.4 | −3.6, −3.3, −1.6 | −17.1, −12.3, −2.0 | −13.3, −14.1, 1.6 |
| lmo0872 | MFS efflux transporter | 4.6 | −8.6 | −4.9 | −4.3 | |
| lmo2005 | Aldo-keto reductase | 7.2 | −1.1 | 1.7 | 1.1 | |
| lmo2180 | SigB | Unknown | 5.4 | −1.2 | −1.2 | −2.1 |
| lmo2181 | SigB | Sortase B | 4.7 | 1.1 | 1.0 | 1.1 |
| lmo2182-lmo2186 | SigB | Iron binding-transport | 7.8, 4.9, 4.3, 2.9, 3.9 | 1.1, −1.0, 1.1, 1.7, 1.7 | 1.0, −1.5, 2.0, 1.5, 1.7 | 1.1, −1.2, −1.4, −1.4, 1.5 |
| Lip-1 cluster (lmo0201-lmo0205) | PrfA | Virulence, intracellular survival | 1.0, −1.6, 1.0, −1.6, −1.1 | 1.7, 5.2, 1.1, 1.9, 2.6 | −2.4, 2.6, 2.9, −3.5, −1.9 | 1.0, −1.4, −2.1, −1.8, 1.3 |
| lmo0905 | Tyrosine protein phosphatase | 1.9 | 2.9 | 1.3 | 1.4 | |
| lmo1301 | Putative acetyltransferase | 1.3 | 3.1 | −2.0 | 1.1 | |
| lmo1460 (recO) | DNA repair protein | 1.0 | 2.5 | −1.6 | 1.4 | |
| lmo1508 | Two-component histidine kinase | 1.1 | 2.7 | −1.2 | −1.5 | |
| lmo2677 | Uncharacterized hydrolase | 4.0 | 8.5 | −1.6 | −1.2 | |
| lmo2678-lmo2682 (kdpEDCBA) | Potassium transport (Kdp operon) | 8.1, 8.6, 7.1, 9.0, 9.4 | 7.6, 10.1, 8.0, 7.9, 5.3 | −1.6, −1.3, −1.8, 1.1, −1.6 | −1.2, 2.0, 1.3, 1.5, −2.2 | |
| lmo2699 | Uncharacterized hydrolase | 1.7 | 3.9 | −2.1 | −2.1 | |
| FW04/0025 | ||||||
| lmo0096-lmo0099 (mptABCD) | Phosphotransferase system | 3.4, 2.7, 3.0, 4.7 | −1.8, −1.4, −1.9, −1.5 | −1.4, 1.0, −1.2, −1.2 | 3.3, 5.4, 2.8, 4.0 | |
| lmo0415 (pgdA) | SigB | Peptidoglycan GlcNAc N-deacetylase | 1.2 | −1.4 | −1.7 | 3.0 |
| lmo0582 (iap) | SigB | Invasion protein (murein hydrolase) | 1.2 | 1.2 | 1.7 | 2.6 |
| lmo0800 | Unknown HesB domain protein | 1.6 | 1.3 | 1.6 | 7.9 | |
| lmo0906 | Glutathione reductase | −1.1 | 1.0 | −1.6 | 2.0 | |
| lmo0954, lmo0955 | SigB | Unknown proteins (PspA domain) | 2.7, 1.7 | 2.1, 1.8 | 1.3, 1.7 | 19.6, 10.0 |
| lmo0972-lmo0974 (dltDCBA) | VirR, SigB, CodY | Teichoic acid d-alanylation | 1.6, 1.4, 1.5, 1.6 | −1.5, 1.8, −1.8, 1.5 | 1.1, −1.1, −2.1, −1.4 | 5.0, 5.9, 4.5, 5.5 |
| lmo0983 | Glutathione peroxidase | −1.2 | 1.1 | −1.7 | 2.0 | |
| lmo0995, lmo1291 | Putative peptidoglycan O-acetyltransferase | 3.9, 1.0 | −2.3, 1.4 | 1.4, 1.3 | 2.1, 2.3 | |
| lmo1007 | SigB, CodY, CtsR | Unknown | 1.4 | 1.5 | 2.8 | 3.3 |
| lmo1052-lmo1055 (pdhABCD) | SigB | Pyruvate dehydrogenase | 1.6, 2.0, 2.0, 1.7 | 1.1, 1.3, 1.8, 2.2 | 5.7, 3.5, 5.5, 7.6 | 2.1, 1.9, 3.0, 2.9 |
| lmo1057-lmo1059 | Unknown-uncharacterized proteins | 1.5, 1.4, 1.2 | 1.3, 1.7, 1.5 | 1.6, 2.0, 1.9 | 2.8, 3.3, 2.7 | |
| lmo1094 | Unknown | 1.0 | 1.1 | 1.3 | 3.1 | |
| lmo1333, lmo1334 | Unknown secreted proteins | 1.5, 1.4 | 1.4, 1.4 | 1.2, 1.3 | 6.7, 4.1 | |
| lmo1338, lmo1339 (glk) | Glucokinase | 1.4, 1.1 | 1.1, −1.0 | 1.4, 1.1 | 3.4, 2.9 | |
| lmo1566 (citC) | Isocitrate dehydrogenase | −1.9 | 1.3 | −1.6 | 3.3 | |
| lmo1649, lmo1650 | CodY | Unknown (membrane proteins) | −1.1, 1.4 | 1.1, 1.1 | −1.1, 1.5 | 3.5, 2.5 |
| lmo1670 | SigB | Unknown | 1.1 | −1.4 | −1.2 | 4.2 |
| lmo1956 (fur) | HrcA | Iron uptake regulation | 1.8 | −1.7 | 1.7 | 3.5 |
| lmo1966, lmo1967 | Unknown (similar to toxic anion resistance proteins) | 2.2, 1.3 | 1.1, 1.8 | 1.6, 1.8 | 6.9, 12.4 | |
| lmo2054, lmo2055 | HrcA | Competence (comK) regulation | 1.6, 1.3 | 1.2, −1.1 | −1.8, 1.7 | 4.7, 2.4 |
| lmo2191 (spx) | SigB | Oxidative-stress-responsive regulator-glutaredoxin | 1.6 | 1.4 | 2.5 | 2.0 |
| lmo2201, lmo2202 (fabFH) | SigB | Fatty acid biosynthesis | 1.8, 1.4 | 1.4, −2.6 | 1.9, 1.2 | 2.1, 7.4 |
| lmo2397 | CtsR | Unknown (NifU domain protein) | 1.5 | −1.4 | 1.5 | 3.7 |
| lmo2411-lmo2415 | Iron-sulfur cluster assembly | 1.4, 1.2, 1.4, 1,2, 1.1 | −1.0, 1.5, 1.0, 1.3, 1.2 | 2.5, 2.3, 1.7, 2.1, 2.1 | 2.9, 2.6, 2.4, 1.5, 2.2 | |
| lmo2424 (trxA), lmo2426 | HrcA | Thioredoxin reductase, glutaredoxin | −1.8, 1.3 | −1.8, 1.6 | −1.2, 1.7 | 3.0, 2.9 |
| lmo2478 (trxB) | Thioredoxin reductase | 3.4 | 1.3 | 3.9 | 4.7 | |
| lmo2484-lmo2487 | SigB | Unknown proteins (some with PspC domains) | 1.6, 1.7, 1.8, 1.5 | 1.7, 1.7, 1.4, −1.2 | 1.7, 1.7, −1.5, −1.1 | 5.6, 6.1, 4.8, 5.4 |
| lmo2488, lmo2489 (uvrAB) | DNA repair excinuclease | 1.3, 1.2 | 1.9, 1.5 | 2.6, −1.1 | 3.7, 4.6 | |
| lmo2504-lmo2508 | SigB | Murein hydrolases, cell division-associated proteins | 1.5, 1.8, 1.5, 1.9, 2.0 | 1.2, −1.1, 1.3, 1.1, 1.5 | 1.7, 1.0, 2.1, 1.7, −1.3 | 4.7, 2.4, 5.5, 2.1, 2.3 |
| lmo2522 | SigB, CodY | Unknown cell wall protein | −1.1 | −4.9 | −4.0 | 9.5 |
| lmo2528-lmo2536 | F-type ATPase (H+ pumping) | 1.4, 1.5, 1.5, 1.8, 2.3, 1.4, 1.6, 1.3, 1.3 | 1.3, 1.1, −1.4, −1.2, −1.1, −1.5, −1.5, −1.5, −1.3 | 1.2, 1.1, 1.0, 1.5, 1.7, −1.4, 1.2, −1.0, 1.1 | 2.1, 1.5, 1.4, 1.4, 1.1, −1.3, −1.1, −1.1, 1.3 | |
| lmo2720 (acs) | Acetyl-CoA synthetase | 1.1 | 1.1 | 2.3 | 2.6 | |
Fold change values in bold represent statistically significant increases in expression (P < 0.05 [FDR adjusted]). Fold change values that are underlined represent statistically significant decreases in expression (P < 0.05 [FDR adjusted]).
Responses of specific acid-stress-protective mechanisms to elevated SD levels.
Various acid-stress-related protective mechanisms in L. monocytogenes have been previously defined and investigated (14, 42, 55). Expression of genes for the GAD system (gadA and gadCB) and arginine deiminase (arcA) but not other designated genes of the ADI system (Table 3) exhibited upregulation in both strains when adapted to pH 5.0 BHI broths. The expression of various F1F0 ATPase-associated genes (locus tags lmo2528 to lmo2536) increased in strain EGD but not strain FW04/0025 when grown at pH 5.0 (Table 4). The differences in expression suggest that strain EGD is more vulnerable to the incursion of H+, leading to increased H+ extrusion to cope with acid stress. The F1F0 ATPase, GAD, and ADI systems, which protect the cell by means of different forms of H+ removal, were not further induced when high levels of SD were present. To date, a lack of relevance for defense against organic acid stress has been shown for the GAD system (27) but not for the other systems. Overall, the data suggest that EGD is more sensitive to H+ incursion but that cellular mechanisms or features other than biosynthesis of acetoin (see below) likely play indirect or direct protective roles that influence resistance to SD.
Effects of SD on intermediary metabolism as revealed by transcriptomic analysis.
Expression of genes coding the acetoin synthesis enzymes acetolactate synthase (alsS) and acetolactate decarboxylase (alsD) in both strains was elevated at pH 5.0 and by SD (Table 3). Acetoin synthesis tends to buffer against excessive accumulation of lactate and acetate by drawing down pyruvate generated during catabolism of carbohydrates (21) (Fig. 6). In addition to this response, the SigB-activated operon pdhABCD (lmo1052 to lmo1055), coding the pyruvate dehydrogenase complex (PDC), exhibited large increases in expression in strain FW04/0025 but smaller increases in expression in strain EGD, with SD also affecting the expression of the operon (Table 4 and Fig. 6). The PDC converts pyruvate to acetyl coenzyme A (acetyl-CoA) and is a key central metabolic enzyme that is very important for aciduric growth. Deletion of pdhA in Streptococcus mutans (33) resulted in a slow growing, poorly competitive phenotype in acidic conditions. The greater aciduricity of strain FW04/0025 could thus partly relate to efficient biomass generation under acidic conditions, since generation of acetyl-CoA is required in many cellular processes. Acetate is also generated from acetyl-CoA by conversion to acetyl phosphate (by phosphate acetyltransferase coded by pta) and then to acetate via acylphosphatase (lmo1381), the latter step generating ATP. Acetate can be consumed at the expense of ATP via acetate kinase (ackA); however, none of the aciduric strains studied here possess the ability to utilize acetate. At high SD levels, expression of pta and lmo1381 was enhanced (Table 3) whereas expression of ackA (lmo1581) was not altered in EGD and was repressed ∼2-fold in FW04/0025. The gene coding acetyl-CoA synthetase (acs) was also upregulated in FW04/0025 (Table 3) but not in EGD. This enzyme converts acetate directly to acetyl-CoA at the expense of ATP (Fig. 6). Control of excessive acetate accumulation within the cytoplasm thus could be conducted by conversion of acetyl phosphate and acetate to acetyl-CoA, limiting acetate formation and accumulation. The accumulation of acetyl phosphate in FW04/0025 is also suggested by enhancement of the VirR regulon (Table 2) in the presence of SD, as VirR has been shown to be stimulated by acetate in minimal medium, most probably through production of acetyl phosphate (40). However, in view of the inability of the strain to utilize acetate and its need for ATP, the ability of L. monocytogenes to directly metabolically draw down on its intracellular acetate pool appears to be restricted. Given that strain FW04/0025 maintains lower levels of intracellular levels of acetate than EGD, other processes may also be involved that hinder acetate anion accumulation. The existence of efflux transporters that could directly deal with acetate accumulation is possible, but the nature of the process is largely unknown for bacteria in general. An ABC-type transporter of the highly acetate-resistant species Acetobacter aceti has been identified, and its deletion reduces resistance to organic acids (45). This protein has homology to the Escherichia coli Uup protein. The expression of lmo1875, its closest homolog in EGD, was not altered under acidic conditions, though that of a paralog (lmo0919) was significantly enhanced by SD (Table 3). Various other efflux transporters (such as lmo0608 and lmo0872) were affected in a strain-dependent manner (Tables 3 and 4); however, these, along with lmo0919, have no known role at this time.
FIG. 6.

Metabolic pathway map indicating the steps of end product formation by L. monocytogenes (based on data from the KEGG database). End product compounds that may be formed during the growth of L. monocytogenes are indicated in boxes. Genes coding corresponding enzymes conducting biochemical transformation are indicated. Thick, black-arrowed lines indicate that the expression of gene(s) for the given enzymatic step was increased by SD treatment. Arrowed lines in gray indicate that the expression of gene(s) that was increased by SD treatment for the given enzymatic step was strain dependent (Table 4). The dashed line indicates an enzymatic process suppressed by SD treatment; thin lines indicate processes unaffected or only weakly affected by SD treatment. BCAA, branched-chain amino acids.
Influence of SD on the SigB regulon.
The master regulator SigB is required for L. monocytogenes to tolerate growth-preventing acid conditions and also to survive or grow under other stressful conditions (63). Comparisons of data for the test strains adapted to BHI acidified to pH 5.0 indicated the expected pattern of increased expression of the SigB-activated regulon (Table 2), with 31% of genes exhibiting significantly increased expression in strain FW04/0025 compared with 22% in strain EGD (data not shown). The changes in 414 measured SigB-influenced genes (26, 48) were quite similar in comparisons of the strains (r2 = 0.66) after adaptation to pH 5.0 BHI broth. SD also promotes the SigB-activated regulon to a similar extent (Table 2), though the responses with respect to which genes were affected in comparisons of FW04/0025 and EGD were much less similar (r2 = 0.30). A total of 12 SD-influenced SigB-activated genes (lmo0608, lmo0647, lmo0654, gabD, lmo0937, lmo0995, pdhB, lmo1291, lmo2219, lmo2386, lmo2454, and lmo2460) were upregulated in FW04/0025 but not in EGD; in addition, three genes of the SigB operon (rsbV-rsbW-sigB) also exhibited increased expression in strain FW04/0025 but not in strain EGD. Besides the SigB operon, these genes may be involved in efflux (lmo0608), peptidoglycan modification (lmo0995 and lmo1291), and central metabolism (gabD, pdhB, and lmo2460). Numerous other genes that SigB may influence are listed in Table 3 and Table 4. Whether proteins formed from these genes influence strain-dependent tolerance of acidic conditions or, more specifically, exposure to organic acids needs further investigation. There is a possibility the SigB regulon and its more indirect effects differ between strains. Adding the complication of potentially different physiological states results in the emergence of a complex picture revealing how SigB affects the cells under certain situations.
Effects of SD on expression of virulence determinants.
Transient acid shock induction of virulence-associated genes in L. monocytogenes in a strain-specific manner has been previously shown (47, 67). Overall, for the strains studied, the patterns of responses among genes strongly connected to virulence, especially in the presence of SD, were markedly different.
The genes most promoted by SD under growth-permissive conditions were those associated with general support of virulence (clpP and clpE), gastrointestinal tract survival (bsh), and intracellular survival (hyl, actA, plcB, and svpA) (Table 3). This trend was mainly observed with strain EGD; SD did not affect expression of the LIPI-1 cluster (lmo200 to lmo205) in strain FW04/0025. Most invasion-associated genes were suppressed. The responses are muted compared what is potentially possible at 37°C (30, 38), suggesting that the observed responses were relatively nonspecific and could have been a side effect of general increases in expression of the SigB and PrfA regulons.
Influence of SD on the CodY regulon and on branched-chain amino acid- and fatty acid-related gene expression.
The declines in expression of certain functionally related gene sets, including those controlling histidine biosynthesis (data not shown) and the biosynthesis-chemotaxis and phosphotransferase systems of flagella (Table 2), likely reflect a trend of cellular energy conservation that would be expected to occur under conditions of acidic stress. These systems are among those that require the most energy in the cell, and acidic conditions reduce the capacity to maintain ATP pools (43). Several genes in these sets are under direct regulation by the CodY repressor, a pleotrophic transcriptional repressor that is able to sense cellular GTP and possibly branched-chain amino acid levels (61) and appears to have a key role in regulating cell metabolism. According to the results of microarray and mutagenesis studies, CodY is an important regulator of carbon-nitrogen metabolism, flagella biosynthesis, and other cellular functions in L. monocytogenes (7). Strain EGD exhibits repression of its CodY regulon when grown at pH 5.0, while strain FW04/0025 exhibited levels of CodY repression that were more significant when SD was present (Table 2). One interesting side effect of the acidic conditions that could also be linked to CodY repression was the observed reduction in BCAA synthesis gene expression (ilvABCDH and leuABCD [expression reduced up to 16-fold]); this effect follows the aforementioned pattern of responses observed from T-profiling of the CodY regulon. The repression of BCAA synthesis could be a consequence of redirection of pyruvate and 2-acetolactate to acetoin production, as they are precursors required for BCAA synthesis (Fig. 6). SD also induced increased expression of the buk-pta-bkdA1A2-bkdB gene cluster (Table 4 and Fig. 6) that synthesizes the primer compounds needed for branched-chain fatty acid synthesis (68). This combination of responses seems to suggest that a compensatory response occurs that maintains branched-chain fatty acid synthesis. Increases in membrane fluidity as a result of higher anteiso- to iso-branched fatty acid ratios appear to be a response of L. monocytogenes to acidic conditions (24). The inhibitory response to organic acids has been shown to be enhanced by addition of inhibitors of fatty acid synthesis (19); however, it is unclear whether the inhibition results from accumulation of H+ or of organic acids or both.
Effect of SD on genes involved in oxidative stress management.
Acidic conditions are known to increase the abundance of reactive oxygen species (ROS) due to greater need for proton pumping (41). ROS can lead to the formation of toxic organic and inorganic peroxides from oxidation of cell components and to direct damage to DNA and lipids and inhibition of enzymatic processes. In L. monocytogenes, ROS and peroxides are dealt with by relatively conserved enzyme systems and antioxidants that are controlled, at least to an extent, by PerR and HtrA regulators (32, 50, 67). Here we found that the superoxide dismutase- and antioxidant-related genes gor, sodA, trxA, trxB, trxC, osmC, and lmo0669 (a predicted glutathionylspermidine synthase shown in reference 63 to be affected by acid stress) were all upregulated during growth at pH 5.0; for some of these, SD also promotes this expression (Table 3 and Table 4). Strain FW04/0025 increased expression of several other genes (lmo2424 to -2426, lmo0906, and lmo0983) putatively coding antioxidants, including glutathione-associated enzymes (Table 4). These data couple with the observation of an apparent induction of an SOS DNA repair response (as evidenced by increased lexA and recA expression; Table 3) that may be related to oxidative stress-related damage to DNA. Whether the variations between the strains contribute to a phenotype more tolerant to oxidative stress under acidic conditions deserves further investigation.
Strain-specific differences in genetic responses to SD.
SD-specific influenced gene expression responses, some of which are discussed above, were clearly observed in strains EGD and FW04/0025 (Table 4). With regard to EGD, one of the most substantial strain-dependent effects of acid stress was a large increase in the expression of the kdp operon (lmo2678 to -2682), which encodes a conserved high-affinity K+-uptake ATP-dependent system possessing its own two-component sensor system (3). This response corresponds to observations of K+ appearing to act as a counter-ion in acetate anion accumulation (Fig. 3). The expression data suggest that, at pH 5.0, iron (lmo0366 to -0367 and lmo2182 to -2186) and putative glutathione (lmo0136 to -0147) transporters are specifically invoked along with Tat-system protein secretion (lmo0361 to -0362) and sortase B (lmo2181), which occur adjacent to these transporter genes and thus may play a role in the establishment of the transporter systems. This has been suggested bioinformatically for lmo0367, which encodes an iron-dependent peroxidase that may play a role in oxidative stress defense (16).
Strain FW04/0025, on the other hand, exhibits a broader range of SD-influenced responses (Table 4). Many of the specific responses appear to be related to cell wall envelope biogenesis or modification involving the dlt operon (lmo0972 to -0974), which is involved in cell wall teichoic acid d-alanylation and murein hydrolysis (iap) and with peptidoglycan GlcNAc N-deacetylase PdgA (lmo0415) and putative SigB-activated O-acetyltransferases lmo0995 and lmo1291, which may act on peptidoglycan. The latter conjecture is suggested by the fact that lmo1291 is a homolog of the gene encoding the Staphylococcus aureus OatA protein (8). Expression of Sec-system protein secretion genes, cell division genes, and genes for cell-wall-associated unknown proteins (lmo2522) is also significantly increased (Table 4). Other apparent strain-dependent responses also relate to putative FeS cluster assembly genes (lmo0800, lmo2397, and lmo2411 to -2415), fatty acid biosynthesis (lmo2201 to -2202), regulation of iron uptake (fur), and, putatively, competence genes (lmo2054 to -2055). In addition, several unknown hypothetical proteins, some of which are secreted and/or membrane proteins, were observed to respond in a strain-dependent manner. In addition to other specific responses related to intermediary metabolism and oxidative stress that were observed in strain FW04/0025, the complement of strain-dependent upregulation may suggest that this strain has a more active response to the presence of SD, potentially altering its phenotype to gain protection from external SD and to deal more effectively with the consequences of acetate anion accumulation. Since acetate can be both hydrophilic (when ionized) and lipophilic (when unprotonated), chemical modifications that affect cell envelope electrochemical charge and packing density may affect acetate diffusion and accumulation. In FW04/0025, SD influences genes associated with teichoic acid and peptidoglycan modification. Increased cross-linking and modification of these polymers have been linked to lysozyme resistance in various Gram-positive and -negative bacteria and significantly contribute to the pathogenicity of L. monocytogenes, allowing it to evade host defenses (9). Deletion of dlt genes has been shown to result in an acid-sensitive phenotype (12) and/or in phenotypically poor host survival (1), and increased d-alanylation reduces the negative charge of the cell wall that provides resistance to charged molecules (35). It would be interesting to further elucidate whether cell wall modifications elicited by SD or other chemicals differentially affect growth and survival of L. monocytogenes strains.
Conclusions.
From this study it was determined that there could be a link between L. monocytogenes strain origin (and, to a lesser extent, genetic lineage) and organic acid resistance, in particular, in relation to SD and potassium sorbate. Further analyses of freshly isolated strains from different sources would be useful in further testing of these observations. In addition, it was found that a representative SD-resistant strain (FW04/0025) was able to consistently grow more rapidly and better tolerate a high H+ concentration (pH 2.4 [HCl]) than EGD, a strain with a comparatively average resistance to SD. This trend correlated with FW04/0025 accumulating less acetate and K+ in its cytoplasm. The reasons for this difference in phenotypes were investigated using microarray analysis, and the specific influence of SD on the transcriptome was determined. From these analyses it could be surmised that EGD is relatively reactive to the presence of mineral acid, suggesting greater permeativity with respect to H+. In comparison to strain EGD, however, strain FW04/0025, in the presence of elevated SD levels, more actively adjusts its cell wall structure, invokes oxidative stress management, and modulates its intermediary metabolism. Overall, it is possible that strain-specific differences arise as a consequence of different responses to acidity in the environment and demonstrate that L. monocytogenes strains differ considerably in their responses to organic acids at the strain level. Furthermore, these differences may highlight organic acid resistance as a phenotype relevant to the concept of persistence of L. monocytogenes in the food supply chain, given that acetate and lactate are end products of its metabolism and are also applied as preservatives in many foods. Further specific appraisals of the proteomes, cell wall chemistry, and metabolomes of organic-acid-resistant strains are required to elucidate specific aspects that comprise the SD resistance phenotype as well as to determine whether this phenotype extends to providing protection against other food preservatives and antilisterial chemical agents.
Supplementary Material
Acknowledgments
This research was supported by funding from the National Food Industry Strategy.
We thank Jeremy Carson (Department of Primary Industries, Parks, Water and Environment, Mount Pleasant Laboratories, Launceston, Tasmania), Agnes Tan (Microbiological Diagnostic Unit, Department of Microbiology and Immunology, University of Melbourne, Victoria, Australia), Claudio Bittencourt (Simplot Australia Pty. Ltd.), and John Holah (Campden & Chorleywood Food Research Association, Chipping Campden, Gloucestershire, United Kingdom) for many of the L. monocytogenes isolates studied here. We thank Stephen Wilcox and Melanie O'Keefe (AGRF Ltd.), who provided technical assistance in microarray analyses and Ann Koshy for microbiological assistance.
Footnotes
Published ahead of print on 28 May 2010.
Supplemental material for this article may be found at http://aem.asm.org/.
REFERENCES
- 1.Abachin, E., C. Poyart, E. Pellegrini, E. Milohanic, F. Fiedler, P. Berche, and P. Trieu-Cuot. 2002. Formation of D-alanyl-lipoteichoic acid is required for adhesion and virulence of Listeria monocytogenes. Mol. Microbiol. 43:1-14. [DOI] [PubMed] [Google Scholar]
- 2.Alonso-Hernando, A., C. Alonso-Calleja, and R. Capita. 2009. Comparative analysis of acid resistance in Listeria monocytogenes and Salmonella enterica strains before and after exposure to poultry decontaminants. Role of the glutamate decarboxylase (GAD) system. Food Microbiol. 26:905-909. [DOI] [PubMed] [Google Scholar]
- 3.Ballal, A., B. Basu, and S. K. Apte. 2007. The Kdp-ATPase system and its regulation. J. Biosci. 32:559-568. [DOI] [PubMed] [Google Scholar]
- 4.Baranyi, J., and T. A. Roberts. 1994. A dynamic approach to predicting bacterial growth in food. Int. J. Food Microbiol. 23:277-294. [DOI] [PubMed] [Google Scholar]
- 5.Barmpalia-Davis, I. M., I. Geornaras, P. A. Kendall, and J. N. Sofos. 2008. Differences in survival among 13 Listeria monocytogenes strains in a dynamic model of the stomach and small intestine. Appl. Environ. Microbiol. 74:5563-5567. [DOI] [PMC free article] [PubMed] [Google Scholar]
- 6.Benjamini, Y., and Y. Hochberg. 1995. Controlling the false discovery rate: a practical and powerful approach to multiple testing. J. R. Stat. Soc. Ser. B 57:289-300. [Google Scholar]
- 7.Bennett, H. J., D. M. Pearce, S. Glenn, C. M. Taylor, M. Kuhn, A. L. Sonenshein, P. W. Andrew, and I. S. Roberts. 2007. Characterization of relA and codY mutants of Listeria monocytogenes: identification of the CodY regulon and its role in virulence. Mol. Microbiol. 63:1453-1467. [DOI] [PubMed] [Google Scholar]
- 8.Bishop, J. L., E. C. Boyle, and B. B. Finlay. 2007. Deception point: peptidoglycan modification as a means of immune evasion. Proc. Natl. Acad. Sci. U. S. A. 104:691-692. [DOI] [PMC free article] [PubMed] [Google Scholar]
- 9.Boneca, I. G., O. Dussurget, D. Cabanes, M. A. Nahori, S. Sousa, M. Lecuit, E. Psylinakis, V. Bouriotis, J. P. Hugot, M. Giovannini, A. Coyle, J. Bertin, A. Namane, J. C. Rousselle, N Cayet, M. C. Prévost, V. Balloy, M. Chignard, D. J. Philpott, P. Cossart, and S. E. Girardin. 2007. A critical role for peptidoglycan N-deacetylation in Listeria evasion from the host innate immune system. Proc. Natl. Acad. Sci. U. S. A. 104:997-1002. [DOI] [PMC free article] [PubMed] [Google Scholar]
- 10.Boorsma, A., B. C. Foat, D. Vis, F. Klis, and H. J. Bussemaker. 2005. T-profiler: scoring the activity of predefined groups of genes using gene expression data. Nucleic Acids Res. 33:W592-W595. [DOI] [PMC free article] [PubMed] [Google Scholar]
- 11.Bowman, J. P., C. R. Bittencourt, and T. Ross. 2008. Differential gene expression of Listeria monocytogenes during high hydrostatic pressure processing. Microbiology 154:462-475. [DOI] [PubMed] [Google Scholar]
- 12.Boyd, D. A., D. G. Cvitkovitch, A. S. Bleiweis, M. Y. Kiriukhin, D. V. Debabov, F. C. Neuhaus, and I. R. Hamilton. 2000. Defects in D-alanyl-lipoteichoic acid synthesis in Streptococcus mutans results in acid sensitivity. J. Bacteriol. 182:6055-6065. [DOI] [PMC free article] [PubMed] [Google Scholar]
- 13.Chaturongakul, S., S. Raengpradub, M. Wiedmann, and K. J. Boor. 2008. Modulation of stress and virulence in Listeria monocytogenes. Trends Microbiol. 16:388-396. [DOI] [PMC free article] [PubMed] [Google Scholar]
- 14.Cotter, P. D., C. G. M. Gahan, and C. Hill. 2001. A glutamate decarboxylase system protects Listeria monocytogenes in gastric fluid. Mol. Microbiol. 40:465-475. [DOI] [PubMed] [Google Scholar]
- 15.Diez-Gonzalez, F., and J. B. Russell. 1997. The ability of Escherichia coli 0157:H7 to decrease its intracellular pH and resist the toxicity of acetic acid. Microbiology 143:175-180. [DOI] [PubMed] [Google Scholar]
- 16.Dilks, K., R. W. Rose, E. Hartmann, and M. Pohlschröder. 2003. Prokaryotic utilization of the twin-arginine translocation pathway: a genomic survey. J. Bacteriol. 185:1478-1483. [DOI] [PMC free article] [PubMed] [Google Scholar]
- 17.Doumith, M., C. Cazalet, N. Simoes, L. Frangeul, C. Jacquet, F. Kunst, P. Martin, P. Cossart, P. Glaser, and C. Buchrieser. 2004. New aspects regarding evolution and virulence of Listeria monocytogenes revealed by comparative genomics and DNA arrays. Infect. Immun. 72:1072-1083. [DOI] [PMC free article] [PubMed] [Google Scholar]
- 18.Ferreira, A., D. Sue, C. P. O'Byrne, and K. J. Boor. 2003. Role of Listeria monocytogenes sigma(B) in survival of lethal acidic conditions and in the acquired acid tolerance response. Appl. Environ. Microbiol. 69:2692-2698. [DOI] [PMC free article] [PubMed] [Google Scholar]
- 19.Fozo, E. M., and R. G. Quivey. 2004. The fabM gene product of Streptococcus mutans is responsible for the synthesis of monounsaturated fatty acids and is necessary for survival at low pH. J. Bacteriol. 186:4152-4158. [DOI] [PMC free article] [PubMed] [Google Scholar]
- 20.Francis, G. A., and D. O'Beirne. 2005. Variation among strains of Listeria monocytogenes: differences in survival on packaged vegetables and in response to heat and acid conditions. Food Control 16:687-694. [Google Scholar]
- 21.García-Quintáns, N., G. Repizo, M. Martín, C. Magni, and P. López. 2008. Activation of the diacetyl/acetoin pathway in Lactococcus lactis subsp. lactis bv. diacetylactis crl264 by acidic growth. Appl. Environ. Microbiol. 74:1988-1996. [DOI] [PMC free article] [PubMed] [Google Scholar]
- 22.Garner, M. R., K. E. James, M. C. Callahan, M. Wiedmann, and K. J. Boor. 2006. Exposure to salt and organic acids increases the ability of Listeria monocytogenes to invade Caco-2 cells but decreases its ability to survive gastric stress. Appl. Environ. Microbiol. 72:5384-5395. [DOI] [PMC free article] [PubMed] [Google Scholar]
- 23.Gilbreth, S. E., J. E. Call, F. M. Wallace, V. N. Scott, Y. Chen, and J. B. Luchansky. 2005. Relatedness of Listeria monocytogenes isolates recovered from selected ready-to-eat foods and listeriosis patients in the United States. Appl. Environ. Microbiol. 71:8115-8122. [DOI] [PMC free article] [PubMed] [Google Scholar]
- 24.Giotis, E. S., D. A. McDowell, I. S. Blair, and B. J. Wilkinson. 2007. Role of branched-chain fatty acids in pH stress tolerance in Listeria monocytogenes. Appl. Environ. Microbiol. 73:997-1001. [DOI] [PMC free article] [PubMed] [Google Scholar]
- 25.Glass, K. A., D. A. Granberg, A. L. Smith, A. M. McNamara, M. Hardin, J. Mattias, K. Ladwig, and E. A. Johnson. 2002. Inhibition of Listeria monocytogenes by sodium diacetate and sodium lactate on wieners and cooked bratwurst. J. Food Prot. 65:116-123. [DOI] [PubMed] [Google Scholar]
- 26.Hain, T., H. Hossain, S. S. Chatterjee, S. Machata, U. Volk, S. Wagner, B. Brors, S. Haas, C. T. Kuenne, A. Billion, S. Otten, J. Pane-Farre, S. Engelmann, and T. Chakraborty. 2008. Temporal transcriptomic analysis of the Listeria monocytogenes EGD-e sigma(B) regulon. BMC Microbiol. 8:e20. [DOI] [PMC free article] [PubMed] [Google Scholar]
- 27.Heavin, S. B., O. M. Brennan, J. P. Morrissey, and C. P. O'Byrne. 2009. Inhibition of Listeria monocytogenes by acetate, benzoate and sorbate: weak acid tolerance is not influenced by the glutamate decarboxylase system. Lett. Appl. Microbiol. 49:179-185. [DOI] [PubMed] [Google Scholar]
- 28.Hu, Y., H. F. Oliver, S. Raengpradub, M. E. Palmer, R. H. Orsi, M. Wiedmann, and K. J. Boor. 2007. Transcriptomic and phenotypic analyses suggest a network between the transcriptional regulators HrcA and sigma B in Listeria monocytogenes. Appl. Environ. Microbiol. 73:7981-7991. [DOI] [PMC free article] [PubMed] [Google Scholar]
- 29.Hu, Y., S. Raengpradub, U. Schwab, C. Loss, R. H. Orsi, M. Wiedmann, and K. J. Boor. 2007. Phenotypic and transcriptomic analyses demonstrate interactions between the transcriptional regulators CtsR and sigma B in Listeria monocytogenes. Appl. Environ. Microbiol. 73:7967-7980. [DOI] [PMC free article] [PubMed] [Google Scholar]
- 30.Johansson, J., P. Mandin, A. Renzoni, C. Chiaruttini, M. Springer, and P. Cossart. 2002. An RNA thermosensor controls expression of virulence genes in Listeria monocytogenes. Cell 110:551-561. [DOI] [PubMed] [Google Scholar]
- 31.Kakinuma, Y. 1998. Inorganic cation transport and energy transduction in Enterococcus hirae and other streptococci. Microbiol. Mol. Biol. Rev. 62:1021-1045. [DOI] [PMC free article] [PubMed] [Google Scholar]
- 32.Kim, K. P., B. K. Hahm, and A. K. Bhunia. 2007. The 2-Cys peroxiredoxin-deficient Listeria monocytogenes displays impaired growth and survival in the presence of hydrogen peroxide in vitro but not in mouse organs. Curr. Microbiol. 54:382-387. [DOI] [PubMed] [Google Scholar]
- 33.Korithoski, B., C. M. Lévesque, and D. G. Cvitkovitch. 2008. The involvement of the pyruvate dehydrogenase E1α subunit, in Streptococcus mutans acid tolerance. FEMS Microbiol. Lett. 289:13-19. [DOI] [PubMed] [Google Scholar]
- 34.Kort, R., B. J. Keijser, M. P. M. Caspers, F. H. Schuren, and R. Montijn. 2008. Transcriptional activity around bacterial cell death reveals molecular biomarkers for cell viability. BMC Genomics 9:e590. [DOI] [PMC free article] [PubMed] [Google Scholar]
- 35.Kovács, M., A. Halfmann, I. Fedtke, M. Heintz, A. Peschel, V. Waldemar, R. Hakenbeck, and R. Brückner. 2006. A functional dlt operon, encoding proteins required for incorporation of D-alanine in teichoic acids in Gram-positive bacteria, confers resistance to cationic antimicrobial peptides in Streptococcus pneumoniae. J. Bacteriol. 188:5797-5805. [DOI] [PMC free article] [PubMed] [Google Scholar]
- 36.Lianou, A., J. D. Stopforth, Y. Yoon, M. Wiedmann, and J. N. Sofos. 2006. Growth and stress resistance variation in culture broth among Listeria monocytogenes strains of various serotypes and origins. J. Food Prot. 69:2640-2647. [DOI] [PubMed] [Google Scholar]
- 37.Livak, K. J., and T. D. Schmittgen. 2001. Analysis of relative gene expression data using real-time quantitative PCR and the (2-Delta Delta C(T)) method. Methods 25:402-408. [DOI] [PubMed] [Google Scholar]
- 38.Loh, E., O. Dussurget, J. Gripenland, K. Vaitkevicius, T. Tiensuu, P. Mandin, F. Repoila, C. Buchrieser, P. Cossart, and J. Johansson. 2009. A trans-acting riboswitch controls expression of the virulence regulator PrfA in Listeria monocytogenes. Cell 139:770-779. [DOI] [PubMed] [Google Scholar]
- 39.Lundén, J., R. Tolvanen, and H. Korkeala. 2008. Acid and heat tolerance of persistent and nonpersistent Listeria monocytogenes food plant strains. Lett. Appl. Microbiol. 46:276-280. [DOI] [PubMed] [Google Scholar]
- 40.Mandin, P., H. Fsihi, O. Dussurget, M. Vergassola, E. Milohanic, A. Toledo-Arana, I. Lasa, J. Johansson, and P. Cossart. 2005. VirR, a response regulator critical for Listeria monocytogenes virulence. Mol. Microbiol. 57:1367-1380. [DOI] [PubMed] [Google Scholar]
- 41.Maurer, L. M., E. Yohannes, S. S. Bondurant, M. Radmacher, and J. L. Slonczewski. 2005. pH regulates genes for flagellar motility, catabolism, and oxidative stress in Escherichia coli K-12. J. Bacteriol. 187:304-319. [DOI] [PMC free article] [PubMed] [Google Scholar]
- 42.McEntire, J. C., G. M. Carman, and T. J. Montville. 2004. Increased ATPase activity is responsible for acid sensitivity of nisin-resistant Listeria monocytogenes ATCC 700302. Appl. Environ. Microbiol. 70:2717-2721. [DOI] [PMC free article] [PubMed] [Google Scholar]
- 43.Milner, M. G., J. R. Saunders, and A. J. McCarthy. 2001. Relationship between nucleic acid ratios and growth in Listeria monocytogenes. Microbiology 147:2689-2696. [DOI] [PubMed] [Google Scholar]
- 44.Milohanic, E., P. Glaser, J. Y. Coppee, L. Frangeul, Y. Vega, J. A. Vazquez-Boland, F. Kunst, P. Cossart, and C. Buchrieser. 2003. Transcriptome analysis of Listeria monocytogenes identifies three groups of genes differently regulated by PrfA. Mol. Microbiol. 47:1613-1625. [DOI] [PubMed] [Google Scholar]
- 45.Nakano, S., M. Fukaya, and S. Horinouchi. 2006. Putative ABC transporter responsible for acetic acid resistance in Acetobacter aceti. Appl. Environ. Microbiol. 72:497-505. [DOI] [PMC free article] [PubMed] [Google Scholar]
- 46.O'Driscoll, B., C. G. Gahan, and C. Hill. 1996. Adaptive acid tolerance response in Listeria monocytogenes: isolation of an acid-tolerant mutant which demonstrates increased virulence. Appl. Environ. Microbiol. 62:1693-1698. [DOI] [PMC free article] [PubMed] [Google Scholar]
- 47.Olesen, I., F. K. Vogensen, and L. Jespersen. 2009. Gene transcription and virulence potential of Listeria monocytogenes strains after exposure to acidic and NaCl stress. Foodborne Pathog. Dis. 6:669-680. [DOI] [PubMed] [Google Scholar]
- 48.Raengpradub, S., M. Wiedmann, and K. J. Boor. 2008. Comparative analysis of the sigma(B)-dependent stress responses in Listeria monocytogenes and Listeria innocua strains exposed to selected stress conditions. Appl. Environ. Microbiol. 74:158-171. [DOI] [PMC free article] [PubMed] [Google Scholar]
- 49.Ramalheira, R., M. Almeida, J. Azeredo, T. R. S. Brandão, G. Almeida, J. Silva, and P. Teixeira. 2009. Survival of Listeria monocytogenes in a simulated dynamic gastrointestinal model during storage of inoculated bologna and salami slices in vacuum packages Foodborne Path. Dis. doi: 10.1089/fpd.2009.0319. [DOI] [PubMed]
- 50.Rea, R., C. Hill, and C. G. M. Gahan. 2005. Listeria monocytogenes PerR mutants display a small-colony phenotype, increased sensitivity to hydrogen peroxide, and significantly reduced murine virulence. Appl. Environ. Microbiol. 71:8314-8322. [DOI] [PMC free article] [PubMed] [Google Scholar]
- 51.Riebeling, V., R. K. Thauer, and K. Jungermann. 1975. The internal-alkaline pH gradient, sensitive to uncoupler and ATPase inhibitor, in growing Clostridium pasteurianum. Eur. J. Biochem. 55:445-453. [DOI] [PubMed] [Google Scholar]
- 52.Ritz, M., J. L. Tholozan, M. Federighi, and M. F. Pilet. 2001. Morphological and physiological characterization of Listeria monocytogenes subjected to high hydrostatic pressure. Appl. Environ. Microbiol. 67:2240-2247. [DOI] [PMC free article] [PubMed] [Google Scholar]
- 53.Romick, T. L., and H. P. Fleming. 1998. Acetoin production as an indicator of growth and metabolic inhibition of Listeria monocytogenes. J. Appl. Microbiol. 84:18-24. [DOI] [PubMed] [Google Scholar]
- 54.Russell, J. B. 1992. Another explanation for the toxicity of fermentation acids at low pH: anion accumulation versus uncoupling. J. Appl. Bacteriol. 73:363-370. [Google Scholar]
- 55.Ryan, S., M. Begley, C. G. M. Gahan, and C. Hill. 2009. Molecular characterization of the arginine deiminase system in Listeria monocytogenes: regulation and role in acid tolerance. Environ. Microbiol. 11:432-445. [DOI] [PubMed] [Google Scholar]
- 56.Samelis, J., J. S. Ikeda, and J. N. Sofos. 2003. Evaluation of the pH-dependent, stationary-phase acid tolerance in Listeria monocytogenes and Salmonella Typhimurium DT104 induced by culturing in media with 1% glucose: a comparative study with Escherichia coli O157: H7. J. Appl. Microbiol. 95:563-575. [DOI] [PubMed] [Google Scholar]
- 57.Severino, P., O. Dussurget, R. Z. N. Vêncio, E. Duman, P. Garrido, G. Padilla, P. Piveteau, J. P. Lemaître, F. Kunst, P. Glaser, and C. Buchrieser. 2007. Comparative transcriptome analysis of Listeria monocytogenes strains of the two major lineages reveals differences in virulence, cell wall, and stress response. Appl. Environ. Microbiol. 73:6078-6088. [DOI] [PMC free article] [PubMed] [Google Scholar]
- 58.Shabala, L., J. Bowman, J. Brown, T. Ross, T. A. McMeekin, and S. Shabala. 2009. Ion transport and osmotic adjustment in Escherichia coli in response to ionic and non-ionic osmotica. Environ. Microbiol. 11:137-148. [DOI] [PubMed] [Google Scholar]
- 59.Shabala, L., T. McMeekin, B. B. Budde, and H. Siegumfeldt. 2006. Listeria innocua and Lactobacillus delbrueckii subsp. bulgaricus employ different strategies to cope with acid stress. Int. J. Food Microbiol. 110:1-7. [DOI] [PubMed] [Google Scholar]
- 60.Shelef, L. A., and L. Addala. 1994. Inhibition of Listeria monocytogenes and other bacteria by sodium diacetate. J. Food Saf. 14:103-115. [Google Scholar]
- 61.Sonenshein, A. L. 2005. CodY, a global regulator of stationary phase and virulence in Gram-positive bacteria. Curr. Opin. Microbiol. 8:203-207. [DOI] [PubMed] [Google Scholar]
- 62.Stopforth, J. D., Y. Yoon, I. M. Barmpalia, J. Samelis, P. N. Skandamis, and J. N. Sofos. 2005. Reduction of Listeria monocytogenes populations during exposure to a simulated gastric fluid following storage of inoculated frankfurters formulated and treated with preservatives. Int. J. Food Microbiol. 99:309-319. [DOI] [PubMed] [Google Scholar]
- 63.Sue, D., D. Fink, M. Wiedmann, and K. J. Boor. 2004. σB-dependent gene induction and expression in Listeria monocytogenes during osmotic and acid stress conditions simulating the intestinal environment. Microbiology 150:3843-3855. [DOI] [PubMed] [Google Scholar]
- 64.Ter Beek, A., B. J. F. Kaijser, A. Boorsma, A. Zakrzewska, R. Orij, G. J. Smits, and S. Brul. 2008. Transcriptome analysis of sorbic acid-stressed Bacillus subtilis reveals a nutrient limitation response and indicates plasma membrane remodeling. J. Bacteriol. 190:1751-1761. [DOI] [PMC free article] [PubMed] [Google Scholar]
- 65.Untergasser, A., H. Nijveen, X. Rao, T. Bisseling, R. Geurts, and J. A. M. Leunissen. 2007. Primer3Plus, an enhanced web interface to Primer3. Nucleic Acids Res. 35:W71-W74. [DOI] [PMC free article] [PubMed] [Google Scholar]
- 66.Werbrouck, H., A. Vermeulen, E. Van Coillie, W. Messens, L. Herman, F. Devlieghere, and M. Uyttendaele. 2009. Influence of acid stress on survival, expression of virulence genes and invasion capacity into Caco-2 cells of Listeria monocytogenes strains of different origins. Int. J. Food Microbiol. 134:140-146. [DOI] [PubMed] [Google Scholar]
- 67.Wonderling, L. D., B. J. Wilkinson, and D. O. Bayles. 2004. The htrA (degP) gene of Listeria monocytogenes 10403S is essential for optimal growth under stress conditions. Appl. Environ. Microbiol. 70:1935-1943. [DOI] [PMC free article] [PubMed] [Google Scholar]
- 68.Zhu, K., X. Ding, M. Julotok, and B. J. Wilkinson. 2005. Exogenous isoleucine and fatty acid shortening ensure the high content of anteiso-C15:0 fatty acid required for low-temperature growth of Listeria monocytogenes. Appl. Environ. Microbiol. 71:8002-8007. [DOI] [PMC free article] [PubMed] [Google Scholar]
Associated Data
This section collects any data citations, data availability statements, or supplementary materials included in this article.