Abstract
The aim of this study was to investigate the effect and the mechanism of gamma linolenic acid (GLA) treatment on human hepatocellular (HCC) cell lines. The human HCC cell line HuH7 was exposed to GLA. Cell proliferation and reactive oxygen species (ROS) generation including lipid peroxidation and apoptosis were compared. We then used a cDNA microarray analysis to investigate the molecular changes induced by GLA. GLA treatment significantly reduced cell proliferation, generated ROS, and induced apoptosis. After 24 h exposure of Huh7 cells to GLA, we identified several genes encoding the antioxidant proteins to be upregulated: heme oxygenase-1 (HO-1), aldo-keto reductase 1 family C1 (AKR1C1), C4 (AKR1C4), and thioredoxin (Trx). The HO-1 protein levels were overexpressed in Huh7 cells after GLA exposure using a Western blot analysis. Furthermore, chromium mesoporphyrin (CrMP), an inhibitor of HO activity, significantly potentiated GLA cytotoxicity. GLA treatment has induced cell growth inhibition, ROS generation including lipid peroxidation, and HO-1 production for antioxidant protection against oxidative stress caused by GLA in Huh7 cells. GLA treatment should be considered as a therapeutic modality in patients with advanced HCC.
Keywords: gamma linolenic acid, hepatocellular carcinoma, oxidant stress, heme oxygenase-1
Introduction
Since the late 1980s, it has been established that certain polyunsaturated fatty acids (PUFAs) selectively kill tumor cells without harming the normal cells [1]. Gamma linolenic acid (GLA; 18:3 n-6), a member of the n-6 family of PUFAs found in evening primrose and borage oils, is the most proming PUFA in the treatment of human tumors. Intravenous and oral treatments with GLA have achieved tumor responses in a number of solid malignancies [2, 3]. The cytotoxic action of GLA has been thought to be mediated predominantly via lipid peroxidation and free radical generation [1, 4]. In human glioma, GLA have been shown to have selective antitumor action in vitro and in vivo, and limited open label clinical studies have shown that intratumoral injection of GLA induced significantly reduction of glioma without any significant side effects [5, 6]. It has been reported previously that the exogenous GLA suppressed cell proliferation of hepatocellular carcinoma (HCC) cell lines [7]. However, the cellular and molecular mechanisms by which GLA reduce the growth of HCC cells remain poorly understood.
Development of cDNA microarray technology has facilitated analysis of genome-wide expression profiles that can generate a large body of information concerning genetic networks related to response to various drugs and to identify genes involved in pathological conditions. Thus, the cDNA microarray is a promising method for identifying genes associated with sensitivity of tumors to various anticancer drugs using amplified RNA extracted from a very small piece of samples [8, 9].
In the present study, we investigated the effects of GLA on cell proliferation, free radical generation, and cytotoxity in HCC cells in vitro, and the comprehensive analyses on gene regulation using cDNA microarray technology in response to GLA exposure.
Materials and Methods
Cell culture
Human HCC cell line, Huh7 (Riken Cell Bank, Japan) were maintained in Dulbecco modified Eagle’s medium (DMEM) (Life Technologies, Inc., Grand Island, NY) supplemented with 10% fetal bovine serum (FBS) (JRH Biosciences, Australia) and 500 units/ml penicillin, and 500 µg/ml streptomycin (Life Technologies, Inc.). All cells were maintained at 37°C in 5% CO2.
The cells were exposed to GLA (Sigma, St. Louis, MO) at a final concentration of 0–250 µM for up to 72 h following the manufacturer’s protocol. Cell concentrations were determined by counting nuclei in each of 3 dishes on culture using a hemocytometer, according the method of van Wezel [10]. This experiment repeated three times.
Intracellular measurement of reactive oxygen species
The measurement of intracellular reactive oxygen species (ROS) was determined using Dichlorofluorescein diacetate (DCF-DA) assay, according to previous method [11]. Cells were incubated with DCF-DA (final concentration 100 µM) at 37°C for 30 min. After the cells in each well were washed twice PBS, they were collected in a microcentrifuge. The emission DCF fluorescence intensity in each sample was taken at 520 nm using an excitation wavelength of 488 nm.
Lipid peroxidation measurement
Malondialdehyde (MDA), formed from breakdown of polyunsaturated fatty acids, was used as a convenient index for determining the extent of lipid peroxidation reactions [12]. After exposure to 250 µM GLA for 24 h, the cells were scraped in PBS containing 0.5 mM Trolox. The pellets were collected by centrifugation and resuspended in PBS. An aliquot of the cell suspension was incubated with thiobarbituric acid (TBA)-HCl reagent with 0.5 mM Trolox for 15 min at 100°C. After centrifugation, the absorbance of the supernatant was measured at 535 nm. An extinction coefficient of 1.56 × 10⁵ M−1 cm−1 was used to calculate the amount of MDA produced.
Mitochondrial membrane potential analysis
Changes in the integrity of the plasma membrane and in the mitochondrial membrane potential were examined by monitoring the cells after double staining with propidium iodide (PI) and rhodamine 123 (Rh123), as previously described method [13]. Cells were incubated with medium containing 10 µg/ml Rh123 at 37°C for 30 min. Cells were harvested by trypsinization, and resuspended in 1 ml of PBS containing 5 µg of PI. The intensity of fluorescence from PI and from Rh123 was analyzed by flowcytometry.
Cell viability assays
To assess the viability of cells, the 2-(2-methoxy-4-nitrophenyl)-3-(4-nitrophenyl)-5-(2,4-disulphophenyl)-2H-tetrazolium monosodium salt assay (WST-8 assay) was performed [14] according to the manufacture’s protocols (Cell Count Kit-8; Dojin, Japan). α-tocopherol (Vitamin E) was from Sigma (St. Louis, MO). Chromium mesoporphyrin (CrMP) was form Porphyrin Products Inc. (Logan, UT). The absorbance of each well was measured at 450 nm with a microtiter plate reader. Cell viability was calculated as the ratio of treated cells to untreated cells.
Apoptosis analysis
To assess the apoptosis of cells, staining of nuclear DNA in apoptosis cells with Hoechst 33258 (Sigma, St. Louis, MO) was performed according to previous method [15]. Control and 250 µM GLA treated Huh7 cells for 24 h were harvested and fixed with 4% paraformaldehyde in phosphate buffered saline at 4°C for 30 min. After rinsing with saline, the nuclear DNAs were stained with 1 µM Hoechst 33258 fluorescent dye for 5 min at room temperature and observed with a fluorescent microscope. Apoptotic cells were identified on the basis of the presence of fragmented nuclei.
cDNA microarray analysis
According to previous method [11], Human 1 cDNA Microarray Kit (Agilent Technologies, Palo Alto, CA) spotted 12,814 genes was used to analyze the different gene expression in the untreated Huh7 cells and 250 µM GLA treated for 24 h Huh7 cells. Total RNA was extracted from the cells using RNeasy mini kit (Qiagen, Valencia, CA) according to the manufacture’s protocol. The quality of RNA was assessed by running aliquots on agarose gels. Twenty micrograms of RNA were reversetranscribed for 1 h at 42°C with Cyanine 3-dUTP or Cyanine 5-dUTP using Fluorescent Direct Labeling cDNA Synthesis Kit (Agilent Technologies). Hybridization experiments were carried out as a dye-swapped pair; i.e., hybridization to one microarray with sample X labeled with cyanine 3 and sample Y labeled with cyanine 5, and to second microarray with sample X labeled with cyanine 5 and sample Y labeled with cyanine 3. Averaging the expression measurements obtained from the 2 dye-swapped hybridization should have minimized the impact of any dye-specific biases, enabling an accurate measurement of the differential expression levels. A cyanine3-/cyanine 5-labeled cDNA sample was resuspended in 7.5 µl of nuclease-free water. Cot-1 DNA was added in this cDNA sample for minimizing background fluorescence and incubates 98°C for 2 min to denature cDNA. After the sample was pipetted onto each microarray, the slide is placed in a hybridization chamber and incubated at 65°C for 17 h. After incubation at 65°C, the slide was washed with wash solution 1 (0.5× SSC, 0.01% SDS) and wash solution 2 (0.06× SSC) and centrifuged to dry. The intensity of each hybridization signal was scanned in both Cy 3 and Cy 5 channels with Scan Array 4000 (GSI Lumonics, Billerica, MA) with a 10 µm resolution. The signal was converted into 16-bits-per-pixel resolution, yielding a 65,536-count dynamic range. A Quant Array soft (GSI Lumonics) was used for image analysis. The elements were determined by a gridding and region-detection algorithm. The area surrounding each element image was used to calculate a local background, which was subtracted from the total element signal. Background-subtracted element signals were used to calculate Cy3:Cy5 ratios. The Cy3:Cy5 ratio for each sample was calculated by global normalization.
Quantitative real-time reverse transcription-PCR
Total RNA was extracted from the cells using RNeasy mini kit (Qiagen) according to the manufacture’s instructions. Synthesis of cDNA was done with 4 µg of total RNA using a First-Strand cDNA Synthesis Kit (Amersham Pharmacia Biotech, Buckinghamshire, United Kingdom). Real-time quantitative PCR was performed in the ABI Prism 7700 Sequence Detection System (PE Applied Biosystems, Foster City, CA) using SYBR Premix Ex Taq (TaKaRa Bio, Inc.). The amplification conditions of 40 cycles consisted of initial denaturation at 95°C for 10 s, denaturation at 95°C for 5 s, and annealing/extension at 60°C for 30 s. β-actin was coamplified as an internal control to normalized for variable amounts of cDNA in each sample. Results were collected and analyzed to determine the PCR cycle number that generated the first fluorescence signal above a threshold (threhold cycle, CT; 10 SDs above the mean fluorescence generated during the baseline cycles), after which a comparative CT method was used to measure relative gene expression, according to previously described method [16]. The following formula was used to calculate the relative amount of the transcript of interest in the treated sample (X) and the control sample (Y), both of which were normalized to an endogenous reference value (β-actin): 2−ΔΔCT, where ΔCT is the difference in CT between the gene of interest and β-actin, with the ΔΔCT for sample X = ΔCT(X) − ΔCT(Y). The oligonucleotide sequences are listed in Table 1.
Table 1.
Oligonucleotide sequences used for quantitative real-time PCR
| Oligonucleotide sequence (5'-3') | |
| PCNA FP | ATCATTACACTAAGGGCCGAAGATAAC |
| PCNA RP | TCATTTCATAGTCTGAAACTTTCTCCTG |
| Skp2 FP | GCTGCTAAAGGTCTCTGGTGT |
| Skp2 RP | AGGCTTAGATTCTGCAACTTG |
| Thioredoxin FP | TCCAATGTGGTGTTCCTTGA |
| Thioredoxin RP | TAGTGGCTTCGAGCTTTTCC |
| Thioredoxin reductase 1 FP | CTTGTGGCCTTTCTGAGGAG |
| Thioredoxin reductase 1 RP | AGCCAGTGGTTTGCAGTCTT |
| Aldo-keto reductase family 1, member C1 FP | CCTAAAAGTAAAGCTTTAGAGGCCACC |
| Aldo-keto reductase family 1, member C1 RP | GAAAATGAATAAGGTAGAGGTCAACATAAT |
| Aldo-keto reductase family 1, member C4 FP | CGAGGAACAGAGCTGTAGAGGTCAC |
| Aldo-keto reductase family 1, member C4 RP | GAGAGCCATTGGGAAATGAAGA |
| Trefoil factor 3 FP | AATGCACCTTCTGAGGCACCT |
| Trefoil factor 3 RP | CGTTAAGACATCAGGCTCCAGAT |
| Matrix metalloproteinase 11 FP | AGATCTACTTCTTCCGAGGC |
| Matrix metalloproteinase 11 RP | TTCCAGAGCCTTCACCTTCA |
FP: forward primer, RP: reverse primer.
Western blot analysis
According to previously method [17], an equal amount of cell lysate was separated by 10% SDS-PAGE, followed by immunoblotting on a polyvinylidine difluoride membrane (Invitrogen, Co., CA). Proteins were visualized using enhanced chemiluminescence detection system (Amersham Pharmacia Biotech) after incubation overnight with the following primary antibodies: human HO-1 (rabbit polyclonal H-105) from Santa Cruz Biotechnology (Santa Cruz, CA).
Statistical analysis
Statistical significance was determined by the Mann-Whitney U test. All statistical differences were deemed significant at the level of p<0.05.
Results
GLA inhibits growth of Huh7 cells
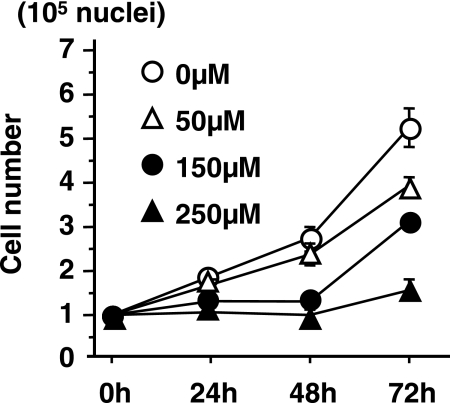
Huh7 cells were exposed to different concentrations of GLA (0, 50, 150 and 250 µM) for 72 h. The effects of GLA on the growth of HCC cells were then determined by cell counts at 24, 48 and 72 h. The proliferation of HCC cells were suppressed by GLA in a dose dependent manner (Fig. 1). At 500 µM GLA, cell growth inhibition was more pronounced but cells were mostly (at 48 h) to totally (at 72 h and all subsequent time points) detached and became smaller and round. For the experiments described in the following sections, a concentration of GLA of 250 µM was used. No cytotoxicity of primary cultured hepatocytes from rat liver was observed in this concentration (data not shown).
Fig. 1.
Effect of GLA on cell proliferation. Cells were incubated for 24, 48 and 72 h in the presence of 0, 50, 150 and 250 µM GLA.
GLA induces intracellular ROS generation and lipid peroxidation
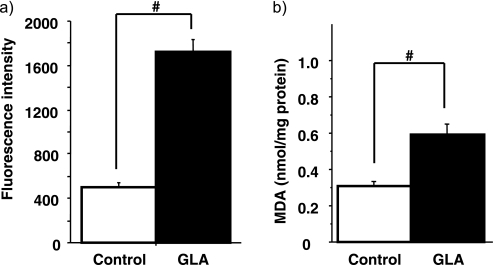
Experiments were designed to investigate whether GLA induced intracellular ROS generation in HCC cells. The intracellular ROS was measured in Huh7 cells by DCF-DA assay (Fig. 2a). The ROS levels were increased 3.4-fold by 3 h exposure to GLA compared to the control (p<0.05).
Fig. 2.
GLA induced ROS generaion and lipid peroxidation in Huh7 cells. Huh7 cells were untreated (Control) or 250 µM GLA (GLA) for 3 h (a) or 24 h (b). (a) ROS was determined by flow cytometry analysis with DCF-DA. (b) lipid peroxidation was determinrd by TBA-reactive assay. #p<0.01.
Lipid peroxidation of Huh7 cells was also assessed by measuring production of the lipid peroxidation end product MDA by the TBA-reactive assay. As showed in Fig. 2b, a significant increase was observed in the GLA exposed cells, compared to the control cells (p<0.01).
Effect of GLA on mitochondrial membrane and the integrity of the plasma membrane
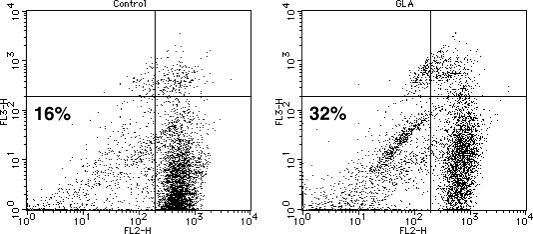
Since the ROS can lead to damage of mitochondria, we assessed mitochondrial membrane potential by flow cytometry after double staining with Rh123 and PI. Rh123 is selectively taken up by mitochondria, directly proportional to mitochondria membrane potential. PI is imported into cells and binds to cellular DNA when the integrity of the plasma membrane is lost. Fig. 3 shows flow cytometric histograph of Huh7 cells treated with GLA for 12 h. Untreated Huh7 cells were predominantly located in the PI-negative and Rh123-positive field (lower right quadrant), reflective of viable cells. The percentage of cells in the PI and Rh123-negative field (lower left quadrant), reflecting cells that are still viable but with damaged mitochondria, was increased by GLA treatment up to 32%. The percentage of cells in the PI positive field was more increased by GLA for 24 h (data not shown).
Fig. 3.
GLA induced the decrease in mitochondrial membrane potential in Huh7 cells. Huh7 cells were untreated (Control) or treated with 250 µM GLA (GLA) for 12 h. Mitochondrial membrane potential was detedcted by flow cytometry analysis using Rh123 and PI.
GLA cytotoxicity in Huh7 cells
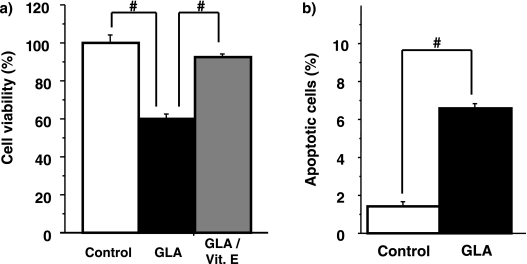
The effect of GLA on cell viability was determined using the WST-8 assay. Treatment of Huh7 cells with 250 µM GLA for 48 h resulted in decreases in cell viability of 59%, respectively (Fig. 4a). We used vitamin E, one of antioxidants and fatty acid oxidation [4], according to previously described dose condition [18]. The cytotoxic effect of GLA was almost blocked when the cells were supplemented with Vitamin E in addition to GLA.
Fig. 4.
(a) GLA induced cytotoxicity in Huh7 cells. Huh7 cells were untreated (Control) or treated with (GLA/Vit. E) or without (GLA) 100 µM Vitamin E in the presence of GLA 250 µM. Cell viability was measured by the WST-8 assay. #p<0.01. (b) GLA induced apoptosis cell death in Huh7 cells. Huh7 cells were untreated (Control) or treated with 250 µM GLA (GLA) for 24 h. The extent of apoptotic cell death was monitored by staining the nuclear DNA with a fluorescence DNA dye (Hoechst 33258) (n = 4). #p<0.01.
As GLA has been shown to induce apoptosis in Walker 256 rat carcinosarcoma cells [19], we studied the effects of GLA on apoptosis induction in Huh7 cells. As determined by the Hoechst 33258 dye-staining method, the percentage of apoptotic cells was increased from 1.42 ± 0.20% to 6.57 ± 0.29% by GLA (Fig. 4b).
cDNA microarray to determine the comprehensive analyses on gene regulation
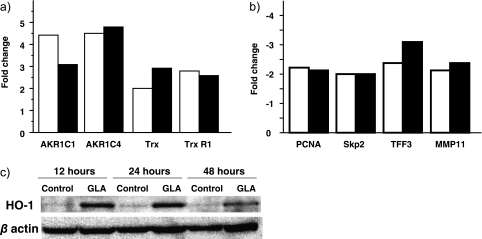
The expression of alteration of 12,814 genes was analyzed by cDNA microarray between GLA treated and untreated Huh7 cells for 24 h. Table 2a and 2b demonstrate genes which were up-regulated >2-fold and down-regulated ≤2-fold. Stress response genes and antioxidative genes were mainly up-regulated in the presence of treatment with GLA for 24 h. The most induced gene was heme oxygenase-1 (HO-1). Cell cycle related genes encoding proliferating cell nuclear antigen (PCNA) and S-phase kinase-associated protein 2 (Skp2) were down regulated. To comfirmed these results, changes in mRNA expression of different genes were analyzed by quantitative real-time RT-PCR. We tested the expression of PCNA, Skp2, trefoil factor 3 (TFF3), matrix metalloproteinase 11 (MMP11), aldo-keto reductase family 1, member C1 (AKR1C1), aldo-keto reductase family 1, member C4 (AKR1C4), Thioredoxin (Trx) and Thioredoxin reductase1 1 (TrxR1). All the studied genes were induced over 2-fold (Fig. 5a and 5b). The most induced gene was HO-1 in the presence of treatment with GLA for 24 h, so we investigated the protein expression of HO-1 using western blot analysis. As Fig. 5c shown, HO-1 protein was overexpressed for 12, 24 and 48 h in Huh7 cells.
Table 2.
| a) Summary of genes up-regulated in Huh7 cells after exposed to GLA for 24 h | ||
|---|---|---|
| GenBank accession no. | Gene name | Fold change |
| Heat shock related protein | ||
| AF116650 | suppression of tumorigenicity 13 (colon carcinoma) (Hsp70-interacting protein) | 2.4 |
| Metabolism | ||
| Z82244 | heme oxygenase (decycling) 1 | 5.7 |
| S68287 | aldo-keto reductase family 1, member C4 | 4.5 |
| M86609 | aldo-keto reductase family 1, member C1 | 4.4 |
| J03910 | metallothionein 1G | 3.4 |
| D49387 | NADP dependent leukotriene b4 12-hydroxydehydrogenase | 3.2 |
| D88687 | thioredoxin reductase 1 | 2.8 |
| X97261 | metallothionein 1L | 2.7 |
| AL133415 | DNA (cytosine-5-)-methyltransferase 2 | 2.4 |
| AK025732 | N-acylsphingosine amidohydrolase (acid ceramidase) | 2.1 |
| M13519 | hexosaminidase B (beta polypeptide) | 2.1 |
| NM_001122 | adipose differentiation-related protein | 2 |
| AI816415 | ferritin, heavy polypeptide 1 | 2 |
| AI143103 | thioredoxin | 2 |
| Transporter | ||
| J02769 | solute carrier family 3 member 2 | 3.3 |
| Cytoskeleton | ||
| AW974204 | clathrin | 2 |
| Other | ||
| X65614 | S100 calcium-binding protein P | 3.6 |
| NM_005308 | G protein coupled receptor kinase 5 | 2.2 |
| b) Summary of genes down-regulated in Huh7 cells after exposed to GLA for 24 h | ||
|---|---|---|
| GenBank accession no. | Gene name | Fold change |
| Metabolism | ||
| AW296221 | kynureninase (L-kynurenine hydrolase) | −2.6 |
| Transcription | ||
| U90551 | H2A histone family, member L | −2.4 |
| Cell cycle | ||
| J04718 | proliferating cell nuclear antigen | −2.2 |
| U33761 | S-phase kinase-associated protein 2 (p45) | −2 |
| Cytoskeleton/cell invasion | ||
| AI189375 | matrix metalloproteinase 11 (stromelysin 3) | −2.1 |
| AI824089 | PDZ and LIM domain 1 (elfin) | −2 |
| Others | ||
| AA633399 | trefoil factor 3 (intestinal) | −2.4 |
| M62839 | apolipoprotein H (beta-2-glycoprotein I) | −2.4 |
Fig. 5.
Gene induction in the presence of GLA for 24 h using quantitative real-time RT-PCR. (a) up-regulated genes (b) down-regulated genes. White bars, cDNA microarray fold change; Black bars, real time RT-PCR fold change. (c) GLA induced HO-1 protein in Huh7 cells. Huh7 cells were untreated (control) or with 250 µM GLA (GLA) for 12, 24 and 48 h. HO-1 and β-actin proteins were detected by western blotting.
Effect of GLA cytotoxicity in the present of CrMP
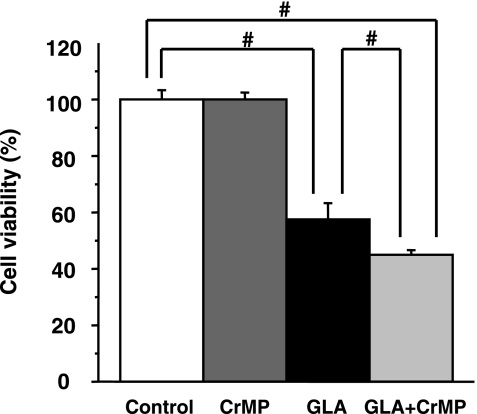
To characterize a potential protective role for HO-1 induction in Huh7 cells, an effective HO inhibitor, CrMP [20], was used to block the activity of HO-1. CrMP itself did not show any cytotoxicity at the concentrations from 1 to 50 µM used in huh7 cells (data not shown). When Huh7 cells were treated with 250 µM GLA in the presence of 50 µM CrMP for 48 h, there was a potentiation of GLA cytotoxicity by CrMP compared with treatment with GLA alone, significantly (Fig. 6).
Fig. 6.
Chromium mesoporphyrin (CrMP) potentiates cytotoxicity of GLA in Huh7 cells. Huh7 cells were treated with or without 50 µM CrMP in the presence or absence of GLA 250 µM. Cell viability was measured by the WST-8 assay. #p<0.01.
Discussion
This study is the first report about the cellular and molecular biological mechanisms by GLA exposure in human HCC cell lines. It has been reported previously that the presence of GLA was found to inhibit HCC cell proliferation significantly [5]. GLA induces ROS generation and lipid peroxidation in Walker 256 rat carcinosarcoma cells [19]. In this study, the ROS levels and lipid peroxidation of Huh7 cells were significantly increased by exposure to GLA. Studies of arachidonic acid, a one of the n-6 family of polyunsaturated fatty acids, in isolated mitochondria have identified the increase in ROS to be linked with impaired mitochondrial respiratory activity [21], which is comparable with the present situation of GLA-induced increased ROS production and decreased mitochondrial function. Vitamin E, a predominant lipophlic anti-oxidant, is an efficient scavenger of alkoxyl, single oxygen and peroxyl radicals [22]. Vitamin E integrated in cellular membranes has been shown to reduce hydroxyl radicals and is able to prevent peroxidation of lipids. Our study showed that the cytotoxic effect of GLA was almost blocked when the Huh7 cells were supplemented with Vitamin E in addition to GLA. This was confirmed that the cytotoxic effect of GLA was caused by ROS generation including lipid peroxidation. Oxidative stress has also been found to influence both the occurrence of the mitochondrial permeability transition and cytochrome c release [23]. Initiation of apoptosis releases cytochrome c into the cytosol, which precedes cleavage and activation of caspase [24]. The effect of GLA upon ROS production and decreased mitochondrial membrane potential was observed in our study. Moreover, we observed DNA fragmentation in Huh7 cells under GLA expose. It is suggested that the induction of apoptosis by these changes in cellular lipid metabolism was occurred in Huh7 cells. It is important to investigate the effect of normal hepatic cells and tissues. We had observed that no cytotoxicity of primary cultured hepatocytes from rat liver was observed in a concentration of GLA of 250 µM (data not shown). Further studies will be necessary to investigate the effect of primary cultured hepatocytes from human liver and the antitumor effect in the animal HCC model.
High throughput gene expression techniques allow for the massive gathering of biological data. The cDNA microarray technique measures mRNA expression, respectively. We have demonstrated that GLA induces gene expression using cDNA microarray technique not previously described in HCC cell lines. The most induced gene for 24 h was HO-1. HO is the rate-limiting enzyme in the conversion of heme into biliverdin, carbon monoxide, and free iron [25]. HO-1 expression is relatively low, with the exception of the spleen, in which HO-1 levels are constitutively high. Recent evidences have shown the critical importance of HO-1 expression in mediating antioxidant, anti-inflammatory and anti-apoptotic effects [26]. Furthermore, increased HO-1 activity results in degradation of the heme moiety, a potentially toxic prooxidant, and generates bilirubin, an antioxidant capable of scavenging peroxy radicals and inhibiting lipid peroxidation [27, 28]. In this study, HO-1 protein was induced by GLA exposure in Huh7 cells for up to 48 h, and chromium mesoporphyrin (CrMP), an inhibitor of HO activity, significantly potentiated GLA cytotoxicity. Similar GLA cytotoxicity had been found in Hep3B, human HCC cell lines. Furthermore, the induction of HO-1 protein was observed, and CrMP significantly accelerated GLA cytotoxicity in Hep3B cells (data not shown). Thioredoxin (Trx) and Thioredoxin reductase 1 (TrxR1) were up-regulated gene for 24 h. Trx, TrxR1 and NADPH comprise a highly conserved, ubiquitous system [29] that plays an important role in the redox regulation of multiple intracellular processes, including DNA synthesis, transcriptional regulation and resistance to cytotoxic agents that induce oxidative stress and apoptosis [30]. When Huh7 and Hep3B cells were treated with GLA in the presence of Trx for 48 h, there was a decrease of GLA cytotoxicity by Trx compared with treatment with GLA alone (data not shown). These result suggest that Trx redox system was one of the most important cascade in the induce GLA oxidative stress. Aldo-keto reductase 1 family C1 (AKR1C1) and C4 (AKR1C4) were also up-regulated genes for 24 h, using cDNA microiarray and quantitative real-time RT-PCR analyses. Human AKR1 family (C1-C4) are plastic enzymes and display 3-, 17- and 20-ketosteroid reductase activity and 3α-, 17β- and 20α-hydroxysteroid oxidase activity [31, 32]. In recent data, AKR1C1 has reduced 4-Hydroxy-2-nonenal (HNE) and other α,β-unsaturated aldehydes produced during lipid peroxidation with high catalytic efficiency [33]. HNE is one of the most common cytotoxic products of lipid peroxidation, and derived from arachidonic acid and processes several structural characteristics in common with prostaglandins. It is suggested that AKR was up regulated to catalyze the reduction of HNE and other α,β-unsaturated aldehydes produced during lipid peroxidation caused by GLA exposure. Additional studies will be required to identify the interaction of HO-1, Trx, AKR and HNE in the presence of treatment with GLA.
In summary, our studies demonstrate that the presence of GLA in HCC cell lines has induced cell growth inhibition, ROS generation including lipid peroxidation, and HO-1 production for antioxidant protection against oxidative stress caused by GLA. GLA treatment may become therapeutic modality in patients with advanced HCC.
References
- 1.Jiang W.G., Bryce R.P., Horrobin D.F. Essential fatty acid: molecular and cellular basis of their anticancer action and clinical implications. Crit. Rev. Oncol. Hematol. 1998;27:179–209. doi: 10.1016/s1040-8428(98)00003-1. [DOI] [PubMed] [Google Scholar]
- 2.Fearon K.C., Falconer J.S., Ross J.A., Carter D.C., Hunter J.O., Reynolds P.D., Tuffnell Q. An open-label phase I/II dose escalation study of the treatment of pancreatic cancer using lithium gamma linolenate. Anticancer Res. 1996;16:867–874. [PubMed] [Google Scholar]
- 3.Kenny F.S., Pinder S.E., Ellis I.O., Gee J.M., Nicholson R.I., Bryce R.P., Robertson J.F. Gamma linolenic acid with tamoxifen as primary therapy in breast cancer. Int. J. Cancer. 2000;85:643–648. doi: 10.1002/(sici)1097-0215(20000301)85:5<643::aid-ijc8>3.0.co;2-z. [DOI] [PubMed] [Google Scholar]
- 4.Ells G.W., Chisholm K.A., Simmons V.A., Horrobin D.F. Vitamin E blocks the cytotoxic effect of γ-linolenic acid when administered as late as the time of onset of cell death—insight into the mechanism of fatty acid induced cytotoxicity. Cancer Lett. 1996;98:207–211. [PubMed] [Google Scholar]
- 5.Das U.N. From bench to the clinic: gamma-linolenic acid therapy of human gliomas. Prostaglandins Leukot. Essent. Fatty Acids. 2004;70:539–552. doi: 10.1016/j.plefa.2003.12.001. [DOI] [PubMed] [Google Scholar]
- 6.Das U.N. Gamma-linolenic acid therapy of human glioma-a review of in vitro, in vivo, and clinical studies. Med. Sci. Monit. 2007;13:119–131. [PubMed] [Google Scholar]
- 7.Hayashi Y., Fukushima S., Hirata T., Kishimoto S., Katsuki T., Nakano M. Anticancer activity of free gamma-linolenic acid on AH-109A rat hepatoma cells and the effect of serum albumin on anticancer activity of gamma-linolenic acid in vitro. J. Pharmacobiodyn. 1990;11:705–711. doi: 10.1248/bpb1978.13.705. [DOI] [PubMed] [Google Scholar]
- 8.Ross D.T., Scherf U., Eisen M.B., Perou C.M., Rees C., Spellman P., Iyer V., Jeffrey S.S., Van de Rijn M., Waltham M., Pergamenschikov A., Lee J.C., Lashkari D., Shalon D., Myers T.G., Weinstein J.N., Botstein D., Brown P.O. Systematic variation in gene expression patterns in human cancer cell lines. Nat. Genet. 2000;24:227–235. doi: 10.1038/73432. [DOI] [PubMed] [Google Scholar]
- 9.Scherf U., Ross D.T., Waltham M., Smith L.H., Lee J.K., Tanabe L., Kohn K.W., Reinhold W.C., Myers T.G., Andrews D.T., Scudiero D.A., Eisen M.B., Sausville E.A., Pommier Y., Botstein D., Brown P.O., Weinstein J.N. A gene expression detabase for the molecular pharmacology of cancer. Nat. Genet. 2000;24:236–244. doi: 10.1038/73439. [DOI] [PubMed] [Google Scholar]
- 10.van Wezel A.L. Growth of cell-strains and primary cells on microcarriers in homogeneous culture. Nature. 1967;216:64–65. doi: 10.1038/216064a0. [DOI] [PubMed] [Google Scholar]
- 11.Maehara S.-I., Tanaka S., Shimada M., Shirabe K., Saito Y., Takahashi K., Maehara Y. Selenoprotein P, as a predictor for evaluating gemcitabine resistance in human pancreatic cancer cells. Int. J. Cancer. 2004;112:184–189. doi: 10.1002/ijc.20304. [DOI] [PubMed] [Google Scholar]
- 12.Niehaus W.G., Samuelsson B. Formation of malonaldehyde from phospholipid arachidonate during microsomal lipid peroxidation. Eur. J. Biochem. 1968;6:126–130. doi: 10.1111/j.1432-1033.1968.tb00428.x. [DOI] [PubMed] [Google Scholar]
- 13.Bai J., Rodriguez A.M., Melendez J.A., Cederbaum A.I. Overexpression of catalase in cytosolic or mitochondrial compartment protects HepG2 cells against oxidative injury. J. Biol. Chem. 1999;274:26217–26224. doi: 10.1074/jbc.274.37.26217. [DOI] [PubMed] [Google Scholar]
- 14.Ohuchida T., Okamoto K., Akahane K., Higure A., Todoroki H., Abe Y., Kikuchi M., Ikematsu S., Muramatsu T., Itoh H. Midkine protects hepatocellular carcinoma cells against TRAIL mediated apoptosis through down-regulation of caspase-3 activity. Cancer. 2004;100:2430–2436. doi: 10.1002/cncr.20266. [DOI] [PubMed] [Google Scholar]
- 15.Andoh T., Chock P.B., Chiueh C.C. The role of thioredoxin in protection against oxidative stress-induced apoptosis in SH-SY5Y cells. J. Biol. Chem. 2002;277:9655–9660. doi: 10.1074/jbc.M110701200. [DOI] [PubMed] [Google Scholar]
- 16.Lapillonne H., Konopleva M., Tsao T., Gold D., McQueen T., Sutherland R.L., Madden T., Andreeff M. Activation of peroxisome proliferator activated receptor gamma by a novel synthetic triterpenoid 2-cyano-3,12-dioxooleana-1,9-dien-28-oic acid induces growth arrest and apoptosis in breast cancer cells. Cancer Res. 2003;63:5926–5939. [PubMed] [Google Scholar]
- 17.Itoh S., Maeda T., Shimada M., Aishima S.-I., Shirabe K., Tanaka S., Maehara Y. Role of expression of focal adhesion kinase in progression of hepatocellular carcinoma. Clin. Cancer Res. 2004;10:2812–2817. doi: 10.1158/1078-0432.ccr-1046-03. [DOI] [PubMed] [Google Scholar]
- 18.Vartak S., McCaw R., Davis C.S., Robbins M.E., Spector A.A. Gamma linolenic acid (GLA) is cytotoxic to 36B10 malignant rat astrocytoma cells but not to ‘normal’ rat astrocytes. Br. J. Cancer. 1998;77:1612–1620. doi: 10.1038/bjc.1998.264. [DOI] [PMC free article] [PubMed] [Google Scholar]
- 19.Colquhoun A., Schumacher R.I. gamma-Linolenic acid and eicosapentaenoic acid induce modifications in mitochondrial metabolism, reactive oxygen species generation, lipid peroxidation and apoptosis in Walker 256 rat carcinosarcoma cells. Biochem. Biophys. Acta. 2001;1533:207–219. doi: 10.1016/s1388-1981(01)00136-6. [DOI] [PubMed] [Google Scholar]
- 20.Vreman H.J., Ekstrand B.C., Stevenson D.K. Selection of metalloporphyrin heme oxygenase inhibitors based on potency and photoreactivity. Pediatr. Res. 1993;33:195–200. doi: 10.1203/00006450-199302000-00021. [DOI] [PubMed] [Google Scholar]
- 21.Cocco T., Di Paola M., Papa S., Lorusso M. Arachidonic acid interaction with the mitochondrial electron transport chain promotes reactive oxygen species. Free Radic. Biol. Med. 1999;27:51–59. doi: 10.1016/s0891-5849(99)00034-9. [DOI] [PubMed] [Google Scholar]
- 22.Ricciarelli R., Zingg J.M., Azzi A. Vitamin E: protective role a Janus molecule. FASEB J. 2001;15:2314–2325. doi: 10.1096/fj.01-0258rev. [DOI] [PubMed] [Google Scholar]
- 23.Kantrow S.P., Tatro L.G., Piantadosi C.A. Oxidative stress and adenine nucleotide control of mitochondrial permeability transition. Free Radic. Biol. Med. 2000;28:251–260. doi: 10.1016/s0891-5849(99)00238-5. [DOI] [PubMed] [Google Scholar]
- 24.Kim C.N., Way X., Huang Y., Ibrado A.M., Liu L., Fang G., Bhalla K. Overexpression of Bcl-xL inhibits ara-c induced mitochondrial loss of cytochrome c and other perturbations that activate the molecular cascade of apoptosis. Cancer Res. 1997;57:3115–3120. [PubMed] [Google Scholar]
- 25.Choi A.M., Alam J. Heme oxygenase-1: function, regulation, and implication of a novel stress-inducible protein in oxidant-induced lung injury. Am. J. Respir. Cell Mol. Biol. 1996;15:9–19. doi: 10.1165/ajrcmb.15.1.8679227. [DOI] [PubMed] [Google Scholar]
- 26.Otterbein L.E., Bach F.H., Alam J., Soares M., Tao Lu H., Wysk M., Davis R.J., Flavell R.A., Choi A.M. Carbon monoxide has anti-inflammatory effects involving the mitogen-activated protein kinase pathway. Nat. Med. 2000;6:422–428. doi: 10.1038/74680. [DOI] [PubMed] [Google Scholar]
- 27.Stocker R., Yamamoto Y., McDonagh A.F., Glazer A.N., Ames B.N. Bilirubin is an antioxidant of possible physiological importance. Science. 1987;235:1043–1046. doi: 10.1126/science.3029864. [DOI] [PubMed] [Google Scholar]
- 28.Llesuy S.F., Tomaro M.L. Heme oxygenase and oxidative stress. Evidence of involvement of bilirubin as physiological protector against oxidative damage. Biochem. Biophys. Acta. 1994;1223:9–14. doi: 10.1016/0167-4889(94)90067-1. [DOI] [PubMed] [Google Scholar]
- 29.Mustacich D., Powis G. Thioredoxin reductase. Biochem. J. 2000;346:1–8. [PMC free article] [PubMed] [Google Scholar]
- 30.Smart D.K., Ortiz K.L., Mattson D., Bradbury C.M., Bisht K.S., Sieck L.K., Brechbiel M.W., Gius D. Thioredoxin reductase as a potential molecular target for anticancer agents that induce oxidative stress. Cancer Res. 2004;64:6716–6724. doi: 10.1158/0008-5472.CAN-03-3990. [DOI] [PubMed] [Google Scholar]
- 31.Lin H.K., Jez J.M., Schlegel B.P., Peehl D.M., Pachter J.A., Penning T.M. Expression and characterization of recombinant type 2 3 alpha-hydroxysteroid dehydrogenase (HSD) from human prostate: demonstration of bifunctional 3 alpha/17 beta-HSD activity and cellular distribution. Mol. Endocrinol. 1997;11:1971–1984. doi: 10.1210/mend.11.13.0026. [DOI] [PubMed] [Google Scholar]
- 32.Penning T.M., Burczynski M.E., Jez J.M., Hung C.F., Lin H.K., Ma H., Moore M., Palackal N., Ratnam K. Human 3alpha-hydroxysteroid dehydrogenase isoforms (AKR1C1-AKR1C4) of the aldo-keto reductase superfamily: functional plasticity and tissue distribution reveals roles in the inactivation and formation of male and female sex hormones. Biochem. J. 2000;351:67–77. doi: 10.1042/0264-6021:3510067. [DOI] [PMC free article] [PubMed] [Google Scholar]
- 33.Burczynski M.E., Sridhar G.R., Palackal N.T., Penning T.M. The reactive oxygen species—and Michael acceptor-inducible human aldo-keto reductase AKR1C1 reduces the alpha,beta-unsaturated aldehyde 4-hydroxy-2-nonenal to 1,4-dihydroxy-2-nonene. J. Biol. Chem. 2001;276:2890–2897. doi: 10.1074/jbc.M006655200. [DOI] [PubMed] [Google Scholar]


