Abstract
The accuracy of the system model in an iterative reconstruction algorithm greatly affects the quality of reconstructed positron emission tomography (PET) images. For efficient computation in reconstruction, the system model in PET can be factored into a product of a geometric projection matrix and sinogram blurring matrix, where the former is often computed based on analytical calculation, and the latter is estimated using Monte Carlo simulations. Direct measurement of sinogram blurring matrix is difficult in practice because of the requirement of a collimated source. In this work, we propose a method to estimate the 2D blurring kernels from uncollimated point source measurements. Since the resulting sinogram blurring matrix stems from actual measurements, it can take into account the physical effects in the photon detection process that are difficult or impossible to model in a Monte Carlo (MC) simulation, and hence provide a more accurate system model. Another advantage of the proposed method over MC simulation is that it can be easily applied to data that have undergone a transformation to reduce the data size (e.g., Fourier rebinning).
Point source measurements were acquired with high count statistics in a relatively fine grid inside the microPET II scanner using a high-precision 2-D motion stage. A monotonically convergent iterative algorithm has been derived to estimate the detector blurring matrix from the point source measurements. The algorithm takes advantage of the rotational symmetry of the PET scanner and explicitly models the detector block structure. The resulting sinogram blurring matrix is incorporated into a maximum a posteriori (MAP) image reconstruction algorithm. The proposed method has been validated using a 3-by-3 line phantom, an ultra-micro resolution phantom, and a 22Na point source superimposed on a warm background.
The results of the proposed method show improvements in both resolution and contrast ratio when compared with the MAP reconstruction with a MC-based sinogram blurring matrix, and one without a detector response model. The reconstruction time is unaffected by the new method since the blurring component takes a relatively small part of the overall reconstruction time. The proposed method can be applied to other PET scanners for human and animal imaging.
Keywords: detector response, sinogram blurring kernel, positron emission tomography, iterative image reconstruction, system modeling
INTRODUCTION
Iterative image reconstruction methods have gained increasing popularity in emission tomography because they are amenable to an arbitrary, complicated, and realistic system model that defines the mapping from sources to measurements. It is been shown in both positron emission tomography (PET) and single photon emission computed tomography (SPECT) that accurately modeling the system response leads to improved image quality, e.g. obtaining high-resolution images (Veklerov et al., 1988; Qi et al., 1998), reducing bias in kinetic parameter estimation (Kadrmas et al., 1999), improving quantitation in cardiac scans (King et al., 1996; Tsui et al., 1994b), and signal-to-noise ratio of cold lesions (Beekman et al., 1997; Hutton et al., 1996; Hutton, 1997). Clinical studies also show improved sensitivity and specificity in the diagnosis and evaluation of coronary artery disease (Ficaro et al., 1996; Ficaro and Corbett, 2004). Tremendous effort has been devoted to developing accurate system models for image reconstruction, e.g., (Qi et al., 1998; Bai et al., 2002; Gilland et al., 1994; King et al., 1995; Laurette et al., 2000; Tsui et al., 1994a; Welch and Gullberg, 1998; Alessio et al., 2006; Selivanov et al., 2000; Panin et al., 2006).
The system model of PET is usually stored in a set of factored matrices to reduce storage and computational costs (Qi et al., 1998; Alessio et al., 2006; Frese et al., 2003; Selivanov et al., 2000; Panin et al., 2006; Mumcuoglu et al., 1996). The major element is the geometric projection matrix which can be calculated based on the solid angle effect. The second component is the detector response function, or sinogram blurring matrix, which models the physical effects such as crystal penetration, inter-crystal scatter, photon non-colinearity, etc (Qi et al., 1998; Alessio et al., 2006). The sinogram blurring matrix is difficult to calculate analytically. Direct measurement is also challenging because it requires placing a collimated point source at different radial positions inside the PET scanner to avoid crosstalk between measurements taken at different angles. As a results, Monte Carlo (MC) simulations are often used to calculate the detector blurring matrix (Qi et al., 1998; Mumcuoglu et al., 1996) or the complete system matrix without any decomposition between the geometric and blurring components (Rafecas et al., 2004).
Here we propose a maximum likelihood (ML) approach to estimating 2D sinogram blurring kernels from experimental measurements of non-collimated point sources. The resulting sinogram blurring matrix has the advantage of being derived from actual measurements and hence can take into account the physical effects in the photon detection process that are difficult to model in a MC simulation. Similar approaches have been presented recently by Alessio et al. (Alessio et al., 2006) and Panin et al. (Panin et al., 2006). However, their approaches have two major limitations that are overcome here: (i) they ignored the block structure of the detector by assuming the detector blurring matrix remained the same for all azimuthal angle, whereas our method models the block effect explicitly; (ii) they ignored the sinogram blurring effect along the angular direction and limited the blurring to only the radial and axial directions, whereas our method models the sinogram blurring effect using a 2D blurring kernel in both radial and angular directions. Beekman et al. (Beekman et al., 1999) also used a ML method to estimate the detector response in SPECT from measurements of an extended source, but their method is not applicable to PET because of the differences in scanner geometry and detector response model.
The approach presented here is also different from direct measuring the system matrix without any decomposition between the geometric and blurring components by scanning a point source at every voxel position (Panin et al., 2004; Furenlid et al., 2004). In theory, the latter approach leads to the most accurate description of the whole system matrix, including the detector response components. However, the resulting system matrix is less sparse and hence results in much higher computation cost in reconstruction comparing to a factored system model. It also suffers from having to acquire a large number of scans (equal to the number of the voxels). Furthermore, the voxel size in reconstruction is pre-determined by the sampling distance of the grid and cannot be changed once the point source data are acquired. In comparison, with a factored system matrix approach, we can easily change the voxel size in reconstruction by using a different geometric projection matrix without the necessity of re-estimating the sinogram blurring matrix.
This paper is an extension of our earlier work presented in (Qi, 2006; Tohme and Qi, 2007). We have modified the rotational symmetry assumed in (Qi, 2006) to account for the detector block effect in modern PET scanners. We also present experimental results using the microPET II scanner (Tai et al., 2003).
MATERIALS AND METHODS
Maximum Likelihood Estimation of the Sinogram Blurring Matrix
We propose to estimate the detector blurring matrix from a set of point source measurements. The point source data are modeled as a collection of independent Poisson random variables with the likelihood function
| (1) |
where B is the sinogram blurring matrix with the (i,j)th element bij being the blurring contribution from detector pair j to detector pair i. yi,m and gi,m are the measured projection and calculated geometric projection of the mth point source by detector pair i, respectively, and ni is the sensitivity factor for detector pair i. M is the number of the point source positions and N is the number of sinogram elements. In this work, gi,m are calculated by forward projecting a computer simulated point source using a geometrical projection matrix. B models the crystal penetration, inter-crystal scatter, and other blurring effects in the photon detection process. The focus here is to estimate B from point source measurements. The log likelihood function of the measured data is written as
| (2) |
We obtain an ML estimate of the sinogram blurring matrix by
| (3) |
Equation (3) does not have a closed-form solution, but can be solved iteratively. Following the approach described in (Qi, 2006), we obtain the following closed form update equation
| (4) |
Equation (4) is essentially the same as the famous ML-EM (expectation maximization) algorithm for emission image reconstruction with bij as the unknowns and gi,m as the transformation matrix. Similarly, the above algorithm defined in Equation (4) monotonically converges to the ML estimate of the sinogram blurring matrix and guarantees the nonnegativity constraint when starting from a nonnegative initial estimate.
Rotational Symmetry and Detector Block Effect
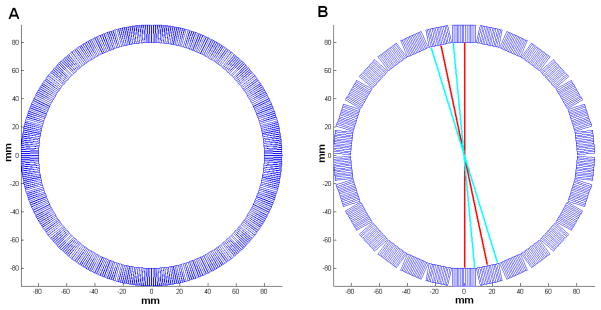
Most PET scanners have a cylindrical geometry. To model the rotational symmetry in PET scanners, we index the (i,j)th element, bij, as b(ir,iϕ, jr, jϕ), where ir and jr (=1,…N,r) are the radial indices, while iϕ and jφ (=1,… N,φ) are the angular indices. For a perfect ring scanner geometry as shown in Figure 1A, the detector blurring matrix is rotationally symmetric, i.e.
Figure 1.
(A) A perfect ring scanner geometry and (B) the geometry of the microPET II scanner with 30 detector blocks. The red line of responses (LORs) in (B) go through the center of the detector blocks and share the same blurring kernel, while the blue LORs go through the edge of the detector blocks and share another set of blurring kernel.
| (5) |
The rotational symmetry reduces the number of unknowns in the detector blurring matrix B by Nϕ. However, most modern PET scanners use block detectors and have a polygonal shape (Figure 1B). Thus, the rotational symmetry is only true on the block level. The effect of the block structure is particularly significant for small animal PET scanners, which have a small ring diameter.
To model the block effect, we use a blurring matrix that is rotationally symmetric at every specific number of angles equal to the number of crystal elements inside each detector block, instead of one that is rotationally symmetric at all angles. In the case of the microPET II scanner (Figure 1B), each detector block consists of 14 individual crystals. Therefore, the blurring matrix would be rotationally symmetric at every 14 angles. For example, angle 0 has the same blurring coefficient as angle 14 (0 + 14) (two representative LORs are shown in red in Figure 1B), and angle 7 is equivalent to angle 21 (two representative LORs are shown in blue). Equation (5) is then modified to
| (6) |
where k is calculated by
| (7) |
and K is the number of crystal elements inside one detector block. With equation (6), the number of unknowns in the detector blurring matrix B is reduced by Nφ/K.
Combining equation (6) with equation (4), we get the new update equation
| (8) |
where dϕ= jϕ− iϕ. The measured data yir,iϕ,m are sampled at every K angles starting from angle k to estimate the blurring matrix at angle k. Since the detector blurring is a local operator, most elements in b(ir, k, jr,dϕ) are zero. To reduce computational cost, we limit our calculations to just those radial bins that are close to ir and angles close to iϕ, i.e., |iϕ− jϕ|≤Wϕ and |ir − jr|≤Wr, where Wr and Wϕ are pre-selected window sizes in the radial and angular directions, respectively. In this study, we used Wr =10 and Wϕ =4. Note that for a given ir and k, the estimation of b(ir,k,•,•) is independent of other blurring kernels. Thus, equation (8) can be run in parallel on multiple processors to reduce the kernel estimation time.
Data Acquisition
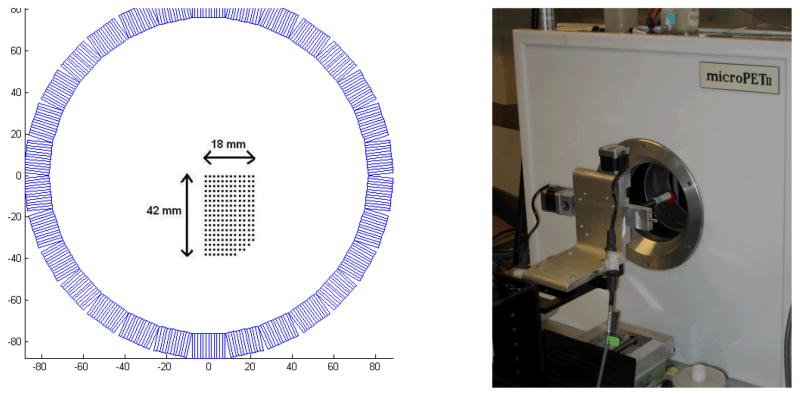
An 18.5 MBq (0.5 mCi) 22Na point source was scanned at 0.5-mm intervals for 3064 different locations (Figure 2A) inside the microPET II scanner using a 2-D high-precision computer-controlled motion stage shown in Figure 2B. The motion stage was placed outside the scanner with the point source protruding into the field of view to minimize attenuation effect. The stage was positioned in such a manner as to restrict the 2-D motion of the point source to the central axial plane. The scan duration at each location was 60 seconds. The whole acquisition was automated by acquiring data in list mode. A sequence of pulses was sent to the microPET II scanner as a gating signal each time before the point source was moved to the next position. The gating signal was embedded in the list-mode data stream and was subsequently used to histogram the list-mode data for each point source position into a separate sinogram with 140 radial bins and 210 azimuthal angles (span=3). While the proposed method can be used to estimate a different set of blurring kernels for each oblique sinogram, here we estimated the blurring kernels using the central direct sinogram plane only and applied the results to all oblique sinogram planes, which is consistent with the MAP reconstruction software on microPET scanners. The blurring effect along the axial direction is ignored in this study. A 12-hour normalization scan was performed prior to the data acquisition to obtain the detector normalization factor ni.
Figure 2.
(A): The point source locations inside the microPET II scanner. (B): The 2D motion stage setup.
The geometric projection gi,m used in the estimation were obtained by forward projecting simulated point source images using a purely geometrical system matrix with a 0.5-mm voxel size to match the separation between the point source positions. However, the estimated blurring matrix can be used with any other geometric projection matrix in image reconstruction as shown in the phantom experiments. To match the point source location in the simulated image to the physical position of the point source inside the scanner, care has been taken to place the first point source inside the scanner right at the very center of the field of view and to align the axes of the motion stage to be parallel to the x- and y-axes. Once this is done, the alignments of other points are determined by the computer-controlled 2D motion stage. To verify the accuracy of the positioning, point source data were also reconstructed using the existing MAP software installed on the scanner.
The 22Na point source was chosen in this experiment for practical considerations. The availability of high activity concentration in a small sub-millimeter volume makes the 22Na point source an ideal choice to achieving good count statistics in the measurement data in a short scan time. The long half-life of 22Na allows scanning all point source locations in a single session without replacing the source. Another consideration is that we are estimating a system matrix that will be primarily used to reconstruct PET studies with 18F tracers. A study done in (Alessio et al., 2005) shows that the positron range of 18F in water (which is very close to soft tissue in density) and that of 22Na in Lucite (the plastic shell encapsulating the point source) are very similar, which also suggests 22Na point source is a good candidate for measuring system response. A minor drawback of 22Na source is that it emits a high-energy gamma ray (1.275MeV), which can contribute to scattered events through down-scattering. Fortunately, the scattered events have minor effect on the resolution measurement in our experiment.
Evaluation Phantoms and Figures of Merit
To validate the estimated detector blurring matrix from the point source measurements, we incorporate it into the maximum a posteriori (MAP) reconstruction algorithm that was developed in (Qi et al., 1998; Bai et al., 2004) and is installed on the microPET II scanner. We acquired phantom scans and reconstructed the data using the MAP software without a detector response model, and with either the existing MC-based blurring matrix or the new one estimated from the point source data. All MAP reconstructions were performed with β=0 (equivalent to ML) and with various number of iterations. By default, the reconstruction algorithm includes two iterations of 3D Ordered Subset EM (OSEM 3D) as initialization prior to MAP iterations. The MC-based blurring matrix models the block structure of the detectors and is similar to those currently being used on microPET scanners (Siemens Preclinical Solutions, Inc., Knoxville, TN) for MAP reconstruction.
The first phantom is a 3-by-3 line phantom made by a plastic tube (shown in Figure 3A). The phantom was filled with 3.7MBq (100 μCi) of 18F and scanned at the center of the field of view (FOV) and at 2-cm radial offset from the center for 20 minutes at each location. The voxel size used in reconstructions is 0.4×0.4×0.58 mm3. The second phantom is an ultra-micro hot spot phantom™ shown in Figure 3B. The phantom was filled with 11.1 MBq (300 μCi) of 18F and scanned at 1.5-cm radial offset from the center for 30 minutes. The voxel size used in the reconstruction for the ultra-micro hot spot phantom was 0.5×0.5×0.58 mm3. Furthermore, a 22Na point source and a cylinder phantom filled with 18F solution were scanned separately and the sinograms were superimposed to mimic a phantom scan of a point source embedded in a warm background. The total number of detected events was 1.2 million for the point source and 820 million for the warm background. The data was reconstructed using a voxel size of 0.4×0.4×0.58 mm3.
Figure 3.
(A): A 3-by-3 line phantom. The inner diameter of the tube is about 0.6 mm and the center-to-center spacing between the lines is about 2 mm. (B): The ultra-micro hot spot phantom with hole diameters of 2.4, 2, 1.7, 1.35, 1, and 0.75mm. Spacing between line channels is twice of the diameter.
Line profiles were drawn along the radial and tangential directions through hot spots to compare the reconstruction results. We calculated a contrast coefficient defined as
| (9) |
where pk and vk represent the values of the k peak and valley in the line profile, respectively., and K is the number of valleys. By definition, the number of peaks is K+1. For the point source phantom, there is only one peak and the value of the valley is the mean of the warm background. For the line phantom images, a sum of Gaussian functions is fitted to the profiles and the corresponding full width at half maximum (FWHM) was extracted to compare the resolution across different reconstruction methods. We did not attempt to deconvolve the source size from the FWHM results because it would not affect the relative performance of the reconstruction methods. In addition, for the hot spot phantom and point source phantom images, we selected a set of voxels in the uniform background and calculated the standard deviation of the values of the voxels as a measure of noise level. The selected voxels are more than 2-mm away from each other to reduce the effect of noise correlation. A contrast-to-noise curve is then generated for the hot spot phantom and the point source phantom to compare different reconstruction methods.
RESULTS
Blurring Kernel Estimation
We estimate the sinogram blurring matrix using the proposed method by running the update equation in (8) for 200 iterations. Figure 4 shows the estimated blurring kernels for ir = 71, 43 and 15, and k = 8. The value of the blurring kernel at each position reflects the probability of mispositioning an event with the corresponding angular and radial offset. In a perfect system with no detector blurring effect, the blurring kernel would be a delta function at (0, 0). Note that ir =71 corresponds to the line of response passing through the center of the field of view. Thus, it has the minimum blurring effect. As the line of response moves away from the center, the blurring effect increases as shown by the increased size and reduced peak value of the blurring kernel. The plots also show that the detector blurring occurs in both radial and angular directions.
Figure 4.
The estimated sinogram blurring kernel for k=8 and ir = 15 (A), 43 (B), and 71 (C).
Figure 5 shows the sinogram blurring kernels for ir =43 at three different angles (k = 1, 8, and 14). For a rotationally symmetric scanner (i.e., ignoring the block effect), the three blurring kernels should be exactly the same. The fact that they are different proves that it is important to consider the block structure in the system model. Note that for k = 1 and 14, the two detectors forming the LORs are located at the edges of the two detector blocks, while for k = 8, the two detectors are located at the center of the detector blocks. Clearly the blurring effects for edge crystals are reduced and are elongated along diagonal directions comparing to that for the center crystals. This is because a photon is more likely to escape from the gap between detector blocks and not being detected when penetrating an edge crystal, whereas it is more likely to be stopped by adjacent crystal when penetrating a center crystal.
Figure 5.
Estimated sinogram blurring kernels for ir = 43 and k = 1 (A), 8 (B), and 14 (C). Horizontal axis is radial offset and vertical axis is angular offset.
The 3-by-3 Line Phantom Reconstruction
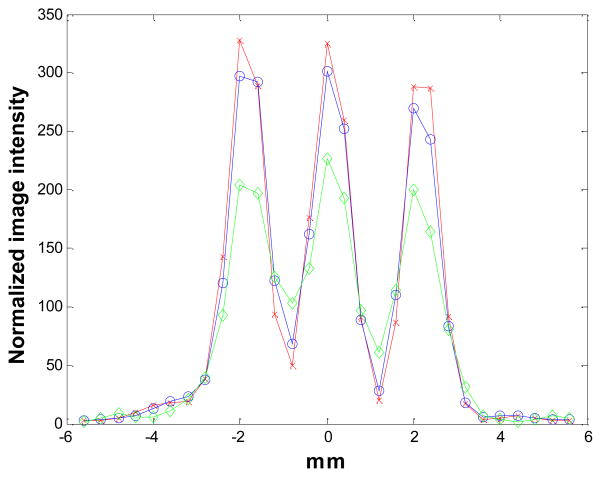
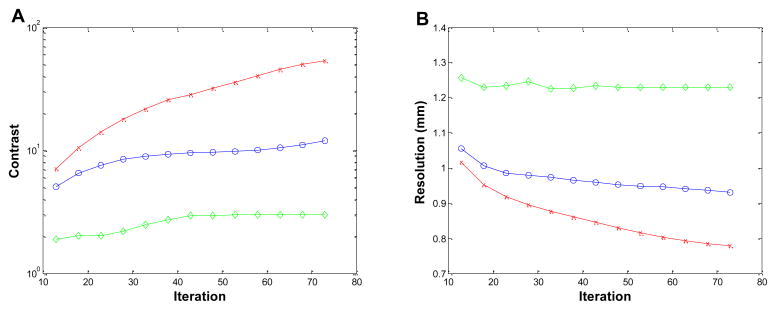
Figure 6 shows the reconstructed images of the 3-by-3 line phantom placed at the center of the field of view with 18 MAP iterations (default setting on the scanner) using no detector response model, the existing MC-based blurring matrix, and the newly estimated blurring matrix, respectively. The hot spots are more clearly resolved in the cases when a blurring model is included in the reconstruction compared to the MAP reconstruction without any blurring model, while there is little visible difference between the MAP results that use a blurring matrix. We plot the vertical profiles through the center points of the reconstruction images (Figure 7). The values of the contrast coefficient defined in equation (9) are plotted against iteration number and are shown in Figure 8A. At all iterations, the new blurring matrix results higher contrast than the other two methods. At iteration 73, the new blurring matrix results in a 350% increase in the contrast coefficient when compared to the MC-based result. The improvement over MAP with no detector response model is much more pronounced with an increase of contrast coefficient by 1690%. The FWHM results obtained by the Gaussian fitting are plotted in Figure 8B, and also show that MAP reconstructions with either sinogram blurring model achieves significantly better resolution than MAP without any sinogram blurring model. Comparing the two blurring models, the new blurring matrix produces better resolution than the MC-based blurring matrix. The improvement may be attributed to a better estimation of the inter-crystal scatter and non-colinearity by the proposed method. Furthermore, the positron range, missing from the Monte Carlo kernel, is inherently modeled in the new blurring matrix.
Figure 6.
The reconstructed image of the 3-by-3 phantom at center of FOV. (A): MAP reconstruction with no detector response model. (B): MAP reconstruction using the Monte Carlo based blurring matrix. (C): MAP reconstruction using the new blurring matrix.
Figure 7.
The vertical profiles through the center of the images in Figure 6. Diamonds: MAP reconstruction with no detector response model; circles: MAP reconstruction with Monte Carlo based blurring matrix; crosses: MAP reconstruction with the new blurring matrix.
Figure 8.
Figures of merit for the 3-by-3 phantom located at the center of FOV. (A): contrast versus iteration. (B): resolution (FWHM) versus iteration. Diamonds: MAP reconstruction with no detector response model; circles: MAP reconstruction with Monte Carlo based blurring matrix; crosses: MAP reconstruction with the new blurring matrix.
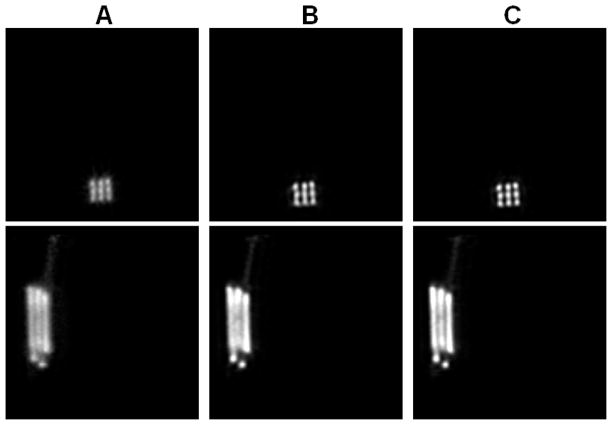
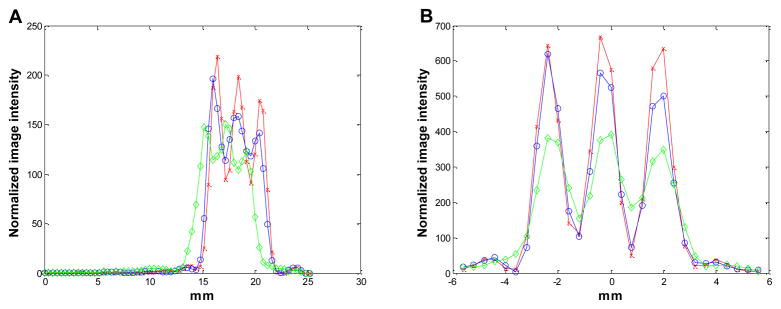
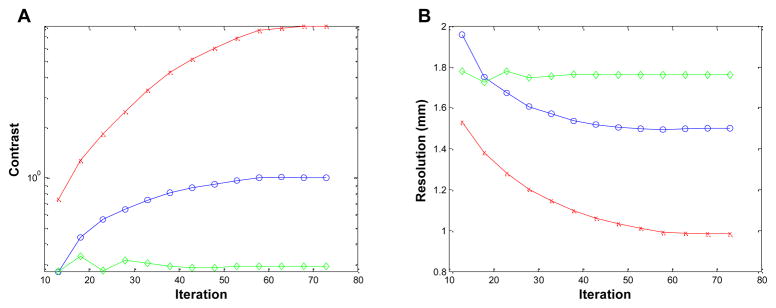
Figure 9 shows the reconstructed images of the 3-by-3 line phantom placed at 2-cm off-center for iteration 18. The reconstructed image with the new blurring matrix shows clear improvements in the separation of the 3-by-3 sources in both radial and tangential directions. The improvement is even more evident in the radial and tangential profiles through the middle point of the phantom as shown in Figure 10. The profiles in Figure 10 are average of three adjacent lines because the points do not line up with the axes completely. The contrast coefficients are plotted against iteration number in Figure 11A, and show, at iteration 73, a 720% and 2684% improvement for the new method over the MAP reconstruction with the Monte Carlo based blurring matrix and without any blurring model, respectively. The FWHM values are plotted versus iteration number in Figure 11B and show that the proposed method results in better resolution than either of the other MAP reconstructions. Moving the phantom 2-cm away from the center of FOV, the mean FWHM in the radial direction at iteration 73 degrades by 61.5% and 43.1% for the MAP using the MC-based blurring matrix, and without any blurring model, respectively, while the degradation was only 26.4% for MAP using the new blurring matrix. On the other hand, the degradation in contrast observed when moving 2-cm away from the center of FOV is 84.8%, 91.6%, and 90.2% for MAP reconstructions using the new blurring matrix, the MC-based blurring matrix, and no blurring matrix, respectively. Note that the absolute contrast value of the reconstruction without a blurring kernel for the off-center phantom at iteration 73 is very low (=0.29) at which we were not able to distinguish between peaks and valleys reliably, so the result is more sensitive to noise.
Figure 9.
The reconstructed images of the 3-by-3 phantom at 2-cm radial offset. (A): MAP reconstruction with no detector response model. (B): MAP reconstruction using the Monte Carlo based blurring matrix. (C): MAP reconstruction using the new blurring matrix. Top row: transaxial views; bottom row: sagittal views through the center column.
Figure 10.
The radial (A) and tangential (B) profiles through the middle point in the transaxial images shown in Figure 9. Diamonds: MAP reconstruction with no detector response model; circles: MAP reconstruction with Monte Carlo based blurring matrix; crosses: MAP reconstruction with the new blurring matrix.
Figure 11.
Figures of merit for the 3-by-3 phantom located 2 cm away from the center of FOV. (A): contrast versus iteration. (B): resolution (FWHM) versus iteration. Diamonds: MAP reconstruction with no detector response model; circles: MAP reconstruction with Monte Carlo based blurring matrix; crosses: MAP reconstruction with the new blurring matrix.
Ultra-micro hot spot phantom
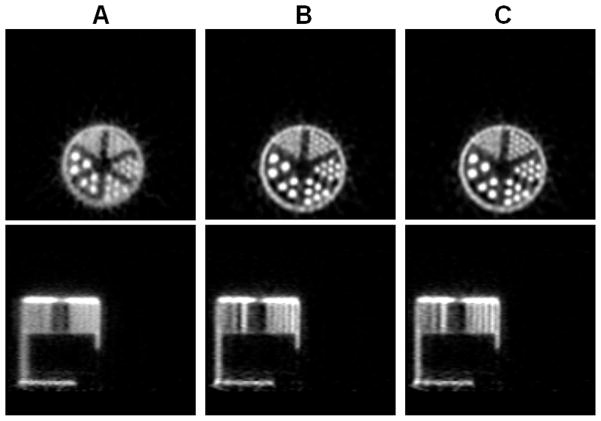
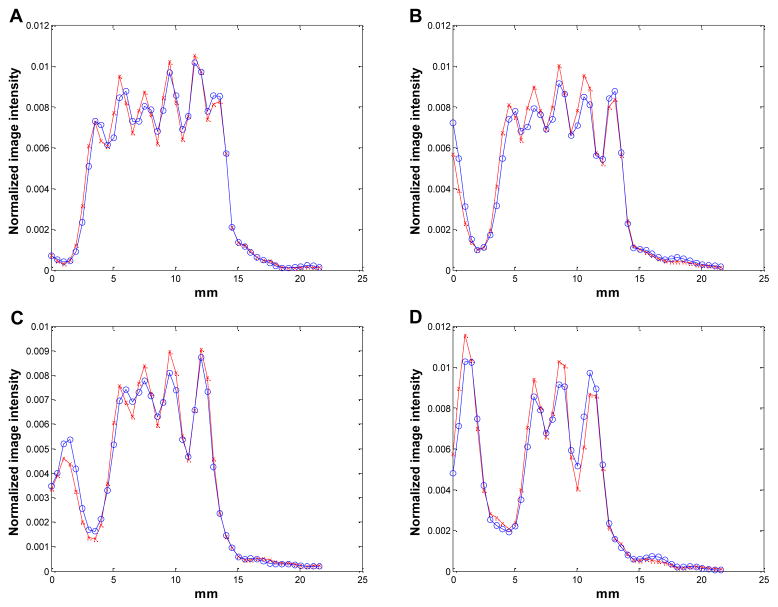
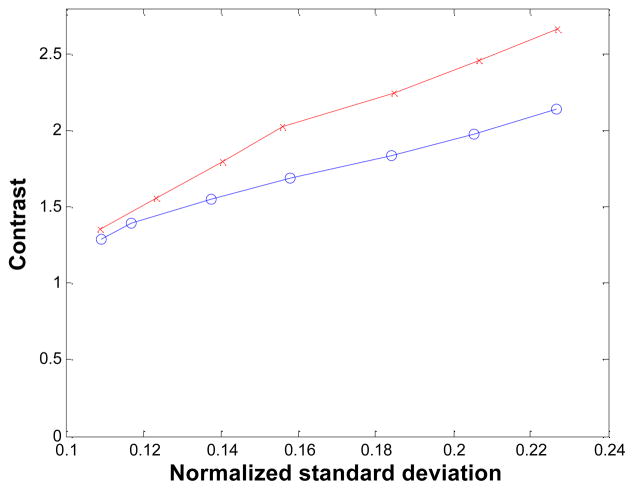
The reconstructed images of the ultra-micro hot spot phantom are shown in Figure 12 for iteration 33. Visually there is a slight improvement by the proposed method in the 1-mm line sector (upper right section of the phantom) over the MC-based result. The difference here is not as dramatic as in the 3-by-3 line phantom case. The MAP reconstruction with no blurring matrix performs poorly when compared to either of the MAP reconstructions. The radial profiles through the first four columns of the 1-mm resolution line sources are shown in Figure 13. In Figure 14, the contrast values across iterations are plotted against the noise, which was measured by the standard deviation of multiple single-pixel ROI’s (regions of interest), located far apart from each other as to avoid noise correlation, in a uniform background region (the top axial plane of the phantom) and normalized by the mean values of the ROI’s. At iteration 43, the contrast is 24.7% higher for the new blurring matrix-based result (2.67) when compared with the MC case (2.14). The MAP reconstruction without a blurring kernel was not included in the comparison because it cannot resolve the 1-mm hot spots.
Figure 12.
The reconstructed images of the ultra-micro resolution phantom. (A): MAP with no detector response model. (B): MAP reconstruction using the Monte Carlo based blurring matrix. (C): MAP reconstruction using the new blurring matrix. Top row: transaxial views; bottom row: sagittal views passing through the first column of the 1-mm line sector.
Figure 13.
The vertical profiles through the first four columns (A–D) of the 1-mm resolution section in Figure 12. Circles: MAP reconstruction with Monte Carlo based blurring matrix; crosses: MAP reconstruction with the new blurring matrix.
Figure 14.
Mean contrast of the 1-mm hot spots versus normalized standard deviation of the ultra-micro hot-spot phantom. Circles: MAP reconstruction with Monte Carlo based blurring matrix; crosses: MAP reconstruction with the new blurring matrix.
Point source phantom with warm background
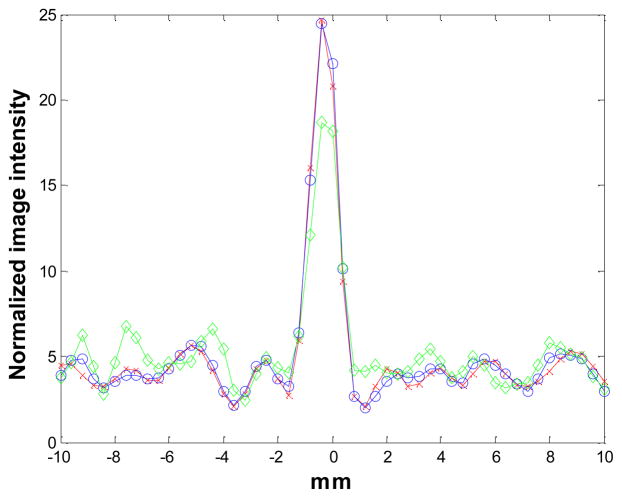
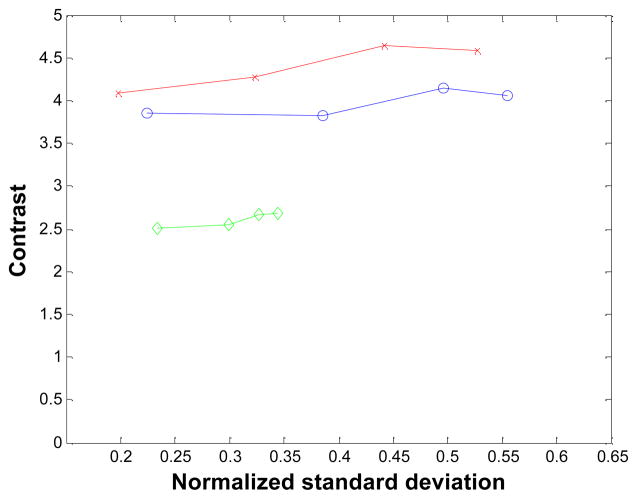
The reconstructed images of the point source phantom with a warm background are shown in Figure 15 for iteration 18 and the corresponding profiles though the point source are shown in Figure 16. The contrast of the point source reconstruction was plotted against the normalized standard deviation of the background noise in Figure 17. Different points on the curves are obtained with 18, 36, 54, and 72 MAP iterations, respectively. At all noise levels, the MAP reconstruction with the new blurring kernel leads to higher contrast, when compared with the other two MAP reconstructions. At iteration 72, the improvements in contrast are 11% and 69% compared to the MC-based blurring kernel and no blurring kernels results, respectively.
Figure 15.

The reconstructed images of the point source phantom with warm background. (A): MAP reconstruction with no detector response model. (B): MAP reconstruction using the Monte Carlo based blurring matrix. (C): MAP reconstruction using the new blurring matrix.
Figure 16.
The vertical profiles through the center of the images in Figure 15. Diamonds: MAP reconstruction with no detector response model; circles: MAP reconstruction with Monte Carlo based blurring matrix; crosses: MAP reconstruction with the new blurring matrix.
Figure 17.
Contrast of the point source versus background noise. Diamonds: MAP reconstruction with no detector response model; circles: MAP reconstruction with Monte Carlo based blurring matrix; crosses: MAP reconstruction with the new blurring matrix.
DISCUSSION
The results show that modeling sinogram blurring is important in image reconstruction for PET. The new blurring matrix produces higher contrast and improved resolution compared to the existing Monte Carlo based blurring matrix. While the improvement is not dramatic in some cases, the proposed method provides an alternative approach to estimate the blurring matrix and can take into account physical factors that are difficult to model in MC simulations. In addition, the proposed method can be directly applied to sinogram data that have undergone transformations, such as Fourier rebinning (FORE) (Defrise et al., 1997), where MC simulation is less straightforward because each element in the rebinned sinogram does not correspond to a physical line of response measurement.
In this study, we measured the point source on a 2D grid with 0.5-mm spacing. The fine sampling grid was chosen because it allows us to explore different sampling patterns. We are studying different point source configurations to see if we can obtain similar results with less number of point source positions. The blurring effects along the axial direction are not included in this study. For PET scanners operated in 2D mode, the axial blurring component is often considered as separable from the in-plane sinogram blurring (Panin et al., 2006), so it can be estimated independently from the in-plane sinogram blurring and then be incorporated in the reconstruction algorithm. For oblique sinograms in a fully 3D PET, the axial and in-plane blurring effects may be correlated with each other, in which case they should be estimated simultaneously.
We use the ML-EM algorithm to estimate the sinogram blurring matrix. No regularization was applied because the point source measurements are of high counting statistics and the noise in the point source measurements are far less than that in a normal scan. The algorithm was run for 200 iterations to get a good fit of the data. The blurring kernel estimation was run in parallel on a PC cluster because each blurring kernel can be estimated independently. The estimation took about 140 seconds per blurring kernel on a single 2GHz CPU and one hour for all 994 blurring kernels on a 40-CPU cluster. Since this is a one-time computation, the computational time is not an issue. The same sinogram blurring matrix can be used with different geometric projection matrices for reconstructions using different image voxel size, which is one advantage of the factored system matrix. Another advantage of the factored system matrix is its computational efficiency, because the system matrix retains the sparsity of the geometric projection matrix, for which forward and back projections can be efficiently calculated. The computation cost of the sinogram blurring operation is insignificant compared to geometric forward and back projections. Thus, the new blurring kernels, while having slightly larger support than the Monte Carlo based blurring kernels, do not affect the total image reconstruction time.
CONCLUSION
We have presented a method for estimating the sinogram blurring component of the system matrix for iterative image reconstruction for PET. The method has been validated using the small animal microPET II scanner. The proposed method models sinogram blurring effects along the radial and angular directions, and explicitly taking into account the block structure of the detectors. Phantom experiments show that the proposed method provides superior results in terms of resolution and contrast coefficient with no noticeable additional cost in reconstruction time when compared to MAP reconstruction using the existing Monte Carlo based blurring matrix. The proposed method is applicable to other PET scanners for human and animal imaging.
Acknowledgments
The authors would like to thank Dr. Ronald H. Huesman at Lawrence Berkeley National Laboratory for sharing the list-mode histogramming software, Dr. Stefan B. Siegel at Siemens Preclinical Solutions, Inc. for help on the list-mode data format, Dr. Bing Bai at Columbia University and Dr. Quanzheng Li at University of Southern California for help on the MAP reconstruction software. The authors would also like to acknowledge the staff of the center for molecular and genomic imaging (CMGI) at UC Davis for their assistance in the data collection and Dr. Yongfeng Yang at UC Davis for providing the point source phantom data.
This work is supported by the United States National Institutes of Health under grant no. R01 EB005322.
References
- Alessio A, Kihahan P, Lewellen T. Modeling and incorporating of system response functions in 3-D whole body PET. IEEE Trans Med Imaging. 2006;25:828–37. doi: 10.1109/tmi.2006.873222. [DOI] [PubMed] [Google Scholar]
- Alessio A, Kinahan PE, Harrison R, Lewellen T. Measured spatially variant system response for PET image reconstruction. IEEE Nuclear Science Symposium Conference Record; 2005. pp. 23–9. [Google Scholar]
- Bai B, Li Q, Holdsworth C, Asma E, Tai Y, Chatziioannou A, Leahy R. Model-based normalization for iterative 3D PET image reconstruction. Physics in medicine & biology. 2002;47:2773–84. doi: 10.1088/0031-9155/47/15/316. [DOI] [PubMed] [Google Scholar]
- Bai B, Smith A, Newport D, Leahy R. Effect of modeling block detector structure in smal animal PET scanners. IEEE Nucl. Sci. Symp. Med. Imag. Conf; Rome. 2004. [Google Scholar]
- Beekman F, denHarder J, Viergever M, vanRijk P. SPECT scatter modelling in non-uniform attenuating objects. Physics in medicine & biology. 1997;42:1133–42. doi: 10.1088/0031-9155/42/6/010. [DOI] [PubMed] [Google Scholar]
- Beekman F, Slijpen E, de Jong H, Viergever M. Estimation of the depth-dependent component of the point spread function of spect. Med Phys. 1999;26:2311–22. doi: 10.1118/1.598745. [DOI] [PubMed] [Google Scholar]
- Defrise M, Kinahan PE, Townsend D, Michel C, Sibomana M, Newport D. Exact and approximate rebinning algorithms for 3-D PET data. IEEE Trans Med Imaging. 1997;16:145–58. doi: 10.1109/42.563660. [DOI] [PubMed] [Google Scholar]
- Ficaro E, Corbett J. Advances in quantitative perfusion spect imaging. Journal of nuclear Cardiology. 2004;11:62–70. doi: 10.1016/j.nuclcard.2003.10.007. [DOI] [PubMed] [Google Scholar]
- Ficaro E, Fessler JA, Shreve P, Kritzman J, Rose P, Corbett J. Simultaneous transmission/emission myocardial perfusion tomography: Diagnostic accuracy of attenuation-corrected 99mTc-Sestamibi single-photon emission computed tomography. Circulation. 1996;93:463–73. doi: 10.1161/01.cir.93.3.463. [DOI] [PubMed] [Google Scholar]
- Frese T, Rouze N, Bouman C, Sauer K, Hutchins G. Quantitative comparison of FBP, EM, and Bayesian reconstruction algorithm for the IndyPET scanner. IEEE Trans Med Imaging. 2003;22:258–76. doi: 10.1109/TMI.2002.808353. [DOI] [PubMed] [Google Scholar]
- Furenlid L, Wilson D, Yi-chun C, Hyunki K, OPietraski P, Crawford M, Barrett HH. FastSPECT II: a second-generation high-resolution dynamic SPECT imager. IEEE Trans Nuclear Science. 2004;51:631–5. doi: 10.1109/TNS.2004.830975. [DOI] [PMC free article] [PubMed] [Google Scholar]
- Gilland D, Jaszczak R, Wang H, Turkington T, Greer K, Coleman R. A 3D model of non-uniform attenuation and detector response for efficient iterative reconstruction in SPECT. Physics in medicine & biology. 1994;39:547–61. doi: 10.1088/0031-9155/39/3/017. [DOI] [PubMed] [Google Scholar]
- Hutton B. Cardiac single-photon emission tomography: is attenuation correction enough? European Journal of Nuclear Medicine. 1997;24:713. doi: 10.1007/BF00879656. [DOI] [PubMed] [Google Scholar]
- Hutton B, Osiecki A, Meikle S. Transmission-based scatter correction of 180 degrees myocardial single-photon emission tomography studies. European Journal of Nuclear Medicine. 1996;23:1300–8. doi: 10.1007/BF01367584. [DOI] [PubMed] [Google Scholar]
- Kadrmas D, Dibella E, Huesman R, Gullberg G. Analytical propagation of errors in dynamic SPECT: estimators. degrading factors, bias and noise. Physics in medicine & biology. 1999;44:1997–2014. doi: 10.1088/0031-9155/44/8/311. [DOI] [PMC free article] [PubMed] [Google Scholar]
- King M, Tsui B, Pan T. Attenuation compensation for cardiac single-photon emission computed tomography imaging. 1. Impact of attenuation and methods of estimating attenuation maps. Journal of Nuclear Cardiology. 1995;2:513–24. doi: 10.1016/s1071-3581(05)80044-3. [DOI] [PubMed] [Google Scholar]
- King M, Xia W, DJD, Pan T, Villegas B, Dahlberg S, Tsui B, Ljunberg M, Morgan H. A Monte Carlo investigation of actifacts caused by liver uptake in single-photon emission computed tomography perfusion imaging with technetium 99m-labeled agents. Journal of nuclear Cardiology. 1996;3:18–29. doi: 10.1016/s1071-3581(96)90020-3. [DOI] [PubMed] [Google Scholar]
- Laurette I, Zeng G, Welch A, Christian P, Gullberg G. A 3D ray-driven attenuation, scatter and geometric response correction technique for SPECT in inhomogeneous media. Physics in medicine & biology. 2000;45:3459–80. doi: 10.1088/0031-9155/45/11/325. [DOI] [PubMed] [Google Scholar]
- Mumcuoglu EU, Leahy R, Cherry SR, Hoffman E. Accurate geometric and physical response modeling for statistical image reconstruction in high resolution PET. IEEE Nuclear Science Symposium Conference Record; Anaheim, CA. 1996. pp. 1569–73. [Google Scholar]
- Panin V Kehren F, Rothfuss H, Hu D, Michel C, Casey M. In: Seibert J, editor. PET reconstruction with system matrix derived from point source measurements; IEEE Nuclear Science Symposium Conference Record; 2004. pp. 2483–7. [DOI] [PubMed] [Google Scholar]
- Panin V, Rothfuss H, Hu D, Michel C, Casey M. Fully 3-D PET reconstruction with system matrix derived from point source measurements. IEEE Trans Med Imaging. 2006;25:907–21. doi: 10.1109/tmi.2006.876171. [DOI] [PubMed] [Google Scholar]
- Qi J. Maximum-likelihood estimation of detector response for PET image reconstruction. Proc. IEEE EMBS Annual International Conference; 2006. pp. 2530–3. [DOI] [PubMed] [Google Scholar]
- Qi J, Leahy R, Cherry SR, Chatziioannou A, Farquhar T. High-resolution 3-D Bayesian image reconstruction using the microPET small-animal scanner. Physics in medicine & biology. 1998;43:1001–13. doi: 10.1088/0031-9155/43/4/027. [DOI] [PubMed] [Google Scholar]
- Rafecas M, Mosler B, Dietz M, Pogl M, Stamatakis A, McErlroy DP, Zieger SI. Use of a Monte-Carlo based probability matrix for 3-D reconstruction of MADPET-II data. IEEE Trans Nuclear Science. 2004;51:2597–605. [Google Scholar]
- Selivanov V, Picard Y, Cadorette J, Rodrigue S, Lecomte R. Detector response models for statistical iterative image reconstruction in high resolution PET. IEEE Trans Nuclear Science. 2000;47:1168–75. [Google Scholar]
- Tai Y, Chatziioannou A, Yang Y, et al. MicroPET II: design, development and initial performance of an improved microPET scanner for small-animal imaging. Physics in medicine & biology. 2003;48:1519–37. doi: 10.1088/0031-9155/48/11/303. [DOI] [PubMed] [Google Scholar]
- Tohme M, Qi J. High-Resolution Image Reconstruction for PET using Estimated Detector Response Functions. IS&T/SPIE 18th Annual Symposium; San Jose, CA. 2007. [Google Scholar]
- Tsui B, Frey E, Zhao X, Lalush D, Johnston R, McCartney W. The importance and implementation of accurate 3D compensation methods for quantitative SPECT. Physics in medicine & biology. 1994a;39:509–30. doi: 10.1088/0031-9155/39/3/015. [DOI] [PubMed] [Google Scholar]
- Tsui B, Zhao X, Gregoriou G, Lalush D, Frey E, Johnston R, McCartney W. Quantitative cardiac SPECT reconstruction with reduced image degradation due to patient anatomy. IEEE Trans Nuclear Science. 1994b;41:2838–44. [Google Scholar]
- Veklerov E, Lacer J, Hoffman E. MLE reconstruction of a brain phantom using a Monte Carlo transition matrix and a statistical stopping rule. IEEE Trans Nuclear Science. 1988;NS-35:603–7. [Google Scholar]
- Welch A, Gullberg G. Implementation of a model-based non-uniform scatter correction scheme for SPECT. IEEE Trans Med Imaging. 1998;16:717–26. doi: 10.1109/42.650869. [DOI] [PubMed] [Google Scholar]


