

Abstract
For people with type 1 diabetes and severe hypoglycemic unawareness, islet transplants offer hope for improving the quality of life. However, islet cell death occurs quickly during or after transplantation, requiring large quantities of islets per transplant. The purpose of this study was to determine whether poor function demonstrated in large islets was a result of diffusion barriers and if removing those barriers could improve function and transplantation outcomes. Islets were isolated from male DA rats and measured for cell viability, islet survival, glucose diffusion and insulin secretion. Modeling of diffusion barriers was completed using dynamic partial differential equations for a sphere. Core cell death occurred in 100% of the large islets (diameter >150 µm), resulting in poor survival within 7 days after isolation. In contrast, small islets (diameter <100 µm) exhibited good survival rates in culture (91%). Glucose diffusion into islets was tracked with 2-NBDG; 4.2 µm/min in small islets and 2.8 µm/min in large islets. 2-NBDG never permeated to the core cells of islets larger than 150 µm diameter. Reducing the diffusion barrier in large islets improved their immediate and long-term viability in culture. However, reduction of the diffusion barrier in large islets failed to improve their inferior in vitro insulin secretion compared to small islets, and did not return glucose control to diabetic animals following transplantation. Thus, diffusion barriers lead to low viability and poor survival for large islets, but are not solely responsible for the inferior insulin secretion or poor transplantation outcomes of large versus small islets.
Key words: diabetes, islets, insulin, diffusion, transplantation
Introduction
Islet transplantation has improved the quality of life for people with type 1 diabetes and hypoglycemic unawareness. Following islet transplantation, there are reports of insulin independence, improved glycemic control, improved hypoglycemia score and scores on the lability index in the majority of recipients.1 For the person with type 1 diabetes, that translates into fewer injections and decreased numbers of hypoglycemic events.2 However, death or nonfunction of a major portion of transplanted islets occurs quickly during or after transplantation, requiring exorbitant quantities of islets from the donor pancreata.3 While the reasons for the requirement of multiple donors are not completely clear, one contributing factor is the vulnerability of islets immediately after transplantation.4
Historically, large islets have been preferred for human islet transplantation, because they provided more total islet volume/donor pancreas. However, core cell necrosis has been shown in large islets due to lack of oxygen diffusion.5 Our previous work demonstrated that large isolated islets have poor oxygen utilization, poor survivability following isolation, and secrete less insulin than small islets when normalized for the same volume.5,6 When diabetic rats were transplanted with a marginal mass of large islets, none of them became insulin independent. In contrast, when an equivalent mass of small islets was transplanted into diabetic rats, 80% became insulin independent and remained that way for the 2 month duration of the experiment.
Subsequently, Lehmann et al. determined that small human islets had a higher survival rate during both normoxic and hypoxic culture conditions with a preferential loss of large islets after 48 hours in hypoxic culture.7 Ultimately, they demonstrated better performance of human islet transplants with a higher percentage of small versus large islets.
The observed differences in the viability and function of large compared to small islets have led to the question; What characteristics of the large islets make them less suitable for islet transplantation? We hypothesize that diffusion barriers in large islets after isolation result in a loss of nutrition and cell signaling, leading to decreased function. The following experiments test this hypothesis by comparing core cell death, islet survival, function, glucose diffusion and transplant outcomes based on the diffusion limitations of the islet.
Results
Core cell death.
The observation of core cell death within large islets was shown previously to occur in islets over 200 µm in diameter.8,9 In published reports,5,6 we found signs of core cell death in even smaller islets of 150 µm in diameter, but until now had not quantified the degree of dead islets. We defined core death as a region in the center of the islet where >50% of the cells were dead, which is a more stringent criteria than used by other laboratories.8 Even with the stringent criteria, large numbers of islets illustrated core cell death as shown in Figure 1A where dead cells are red/yellow (death due to necrosis) or green (death due to apoptosis). This assay measures both membrane integrity and fragmentation of DNA with double labeling by Yo-Pro-1 and propidium iodide. Core cell death is different from overall islet viability, which is calculated as the percentage of dead cells throughout the islet. Core cell death was not observed in small islets and was noted in 18% of large islets within hours of isolation. By the third day after isolation, 54% of the large islets had core cell death compared to 37% in the small islets (N = 100). To verify these findings, additional live/dead assays, relying on esterase activity were completed. Calcein AM is membrane permeant, but will only fluoresce in cells containing healthy esterases. Calcein assays were combined with Sytox, which can only enter a cell with a compromised plasma membrane. The Calcein/Sytox assays also confirmed core cell death (Fig. 1B) at the same rate noted using Yo-Pro-1 and propidium iodide.
Figure 1.

Core cell death in large islets. Composite images of large islets stained for cell viability using two different live/dead stains. (A) Islet assayed with Yo-Pro-1 and Propidium Iodide, and overlaid with transmitted light image. Green cells indicate cellular death via apoptosis. Red and yellow staining indicates cell death from necrosis. The figure shows a typical large islet with core cell death (>50% of cells dead within core area) after 2 days of culture. Staining was performed using live/ dead fluorophores as described in Methods. (B) Large islet stained with calcein AM and sytox. Green staining indicates live cells; red indicated dead cells. Both staining procedures illustrate dead cells within the core of the islets. Both islets were approximately 200 µm in diameter.
When large islets were maintained in culture for more than 3 days, fluorescence from core cell death was replaced by a complete lack of cells in the center of the islet. Dithizone staining, selective for endocrine cells, best illustrated the loss of core cells that was seen predominantly in large islets (Fig. 2B). Criterion for identification of lost core cells was a central region void of cells of at least 15 µm in diameter. Seven days after isolation 48% of all large islets demonstrated empty core regions, while only 15% of small islets had signs of empty cores. Figure 2A shows a typical small islet with no loss of core cells. While Figure 2B illustrates two islets of 200 or 150 µm in diameter, both showed core cell loss after 7 days of culture. Eight days following isolation, all of the large islets remaining in culture (100%) had signs of core cell death or lost cells compared to 48% of the small islets.
Figure 2.
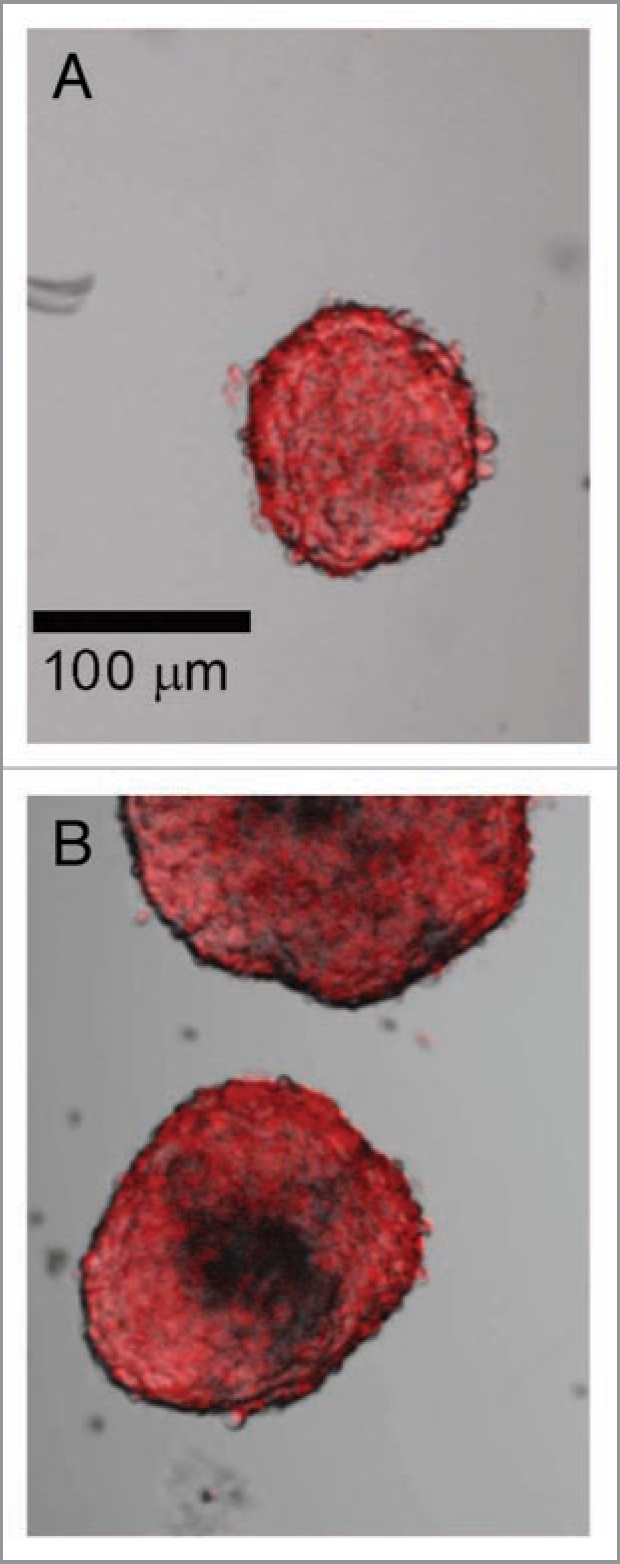
Loss of core cells from large islets in culture. (A) Dithizone staining of a small islet shows a relatively homogenous distribution of endocrine cells after 7 days of incubation, which was typical for islets under 100 µm in diameter. (B) Large islets (both >150 µm diameter) showed a loss of core cells over the same time period. Scale bar the same for both images. (N = 68 islets from six rats).
Survival rates for large and small islets.
Not only did large islets demonstrate core cell death, they had dramatic losses in total islet survival when maintained in culture for 7 days with little change in the number of small islets even after 14 days of culture. After 7 days in culture, the number of islets less than 100 µm in diameter decreased by a total of 9%. In contrast, 48% of the islets in the large category (over 150 µm diameter) were lost between day 1 and 7 in culture (N = 3218 starting islets).
Models of diffusion limits.
To determine whether the diffusion barrier to oxygen and other nutrients was responsible for the core cell death in large islets, the viability images were used to create a model of diffusion limits. Dynamic partial differential equations for a spherical islet were solved numerically using finitedifference method in spherical coordinates. A forward approximation in time and central difference in one-dimensional space (r and z, respectively) were used. The mathematical programming was conducted using MATLAB (MATLAB 7.3, The MathWorks). As a first effort, we assumed that oxygen consumption could be approximated by first order kinetics. The value reported in the literature for the effective diffusion coefficient (Deff) of oxygen in islets is 1.6 × 10⁻⁵ cm2/s.10 However, the value of Deff used in this model (1.6 × 10⁻⁸ cm2/s) was significantly less than the value reported in the literature in order to match our experimental data on core cell death rates. Lowering the Deff value resulted in an increase in the duration required to achieve the steady state (∼0.4 h) (Fig. 3), which corresponded to our experimental observations more closely.
Figure 3.

Modeling of poor survival of large islets. Modeling of diffusion limitations in intact islets illustrates the rapid oxygen deprivation experienced by the core cells. The upper panel provides an example of a small islet (60 µm radius). The lower panel provides a model of a large islet (300 µm radius) at steady state. Coordinates are in µm. Scale bar shows relative oxygen concentration with red indicating critical oxygen concentrations resulting in cell death, green indicates oxygen concentrations yielding viable cells.
Experimentally, core death was observed to proceed in the order of hours and the modeled trend of oxygen depletion was indicative of the profile of cell death. Bulk oxygen concentration was approximated to 38 mmHg and the critical oxygen concentration resulting in cell death was estimated as 10% (3.8 mmHg). The oxygen consumption term (K) was estimated at 9 × 10⁻³ mg/ mL-h by using the critical radius calculation (rcrit = √(6.Deff.[O2]bulk/K) and experimental observations. Experiments conducted on spherical islets showed the absence of dead core for any islet of size less than 50 µm, indicating the critical radius to be close to 50 µm. The value of K was adjusted to the aforementioned value, as a fit parameter resulting in a critical radius of 54.1 µm for a spherical islet. Figure 3 illustrates the diffusion limitations in a spherical islet with a 120 µm diameter (top row) and a 600 µm diameter (bottom) over time. The red regions indicate the area of critical oxygen shortage.
Glucose diffusion and uptake.
With the potential for oxygen deprivation in the islet core shown by mathematical modeling and viability assays, we set out to determine whether the diffusion of other molecules such as glucose were restricted in large islets. Modeling of glucose uptake, which relies on active transport and the presence of secondary molecules like insulin, is complex and hampered with assumptions. Instead the direct rate of glucose into intact islets was measured, using a fluorescent glucose analog, 2-[N-(7-nitrobenz-2-oxa-1,3-diazol-4-yl)amino]-2-deoxy-D glucose (2-NBDG). Isolated islets were exposed to 20 mM 2-NBDG and the rate of glucose movement into the islet monitored with confocal microscopy (Fig. 4). Initially there was no fluorescence in the field, but as the fluorescent glucose was perfused into the chamber, the media surrounding the islets became fluorescent, allowing for calculations of the rate of diffusion/uptake of glucose into intact islets. After 18 minutes of incubation in 2-NBDG, the center of the small islets showed significant staining with only pockets of low glucose regions that remained for the length of the experiment (1 hour) (Fig. 4A). In contrast, similar time periods for large islets showed little, if any, infusion of glucose into the center of the islet (Fig. 4B). Even an hour incubation in 2-NBDG failed to demonstrate permeation of the glucose into the core of the large islet. Three-dimensional reconstruction of the confocal images showed little penetration of 2-NBDG into any portion of the islet past the outer 4–5 layers of cells.
Figure 4.

Glucose does not diffuse into core of isolated large islets. (A) The left image illustrates glucose uptake into the small islet (70 µm diameter) after one hour incubation in 20 mM 2-NBDG. The image on the right is the same islet shown as an inverted transmitted light image so that the perimeter could be clearly identified. (B) The large islet (180 µm diameter) shows clear regions within the core where no 2-NBDG was present even after one hour exposure. Scale bar in (A) also refers to the image in (B). (C and D) A 70 kD fluorescent dextran could not enter either small (C, 40 µm diameter) or large (D) islet (160 µm diameter) after one hour of incubation.
The average rate of glucose diffusion/uptake into the periphery of the islet was extremely slow. 2-NBDG entered the peripheral region of the small islets at a rate of 4.2 µm/min, while in large islets the rate was 2.8 µm/min. The results were verified in over 90 islets from four different animals. These findings are likely to represent the rates of transport molecules and metabolism of glucose by the outer layers of cells, along with simple diffusion of the 2-NBDG into the pericellular spaces.
Control experiments were conducted to verify that the fluorescence measured at the center of the small islets was not due to out-of-focus fluorescence from the media. 2-NBDG was replaced with a 70 kD fluorescent dextran, which is too large to enter the islet periphery, and from 5 min to 2 hours later, images were captured. Figure 4C and D show typical images obtained when intact islets were incubated in the 70 kD fluorescent dextran. Noteworthy is the fact that no fluorescence was measured within the boundary of the islet in 70 kD fluorescent dextran regardless of the size of the islet (N = 28 islets).
Reduction of diffusion barrier improves viability.
In order to test the effects of poor diffusion (high diffusion barriers) in isolated islets, the large islets were converted into smaller, more porous segments with lower diffusion barriers. Figure 5A shows an example of a porous islet segment made from a large islet after exposure to papain (HBSS/PAPL) for 10 minutes. The average diameter of the porous islets was 59.8 ± 17.2 µm (N = 350) compared to 400.4 ± 10.7 µm (N = 388) for large intact islets prior to exposure to HBSS/PAPL. The majority of porous islet segments maintained a spherical shape as shown in Figure 5A, although some did open into irregularly-shaped segments (Fig. 5B). Over 95% of all cells within the porous islets were identified as endocrine by dithizone staining (Fig. 5B).
Figure 5.

Characteristics of porous islets. (A) Typical porous islet segment is stained with YO-PRO-1 and propidium iodide indicating apoptotic cells in green and necrotic cells in red. Minimal cell death was observed after large islets were made porous. (B) Typical porous islet segment stained for endocrine cells using dithizone. (C) Optical density measurements were obtained from intact small islets and porous islet segments made from large islets. Islets and segments with diameters from 35 to 75 µm were included in the calculation. The optical density values were normalized by the diameter of each islet. *indicates significance (p < 0.008). (D) Viability of large islets, small islets and porous islet segments made from large islets was evaluated after islets were maintained in culture for 7 days. N = 60 islets in small and large groups each, and 41 porous islets segments. *indicates statistical difference of large islets compared to small and porous islets (p < 0.02). (E) All porous islet segments were completely permeated with glucose (2-NBDG) within 2 minutes of exposure. Typical result is shown.
The porosity of the islets was verified using the UnionBiometrica’s COPAS biosorter. Optical density (OD, measured by light extinction) was used as an indicator of how densely cells were packed within an islet. OD from 1,498 individual porous and 1,299 intact islets was captured. Comparisons were only made between porous islets and intact islets of the same dimensions so the final analysis was completed on 165 islets and 204 porous segments. Since size alone affects OD, the OD values were normalized by dividing by the individual islet or segment diameter. The intact islets had a 22% greater optical density compared to segments of the same diameter (Fig. 5C).
Viability assays conducted on porous islets showed that they had few dead cells (Fig. 5A), and the percentage of live cells was similar to intact small islets over a 7 day period (Fig. 5D). The viability experiments were performed using fluorophores that measure membrane integrity, DNA fragmentation, as well as intracellular esterase activity. In contrast, large islet viability was below 60% after 7 days in culture. Diffusion experiments with 2-NBDG indicated complete perfusion of glucose throughout each porous islet segment tested (N = 67 porous islets) as shown in Figure 5E. This finding, along with the OD measurements, indicates that the segments made from large islets were more porous with improved diffusion.
Insulin secretion from porous islet segments.
Static insulin secretion experiments were completed on the intact small, large and porous islets. While viability improved by decreasing the diffusion barrier, insulin secretion, normalized per islet equivalents, did not. Figure 6 illustrates clearly the superiority of intact small islets to secrete insulin compared to intact large islets, as we reported previously.6 However, decreasing the diffusion barrier in large islets by converting them into porous islet segments did not improve glucose-stimulated insulin secretion as predicted. There was a statistically significant difference in the basal rate of insulin secreted (in 3 mM glucose) with porous segments, made from large islets, secreting more insulin than intact large islets (Fig. 6). However, there was no statistical difference between the two groups in conditions of high glucose (20 mM).
Figure 6.

Insulin secretion from porous islets made from large islets. Insulin secretion, normalized for islet volume, was significantly higher in small islets compared to the other groups in low (3 mM) and high (20 mM) glucose. There was a significant difference between insulin secretion from porous islet segments and large islets in low glucose (p < 0.02), but no difference in high glucose. N = six separate repetitions using seven animals. * indicates significant difference between insulin secretion from large and porous islets at low glucose. #indicates small islets released more insulin than all other groups at each glucose concentration.
Porous islet transplantation.
Streptozotocin-induced diabetic DA rats received a marginal mass (1,000–1,200 IE) under the kidney capsule of syngeneic (1) porous islet segments made from large islets, (2) intact small islets, or (3) intact large islets. Blood glucose levels in rats with transplants were monitored for nearly 6 weeks. Figure 7 shows the outcomes of the five transplants using porous segments compared to those transplant recipients of large and small islets as previously reported.6 Initially all animals were hyperglycemic. All of the recipients of porous islets remained hyperglycemic after transplantation (five of five). This outcome is similar to that of the intact large islet transplants (20% normoglycemia) and in sharp contrast to small islet transplants with 80% long-term normoglycemia. Thus, decreasing the diffusion barrier and increasing viability of large islets by making them porous did not improve the transplantation outcome in vivo.
Figure 7.

Transplantation of porous islets. Diabetic rats received islet transplantations using small or large islets, or large islets that were made into porous segments (porous) islets. Animals receiving large intact islets or porous large islet segments failed to demonstrate normal glucose regulation while 80% of the diabetic rats receiving intact small islets attained normal glycemia for the duration of the experiment. X axis shows days after the transplantation.
Porous islet grafts under the kidney capsule were removed 40 days after transplantation, fixed and immunolabeled for insulin. Figure 8A provides a representative section with high levels of immunoreactivity for insulin in the graft taken from the animals that received small islets only and were normoglycemic 40 days after transplant. A graft taken from a diabetic rat receiving only large islets is shown in Figure 8B, with dramatically fewer insulin-positive cells. When the diffusion barrier in the large islets was reduced, making them more porous prior to transplantation, the number of insulin-positive cells was still low (Fig. 8C). Thus, decreasing the diffusion barrier improved the viability of islets in vitro, but had no effect on the outcome of the transplants into diabetic rats or survival of the porous islets following transplantation. Islets with large diameters at the time of isolation, demonstrated poor outcomes following transplantation into diabetic rats even when the diffusion barrier in the large islets was decreased.
Figure 8.
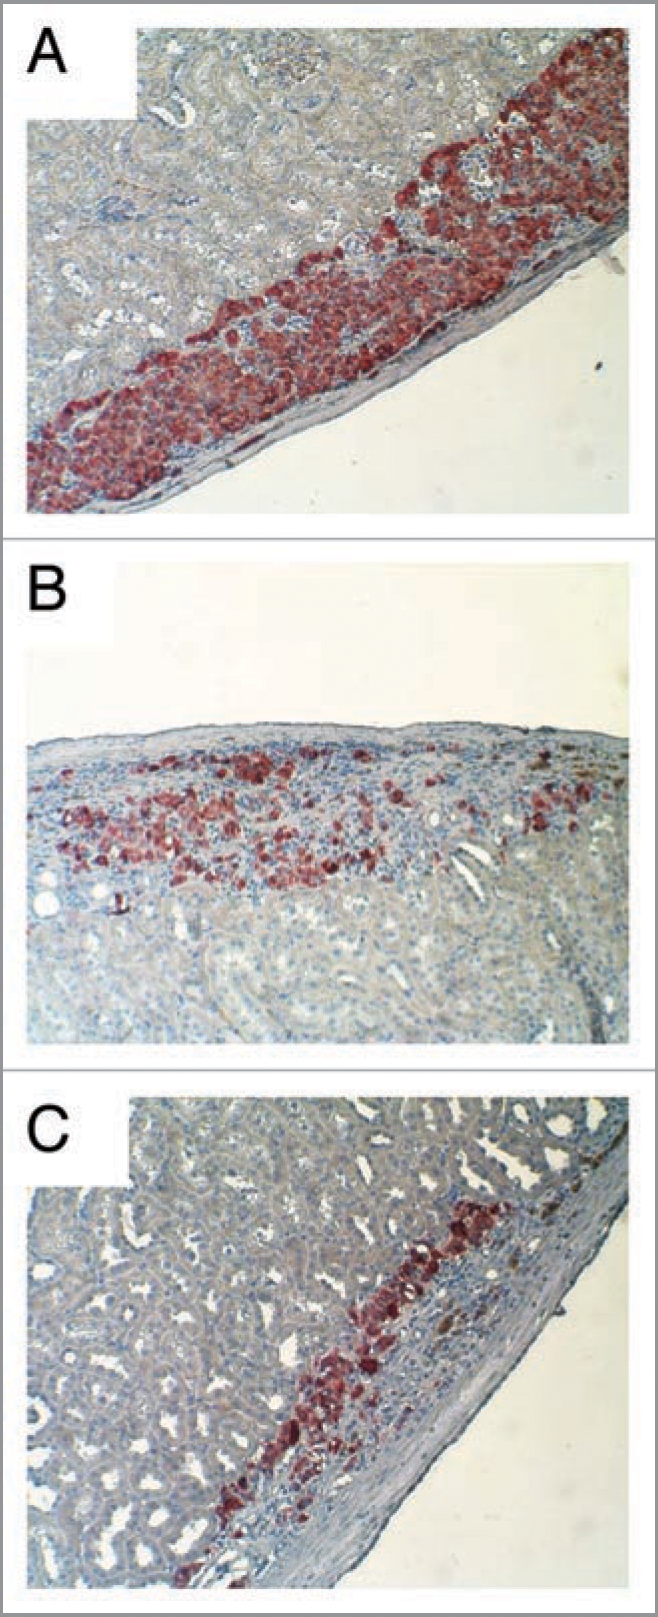
Insulin staining of transplant graft. (A) Insulin immunostaining (red) illustrated dense insulin-positive cells at the graft site of the rat receiving only small islets. (B) Graft sites receiving only large islets showed few insulin-positive cells. (C) Graft sites receiving large islets that were made porous also showed few insulin-positive cells.
Discussion
The results of this work clearly show that core cell death occurs in large islets rapidly after isolation. The conclusion is supported by at two different cell viability assays as well as dithizone staining showing a loss of cells in the core only 3–5 days after isolation and poor long-term islet survival of large islets. In exploring why the large islets perform poorly when isolated, the experimental results point to significant diffusion barriers in islets that preferentially affect the islets with large diameters, leading to core cell death and eventual loss of entire islets. Reducing the diffusion barrier in large islets improved their immediate and longterm viability in vitro. Surprisingly, the reduced diffusion barrier did not alter their inferior glucose-stimulated insulin secretion compared to intact small islets when normalized for islet volume. Further, reducing the diffusion barrier failed to improve glycemic control for the recipient diabetic rats.
When considering diffusion barriers and their effect on islet function for transplantation, we considered two molecules of importance. Oxygen diffusion to maintain cell viability throughout the islet, and glucose diffusion essential to islet function, specifically the release of insulin. Modeling based on our core cell death assays indicated extremely poor oxygen diffusion into the core of isolated large islets (Figs. 1–3). Direct measurements of glucose diffusion likewise illustrated significant barriers to the movement of glucose into the core of the islet past the outer 4–5 layers of cells (Fig. 4). Diffusion barriers in large islets have been described previously for gases such as oxygen.11 Studies have shown, using nuclear magnetic resonance spectroscopy, that overnight incubation of islets using methods common to islet transport procedures, exposed them to severe oxygen limitations that caused irreversible cell damage.12 Prediction of glucose uptake into the islet are more complex from a mass transfer and modeling perspective as glucose uptake relies on changes with local insulin levels and the membrane bound glucose transporters and accessory proteins.13 For this reason, two approaches were used in this study; (1) the measurement of cell death in the core of the islet and the modeling of oxygen diffusion into the core of the islet associated with the viability of the cells, and (2) direct measurement of glucose into the intact islets using 2-NBDG. The results of both sets of studies illustrate significant diffusion barriers that lead to non-viable tissue.
Previously glucose diffusion rates into large and small islets were measured using needle probes.14 Like the results reported here, previous studies reported that a long period of time was needed to reach steady-state levels of glucose within an islet likely due to a combined effect of glucose consumption by the peripheral cells and very slow diffusion rates. Consistent with our results, they reported a slower diffusion rate into larger islets, which they described as >250 µm diameter, compared to smaller islets. This report differed from the previously published papers when measuring the core glucose concentration as Kauri et al. found that within the core of large islets, glucose was present in low concentrations.14 Our results suggest that even in 20 mM external 2-NBDG, glucose permeated only the outer 4–5 layers of cells. The difference is likely explained because Kauri et al. used a needle probe to measure internal glucose concentrations, which in itself creates a fluid channel into the islet.14 In contrast, our method left the islets completely intact for all measurements. Admittedly, the method used here also has limitations, as it relies on visualization through the core of the islet, which even with confocal microscopy can be difficult. Thus, when using confocal microscopy, we only examined diffusion limits and viability for islets under 250 µm diameter. By staying within this range for all confocal microscopy experiments, we were assured with our system that we could image clearly the cells within the core of the large islets. While it is also possible that the fluorescently-tagged glucose does not enter the islet in the same manner as native glucose, previous report indicate that NDBG uses the same cellular import pathways as native glucose, the GLUT transporters. In fact, NBDG has a higher binding affinity to GLUT1 than native glucose.13,15 Studies with pancreatic cells have shown that NBDG is transported into beta cells through GLUT2 and induces a typical glucose-stimulated rise in intracellular calcium.16 Given the difference in the techniques used in the two reports, our similar findings are noteworthy, and should give pause to transplant sites using predominantly large islets for transplantation into persons with type 1 diabetes.
Work from the early 1990s demonstrated that any decrease in the partial pressure of oxygen, due to diffusion barriers, reduced the amount of insulin secreted from islets.17 More recent work has indicated that beta cell communication is optimal in islets that are smaller in size.18 Subsequently, we hypothesized that decreasing the diffusion barrier would improve the amount of insulin secreted from large islets. Surprisingly, creation of smaller porous islets from large islets did not improve glucose-stimulated insulin secretion. Furthermore, transplanting a marginal mass of the porous islets into diabetic rats did not reverse diabetes in any of the animals. Admittedly, this is the first reported attempt to transplant porous, or some might consider “fragmented,” islets into diabetic animals. It is possible that the porous islets, simply due to the additional 10 minute exposure to papain, might be more fragile during the transplantation procedure, resulting in poor transplant outcomes. However, results from viability experiments indicated that they were healthy after the process prior to the transplantation.
Alternatively, the lack of improvement in the large islets with a lowered diffusion barrier relies on the important role of the islet capillary system to deliver insulin. After isolation of islets from the native pancreas, the complex intra-islet capillary network collapses rapidly due to vascular endothelial cell death.19 In the native pancreas, it is estimated that each beta cell is in contact with a vascular endothelial cell20 from capillaries taking a torturous path through the islet.19 After transplantation the revascularization process is slow, beginning within two to four days.21,22 However, the transplanted islets are never fully vascularized.
Mature vessels formed in transplanted islets have lower oxygen tension levels, are not as dense as native vessels23,24 and often are found around the graft perimeter.19
The capillary beds are important in the transport of insulin out of the core region of the islet. Insulin exocytosis uses two separate pathways to transport insulin out of the islet. Either the insulin is released into the extracellular space and diffuses out of the islet, or it directly enters the islet capillary through the fenestration of the endothelium.25–27 It is possible that small islets might release more insulin directly into the extracellular space, relying on diffusion. Thus, isolation could result in similar cellular glucose-stimulated insulin release between large and small islets, but a decreased ability of large islets to transport the insulin to the extra-islet compartment where it was measured. Perhaps basal insulin release from large islets uses direct exocytosis into the extracellular milieu, while glucose-stimulated insulin release requires functioning vessels and this would explain the increased basal insulin release from the porous large islets with no improvement in glucose-stimulated insulin release (Fig. 6). However, these hypotheses have yet to be tested. In either case, transplanting isolated large islets into a person with type 1 diabetes would not be the optimal way to produce insulin independence.
One of the limitations is that the procedure to make porous islets may have actually damaged some cells resulting in lower insulin secretion, although this seems unlikely because long-term viability was improved in porous islets (Fig. 5C). Additionally, basal insulin release was actually higher in the porous islets when compared to the intact large islets. It was only the glucose-stimulated insulin release that was not improved by the procedures used to reduce the diffusion barriers inherent in large islets.
The final hypothesis explaining the lack of improvement in glucose-stimulated insulin secretion with a decreased diffusion barrier is that beta cells within the large and small islets have inherent differences that are preserved with the formation of the porous islet segments. Functional heterogeneity between individual beta cells within a pancreas has long been established.28,29 Heterogeneity between islets has also been demonstrated with some characteristics associated with islet size.30 For example, previous studies concluded that small islets relied solely on voltagegated calcium channels for insulin release, while large islets were less dependent.30
The shortage of donors and the exceptional amount of tissue necessary for successful islet transplants limits the procedure’s usefulness as a widely-available therapeutic intervention. While stem cells or animal sources may eventually produce unlimited supplies of tissue for transplant, improved understanding of islet biology will allow more rapid adjustments in the current transplant procedure that may improve outcomes since a loss of islets after isolation is commonly observed,31 and negatively affects transplant outcomes. The results here suggest that the diffusion barrier in large islets leads to core cell death followed by complete loss of the islets. Decreasing the diffusion barrier improved viability of the large islets in vitro, but did not enhance the glucose-stimulated insulin secretion that was deficient in large islets compared to small. The reason for this difference is yet undefined, but deserves in-depth analysis. Methods utilized in this study relied on fluorescent viability assays, islet survival counts, insulin secretion and transplantation outcomes. Additional studies are needed to determine whether other methods of reducing the diffusion barrier could rescue the large islet insulin secretion levels. Sorting out functional differences in islet subpopulations based on islet geometry and/or inherent characteristics of the cells is at the heart of understanding basic islet biology and a necessary step for a final cure for diabetes.
Materials and Methods
Rat islet isolation and separation.
Islets were isolated using our previously published procedures.6 Briefly, the pancreata of adult, male DA rats were cannulated in situ via the common bile duct, and distended with cold collagenase (CLS-1, Worthington Biochemical Corp., in Leibovitz L15 at 450 U/ml). The distended pancreas was excised and incubated for 20–30 min with gentle tumbling in a 37°C incubator. The contents of the tube were placed in diluted ice-cold Hank’s Balanced Salt Solution (HBSS) containing 5% fetal calf serum. The digest was allowed to settle at 1 xg and the supernatant removed and the process repeated. The washed digest was passed through a 500 µm screen and sedimented for 1 min at 300 xG. The pellet was mixed with 10 mL of 1.110 g/mL Histopaque (density = 1.1085, Sigma Diagnostics Inc.) and centrifuged. The islets floating on the interphase of the gradient were collected, sedimented and cleaned using a sterile 40 µm mesh cell strainer and HBSS with 5% fetal calf serum. Islets were placed into CMRL 1066 containing 2 mM glutamine, 10% fetal bovine serum and 1% antibiotic/antimycotic solution.
Separation of large from small islets.
Separation of large and small islets was completed manually or using a Complex Object Parametric Analyzer and Sorter (COPAS, Union Biometrica, Holliston, MA). Based on our previous publication small islets were identified based on a diameter of less than 125 µm and large islets had a diameter of greater than 150 µm.6 In order to avoid contamination of islets of the wrong size, only islets under 100 mm were categorized as small for this project. When hand-picking islets, large islet aliquots had islets with diameters larger than 200 µm. However, use of the biosorter (described below) allowed the analysis of islets of all sizes.
Automated separation of islets with the COPAS has been reported previously and shown to match (in size estimates) manually-separated islets.32 In addition, the viability after sorting with the COPAS has been shown to be similar as manual separation.32 The COPAS was optimized for the size range of the islets to be sorted by changing the sampling conditions (PMT’s, Gain Settings, Gate and Sort Parameters and Regions). Prior to initiation of the experiments, control work was done to determine whether there was any effect on islet viability or function when separation was performed using the COPAS or manual techniques. Separation using the COPAS did not alter the properties of the islets. For experiments reported in this study, COPAS-sorted and manually-sorted islets and porous islets were tested in duplicate for the same experiments when possible. Only the optical density experiments (which can only be performed with the COPAS) were not conducted using both techniques. Islets were washed by sedimentation to reduce fetal calf serum content. Phosphatebuffered saline (PBS) containing Ca2+ and Mg2+ was used as the sheath reagent. Time of Flight (TOF, an indicator of diameter), extinction (indicating optical density) and fluorescence data were recorded. Calibration of islet TOF into diameter was done by sorting islets via the COPAS into 96 well plates. Immediately after the sort, the individual islet images were captured on a Fluoview 300 confocal microscope (Olympus, Center Valley, PA) using the transmitted light settings and the diameter measured. Calibration curves were calculated daily for experiments needing diameter estimates. By using the COPAS sorter, islets of all sizes could be analyzed, including those between 100 and 200 µm.
Islet Equivalents (IE) were calculated by taking duplicate samples of each batch of islets (comprising <2% of the islet fraction). Individual islets were counted and their diameters measured. For irregularly shaped islets, two to four diameter measurements were taken at different locations on the islet and averaged. Islet volumes were calculated and converted to islet equivalents for the sample and the entire islet fraction.
Formation of porous islet segments.
After isolation, the islets were allowed to recover in CMRL 1066 containing 2 mM glutamine, 10% fetal bovine serum and 1% antibiotic/antimycotic solution in a 37°C culture chamber containing 5% CO2. 24 hours prior to making the islets porous, they were changed to L-15 medium containing 10% fetal bovine serum. Large islets were handpicked and washed once with a solution consisting of 9 parts of Ca2+/Mg2+ free HBSS with 10 mM HEPES containing papain (PAPL, 5 units per mL) to lower the concentration of calcium and magnesium. One mL of HBSS/PAPL solution was added and after 10 minutes incubation, the islets were dispersed by repeated pipetting. The process (observed through the light microscope) continued until on average less than 20% of the islets were completely intact.
Microscopy.
For confocal microscopy experiments, the maximal size of the large islet was limited to 250 µm in diameter due to concerns that the inability to image in the cross section of the islet would confound the results. For viability assays, islets were placed in a 500 µl volume of L-15 medium with live/dead fluorophores (Invitrogen, Carlsbad, CA) including: Sytox (1 µM) and Calcein AM (0.5 µM), or ethidium homodimer (1 µM) and Calcein AM (0.5 µM), and incubated for 15–30 minutes at 37°C. Sytox and ethidium homodimer are member impermeant nucleic acid stains that are not able to stain cells with intact plasma membranes. Calcein AM is membrane permeant, but will only fluoresce in cells containing healthy esterases. To sense DNA fragmentation and loss of membrane integrity, islets were exposed to YO-PRO-1 and Propidium Iodide (Vybrant Apoptosis Assay, Invitrogen) for 30 min at 37°C. This assay has been used extensively to differentiate between cell necrosis and apoptosis.33,34 For any assay, islets were rinsed with PBS and placed in the Attofluor Chamber on the Fluoview 300 confocal microscope. All images were collected within 20 minutes of removal of the islets from the media. Background fluorescence was subtracted and viability percentages were calculated using FluoView software. The ratio representing the live cell area divided by the total islet area was calculated as the percent live value.
Dithizone (Sigma) staining of endocrine cells was achieved by incubating islets in a working dithizone solution made from a stock of 50 mg of dithizone in 50 mL of dimethylsulfoxide. The working solution was made by adding 10 µL of the stock solution to 1 mL of culture medium and filtered through a 0.2 µm filter. The islets were incubated in the dithizone solution at 25°C for 15–30 min, rinsed in PBS, and examined with a phase contrast microscope.
Glucose diffusion/uptake measurements.
Glucose diffusion/uptake experiments were completed on the confocal microscope. Islets were imaged using laser (488 nm) and transmitted light images were collected. The field of interest was scanned 1/sec. 2-[N-(7-nitrobenz-2-oxa-1,3-diazol-4-yl)amino]-2-deoxy-D glucose (2-NBDG; 20 mM) was added to the media through perifusion. The rate of fluorescent 2-NBDG entry into the islet was measured as the fluorescence in the outer layers of cells of the islets became fluorescent. The scanning rate was decreased after the first 10 minutes for subsequent measurements captured up to 3 hours after 2-NBDG perifusion.
Insulin secretion.
Large, small or porous islets were placed in duplicate wells and assigned to two groups: low glucose (3 mM), and high glucose (20 mM). All wells were preincubated for 30 minutes in RPMI 1640 containing 3 mM glucose in a 37°C containing 5% CO2. After preincubation, media was removed from each well and discarded. Low or high glucose solutions were added to the duplicates. After 30 minutes static incubation in the 37°C and 5% CO2, the islets were sedimented and the conditioned medium was collected to determine insulin content and frozen at −80°C. Insulin concentration was determined by ELISA (ALPCO, Windham, NH).
Islet transplantation.
Diabetes was induced in DA male recipient rats by injecting streptozotocin (65 mg/kg) intraperitoneally (one injection). When blood glucose levels were above 250 mg/dl for 3 consecutive days, the rats were considered diabetic. Rats were anesthetized with 45 mg/kg sodium pentobarbital. After the rat was shaved and cleaned with betadine scrub, an incision was made in the body wall on the left flank. The kidney was delivered into the wound, and a small incision was made in the kidney capsule. Syngeneic DA porous islets (1,000–1,200 IE) were placed under the capsule using a small bore pipette. The kidney was placed back into its original position and the incision closed with wound clips. Insulin (3 units Humulin N/Humulin R mix) injections were given daily to recipients for 3 days postislet transplant to reduce the stress of hyperglycemia on the newly transplanted porous islets.
Immunohistochemistry.
Histology of the porous islet transplants was obtained at 6 weeks post-transplant. Kidneys were fixed in 4% neutral buffered formalin for 24 hrs and embedded in paraffin wax. Immunohistochemistry was performed on 6 micron sections to detect insulin using primary antibodies from Zymed (San Francisco, CA) and the secondary kit from Invitrogen (San Francisco, CA) as per manufacturer’s protocol.
Statistics.
Unless otherwise noted, all results were tested for significance using hierarchal ANOVA with p < 0.05. Where appropriate, figures illustrate the mean ± SE.
Acknowledgements
Gratitude is expressed to Drs. Weon Bae and Rock Pulak for helpful discussions. This work is supported by the Emilie Rosebud Diabetes Research Foundation to L.S.B., the Juvenile Diabetes Research Foundation to C.B. and L.S.B., the Hall Foundation to W.M., K.K. and L.S.B. and the Paul and Betty Henson Pediatric Immunology Research Award to W.M. Core facilities used are supported by NICHD HD02528.
Abbreviations
- ANOVA
analysis of variance
- CO2
carbon dioxide
- COPAS
complex object parametric analyzer and sorter
- CMRL
1066, connaught medical research laboratories media
- DA
dark agouti
- Deff
effective diffusion coefficient
- ELISA
enzyme-linked immunosorbent assay
- HBSS
hank’s balanced salt solution
- HBSS/PAPL
hank’s balanced salt solution with papain
- HEPES
4-(2-hydroxyethyl)-1-piperazineethanesulfonic acid
- IE
islet equivalents
- K
oxygen consumption term
- 2-NBDG
2-[N-(7-nitrobenz-2-oxa-1,3-diazol-4-yl)amino]-2-deoxy-D glucose
- OD
optical density
- PAPL
papain
- PMT
photo-multiplier tube
- RPMI 1640
roswell park memorial institute media
- TOF
time of flight
Footnotes
Previously published online: www.landesbioscience.com/journals/organogenesis/article/10373
References
- 1.Ryan E, Shandro T, Green K, Paty B, Senior P, Bigam D, et al. Assessment of the severity of hypoglycemia and glycemic lability in type 1 diabetic subjects undergoing islet transplantation. Diabetes. 2004;53:955–962. doi: 10.2337/diabetes.53.4.955. [DOI] [PubMed] [Google Scholar]
- 2.Toso C, Shapiro A, Bowker S, Dinyari P, Paty B, Ryan E, et al. Quality of life after islet transplant: impact of the number of islet infusions and metabolic outcome. Transplantation. 2007;84:664–666. doi: 10.1097/01.tp.0000280550.01028.89. [DOI] [PubMed] [Google Scholar]
- 3.Hiscox AM, Stone AL, Limesand S, Hoying JB, Williams SK. An islet-stabilizing implant constructed using a preformed vasculature. Tissue Eng. 2008;14:433–440. doi: 10.1089/tea.2007.0099. [DOI] [PubMed] [Google Scholar]
- 4.Davalli AM, Scaglia L, Zangen DH, Hollister J, Bonner-Weir S, Weir GC. Vulnerability of islets in the immediate posttransplantation period. Dynamic changes in structure and function. Diabetes. 1996;45:1161–1167. doi: 10.2337/diab.45.9.1161. [DOI] [PubMed] [Google Scholar]
- 5.Williams S, Wang W, MacGregor R, Siahaan T, Stehno-Bittel L, Berkland C. Adhesion of pancreatic beta cells to biopolymer films. Biopolymers. 2009;91:676–685. doi: 10.1002/bip.21196. [DOI] [PMC free article] [PubMed] [Google Scholar]
- 6.MacGregor RR, Williams SJ, Tong PY, Kover K, Moore WV, Stehno-Bittel L. Small rat islets are superior to large islets in in vitro function and in transplantation outcomes. Am J Physiol Endocrinol Metab. 2006;290:771–779. doi: 10.1152/ajpendo.00097.2005. [DOI] [PubMed] [Google Scholar]
- 7.Lehmann R, Zuellig RA, Kugelmeier P, Baenninger PB, Moritz W, Perren A, et al. Superiority of small islets in human islet transplantation. Diabetes. 2007;56:594–603. doi: 10.2337/db06-0779. [DOI] [PubMed] [Google Scholar]
- 8.Cui YF, Ma M, Wang GY, Han DE, Vollmar B, Menger MD. Prevention of core cell damage in isolated islets of Langerhans by low temperature preconditioning. World J Gastroenterol. 2005;11:545–550. doi: 10.3748/wjg.v11.i4.545. [DOI] [PMC free article] [PubMed] [Google Scholar]
- 9.Cui YF, Ma M, Wang ZD, Zhang L, Hu ZL, Han DE. Prevention of central cell damage to isolated islets of Langerhans in hamsters by low temperature preconditioning. Hepatobiliary Pancreat Dis Int. 2005;4:139–143. [PubMed] [Google Scholar]
- 10.Glicklis R, Merchuk JC, Cohen S. Modeling mass transfer in hepatocyte spheroids via cell viability, spheroid size and hepatocellular functions. Biotechnol Bioeng. 2004;86:672–680. doi: 10.1002/bit.20086. [DOI] [PubMed] [Google Scholar]
- 11.Avgoustiniatos E, Dionne K, Wilson D, Yarmush M, Colton C. Measurements of the effective diffusion coefficient of oxygen in pancreatic islets. Ind Eng Chem Res. 2007;46:6157–6163. [Google Scholar]
- 12.Papas K, Colton C, Gounarides J, Roos E, Jarema M, Shapiro M, et al. NMR spectroscopy in b cell engineering and islet transplantation. Ann New York Acad Sci. 2001;944:96–119. doi: 10.1111/j.1749-6632.2001.tb03826.x. [DOI] [PubMed] [Google Scholar]
- 13.Barros L, Bittner C, Loaiza A, Porras O. A quantitative overview of glucose dynamics in the gliovascular unit. Glia. 2007;55:1222–1237. doi: 10.1002/glia.20375. [DOI] [PubMed] [Google Scholar]
- 14.Kauri LM, Jung SK, Kennedy RT. Direct measurement of glucose gradients and mass transport within islets of Langerhans. Biochem Biophys Res Commun. 2003;304:371–377. doi: 10.1016/s0006-291x(03)00595-3. [DOI] [PubMed] [Google Scholar]
- 15.Barros L, Bittner C, Loaiza A, Ruminot I, Larenas V, Moldenhauer H, et al. Kinetic validation of 6-NBDG as a probe for the glucose transporter GLUT1 in astrocytes. J Neurochem. 2009;109:94–100. doi: 10.1111/j.1471-4159.2009.05885.x. [DOI] [PubMed] [Google Scholar]
- 16.Yamada K, Nakata M, Horimoto N, Saito M, Matsuoka H, Inagaki N. Measurement of glucose uptake and intracellular calcium concentration in single, living pancreatic beta-cells. J Biol Chem. 2000;275:22278–22283. doi: 10.1074/jbc.M908048199. [DOI] [PubMed] [Google Scholar]
- 17.Dionne KE, Colton CK, Yarmush ML. Effect of hypoxia on insulin secretion by isolated rat and canine islets of Langerhans. Diabetes. 1993;42:12–21. doi: 10.2337/diab.42.1.12. [DOI] [PubMed] [Google Scholar]
- 18.Jo J, Choi M, Koh D-S. Size distribution of mouse Langerhans islets. Biophys J. 2007;93:2655–2666. doi: 10.1529/biophysj.107.104125. [DOI] [PMC free article] [PubMed] [Google Scholar]
- 19.Brissova M, Shostak A, Shiota M, Wiebe PO, Poffenberger G, Kantz J, et al. Pancreatic islet production of vascular endothelial growth factor-a is essential for islet vascularization, revascularization and function. Diabetes. 2006;55:2974–2985. doi: 10.2337/db06-0690. [DOI] [PubMed] [Google Scholar]
- 20.Bonner-Weir S. Morphological evidence for pancreatic polarity of beta-cell within islets of Langerhans. Diabetes. 1988;37:616–621. doi: 10.2337/diab.37.5.616. [DOI] [PubMed] [Google Scholar]
- 21.Vajkoczy P, Menger MD, Simpson E, Messmer K. Angiogenesis and vascularization of murine pancreatic islet isografts. Transplantation. 1995;60:123–127. [PubMed] [Google Scholar]
- 22.Menger MD, Jaeger S, Walter P, Feifel G, Hammersen F, Messmer K. Angiogenesis and hemodynamics of microvasculature of transplanted islets of Langerhans. Diabetes. 1989;38:199–201. doi: 10.2337/diab.38.1.s199. [DOI] [PubMed] [Google Scholar]
- 23.Mattsson G, Jansson L, Carlsson PO. Decreased vascular density in mouse pancreatic islets after transplantation. Diabetes. 2002;51:1362–1366. doi: 10.2337/diabetes.51.5.1362. [DOI] [PubMed] [Google Scholar]
- 24.Carlsson PO, Liss P, Andersson A, Jansson L. Measurements of oxygen tension in native and transplanted rat pancreatic islets. Diabetes. 1998;47:1027–1032. doi: 10.2337/diabetes.47.7.1027. [DOI] [PubMed] [Google Scholar]
- 25.Orci L. Macro- and micro-domains in the endocrine pancreas. Diabetes. 1982;31:538–565. doi: 10.2337/diab.31.6.538. [DOI] [PubMed] [Google Scholar]
- 26.Bendayan M. Pathway of insulin in pancreatic tissue on its release by the B-cell. Am J Physiol. 1993;264:187–194. doi: 10.1152/ajpgi.1993.264.2.G187. [DOI] [PubMed] [Google Scholar]
- 27.Takahashi N, Kishimoto T, Nemoto T, Kadowaki T, Kasai H. Fusion pore dynamics and insulin granule exocytosis in the pancreatic islet. Science. 2002;297:1349–1352. doi: 10.1126/science.1073806. [DOI] [PubMed] [Google Scholar]
- 28.Dean PM, Matthews EK. Electrical activity in pancreatic islet cells. Nature. 1968;219:389–390. doi: 10.1038/219389a0. [DOI] [PubMed] [Google Scholar]
- 29.Van Schravendijk CFH, Kiekens R, Pipeleers D. Pancreatic b cell heterogeneity in glucose-induced insulin secretion. J Biol Chem. 1992;267:21344–21348. [PubMed] [Google Scholar]
- 30.Aizawa T, Kaneko T, Yamauchi K, Yajima H, Nishizawa T, Yada T, et al. Size-related and size-unrelated functional heterogeneity among pancreatic islets. Life Sci. 2001;69:2627–2639. doi: 10.1016/s0024-3205(01)01332-7. [DOI] [PubMed] [Google Scholar]
- 31.Ichii H, Sakuma Y, Pileggi A, Fraker C, Alvarez A, Montelongo J, et al. Shipment of human islets for transplantation. Am J Transplant. 2007;7:1010–1020. doi: 10.1111/j.1600-6143.2006.01687.x. [DOI] [PubMed] [Google Scholar]
- 32.Fernandez LA, Hatch EW, Armann B, Odorico JS, Hullett DA, Sollinger HW, Hanson MS. Validation of large particle flow cytometry for the analysis and sorting of intact pancreatic islets. Transplantation. 2005;80:729–737. doi: 10.1097/01.tp.0000179105.95770.cd. [DOI] [PubMed] [Google Scholar]
- 33.Agrelo R, Cheng W, Setien F, Ropero S, Espada J, Fraga M, et al. Epigenetic inactivation of the premature aging Werner syndrome gene in human cancer. PNAS. 2006;103:8822–8827. doi: 10.1073/pnas.0600645103. [DOI] [PMC free article] [PubMed] [Google Scholar]
- 34.Yee K, Vousden K. Contribution of membrane localization to the apoptotic activity of PUMA. Apoptosis. 2008;13:87–95. doi: 10.1007/s10495-007-0140-2. [DOI] [PubMed] [Google Scholar]