

Abstract
Background: P‐wave indices of maximum P‐wave duration and P‐wave dispersion have been examined in a broad array of cardiovascular and noncardiovascular disease states. The P‐wave indices literature has been highly heterogeneous in measurement methodologies, described quality control metrics, and distribution of values. We therefore sought to determine the reproducibility of P‐wave indices in a community‐based cohort.
Methods: P‐wave indices were measured in sequential subjects enrolled in the Framingham Heart Study. Electrocardiograms were obtained at the 11th biennial visit of the Original Cohort (n = 250) and the initial visit of the Offspring Cohort (n = 252). We determined the mean P‐wave durations, interlead correlations, and P‐wave indices. We then chose 20 ECGs, 10 from each cohort, and assessed intrarater and interrater variability.
Results: The maximum P‐wave duration ranged from 71 to 162 ms with mean of 112 ± 12 ms. The minimum P‐wave duration ranged from 35 to 103 ms with mean of 65 ± 10 ms. P‐wave dispersion ranged from 12 to 82 ms. The mean P‐wave dispersion was 48 ± 12 ms (40–56). The intrarater intraclass correlation coefficient (ICC) was r = 0.80 for maximum P‐wave duration and r = 0.82 for P‐wave dispersion. The interrater ICC was 0.56 for maximum P‐wave duration and 0.70 for P‐wave dispersion.
Conclusions: We demonstrated excellent intrarater reproducibility and fair interrater reproducibility for calculating P‐wave indices. Reproducibility is frequently lacking in studies of P‐wave indices, but is an essential component for the field's growth and epidemiologic contribution.
Ann Noninvasive Electrocardiol 2010;15(1):77–84
Keywords: electrocardiogram, P waves, reproducibility, epidemiology
P‐wave indices of maximum P‐wave duration and P‐wave dispersion have been examined in a broad array of cardiovascular and noncardiovascular disease states. 1 P‐wave maximum is the longest duration of any P‐wave identified in the 12‐lead electrocardiogram (ECG), and P‐wave dispersion is defined as the difference between the maximum and minimum duration P waves. Studies have investigated the association of prolonged P‐wave indices in subjects with paroxysmal atrial fibrillation (AF), 2 , 3 , 4 recurrent AF following cardioversion, 5 , 6 , 7 incident AF, 8 and AF following cardiothoracic surgery. 9 , 10 , 11 Cross‐sectional studies have demonstrated that subjects with hypertension, 12 obesity, 13 , 14 , 15 diabetes, 16 and sleep apnea 17 have prolonged P‐wave indices compared to controls. P‐wave indices have been characterized to distinguish cohorts with structural, 18 , 19 , 20 , 21 or valvular, 22 , 23 diseases from referent cohorts. Other components of P‐wave indices, such as amplitude, area, and terminal force, will not be examined in this project.
The P‐wave indices literature focusing on duration and dispersion has been highly heterogeneous in the described quality control metrics and the distribution of values. Quality control assessments have been limited and have included variability around the mean intra‐ and interobserver differences; 12 coefficients of variation; 2 , 18 , 23 and the interobserver Kappa statistics. 8 Community‐ and hospital‐based surveys also have shown wide variability in the prevalence of P‐wave prolongation and dispersion. 24 , 25 , 26 , 27 Measurements of P‐wave dispersion in cohorts described as normal have ranged from 28 28 to 52 ms. 29 Maximum P‐wave durations have been reported ranging from 93 30 to 108 ms. 23
Given the variability in the prior reports of P‐wave indices, our goals were twofold. First, we sought to determine the distribution of P‐wave indices in a subset of subjects in the Framingham Heart Study. Second, we performed a quality control assessment of our technique by establishing the intra‐ and interrater reliability of our measurements.
METHODS
Participants
The Framingham Heart Study (FHS) is a prospective community‐based study initiated in 1948 with enrollment of 5209 participants, designed to identify coronary heart disease risk factors. 31 , 32 A second wave of enrollment included 5124 offspring (and their spouses) of the Original Cohort and is termed the Offspring Cohort. The Original Cohort completed scheduled exams about every 2 years, and the Offspring every 4–8 years. This study included participants from the Original Cohort's 11th biennial examination (1968–1971) and the Offspring Cohort's first examination (1971–1975). These visits totaled 8079 examinees. Subjects were not included if they had AF at or prior to the index examination; had a paced rhythm; or a technically inadequate tracing. We sought to obtain measurements from at least 5% of eligible subjects. We therefore conducted measurements of P‐wave indices on the first 250 and 252 consecutive eligible subjects by chronological examination date from the Original and Offspring Cohorts, respectively. The FHS examination has been approved by the Boston University Medical Center Institutional Review Board and all FHS subjects provided written, informed consent.
Measurement Protocol
The routine Framingham clinic examinations included a single‐channel electrocardiogram (Hewlett‐Packard, Palo Alto, CA, USA) recorded on lined paper at 25 mm/s and 0.1 mV/mm as previously described. 33 The electrocardiograms were subsequently converted to tagged image format. Measurements were taken using commercially available software (Rigel version 1.7.4, AMPS, New York, NY, USA; http://www.amps-llc.com) used for electrocardiographic measurement 34 , 35 and adapted specifically for this study. The software consists of a digital caliper manipulated by the computer mouse. The images were enlarged fourfold for enhanced visibility and clarity. Baseline measurements were initially taken by a single reader (JWM) who then trained the second reader (MJM) for interrater comparison by collaborative measurement of 40 ECGs selected from the initial 502 subjects.
Each lead was calibrated prior to measurements. P‐wave onset was determined as the initial deflection from the isoelectric baseline defined by the T‐P segment. The P‐wave offset was defined as the junction of the end of the P wave and its return to baseline prior to the QRS complex. Up to three consecutive P waves were measured in each of 12 leads. P waves were not measured if the onset or offset was ambiguous. The P wave with the best defined onset and offset was chosen for the initial measurement in a given lead, and subsequent measurements were then taken in adjacent P waves. Up to three measurements were made of the R wave in lead aVL and the S wave in lead V3. The mean of the voltage measurements were summed in order to determine a left ventricular hypertrophy (LVH) score and then multiplied by the QRS duration to determine the Cornell voltage‐duration product (RaVL+ SV3[+6 mm in women]× QRS duration). 36
Intra‐ and Interobserver Assessment
Quality control was performed using 10 sequential electrocardiograms from both the Original and Offspring cohorts (20 total), which were selected for repeat measurement to determine interrater and intrarater variability. Operators were blinded to each other's and the initial measurements. Operators individually determined which P waves to measure and excluded leads based upon the guidelines articulated in the measurement manual. Participant studies were measured in the same sequence on different days. Each operator performed vertical and horizontal calibrations in each lead and measured up to 36 leads per ECG.
Definitions
P‐wave indices include the maximum P‐wave duration, minimum duration, and dispersion. P‐wave dispersion is calculated by obtaining the difference between the mean maximum and minimum P‐wave durations identified on an individual tracing. Our study used the mean P wave for determining P‐wave indices, obtained by summing the P waves measured in each lead and dividing by the number of measurements made. Use of a mean P‐wave duration sought to improve precision by accounting for measurement and physiologic variability.
Hypertension was defined as systolic blood pressure (BP) ≥140 mmHg, or diastolic BP ≥90 mmHg or antihypertensive medication use. Diabetes was defined as fasting blood glucose ≥126 mg/dL or use of insulin or oral hypoglycemic agents. Cardiac medications recorded at examination visits included antihypertensive agents and antiarrhythmic drugs. Events (e.g., heart failure, myocardial infarction, stroke) were adjudicated by a three‐investigator panel adhering to written criteria after reviewing Framingham clinic and outside hospital and physician records. 37 , 38 , 39 , 40
The Cornell voltage‐duration product has significant sensitivity in detecting LVH and sex‐discriminatory reliability for distinguishing LVH. 41 , 42 Calculation of the Cornell voltage‐duration provided a reliable benchmark comparison between the rapid onset and offset signal of the QRS segment to the slower onset and offset signal of the P wave. We hypothesized intra‐ and interrater reliability for assessing LVH and the Cornell voltage product would approach unity. Subjects’ QRS duration was determined in a study independent from the investigation described here and demonstrated excellent interrater reliability. 43
Statistical Analyses
Descriptive statistics including means and standard deviations for continuous variables and percentages for categorical variables were produced for the study sample (n = 502) and for the Framingham Heart Study examinees (n = 8079). Means and standard deviations were computed for each lead and for the P‐wave indices of maximum duration and dispersion in the study sample. Box‐and‐whisker plots also were generated to assess distributional properties. Correlations between leads and the P‐wave indices of maximum duration and dispersion in the study sample were estimated using Pearson correlation coefficients. Reproducibility within and between raters was assessed with intraclass correlation coefficients (ICC) for both intraobserver and interobserver measurements, respectively. The ICC was calculated for each lead and the P‐wave indices of maximum duration and dispersion separately. An ICC of 0.5 indicates moderate correlation, 0.75 excellent correlation, and 1.0 perfect correlation. All analyses were done using SAS 9.1 (SAS Institute, Cary, NC, USA).
RESULTS
Determination of P‐Wave Indices in a Subset of Framingham Heart Study Participants
The 502 participants selected for the study and the 8079 subjects attending the 11th biennial exam of the Original Cohort and the initial exam of the Offspring Cohort are described in Table 1. The 502 subjects were chosen by chronological examination date and were not intended as a representative sample. Of the 502 subjects, 30.3% had hypertension, 12.2% had diabetes, and 12.2% were taking cardiac medications.
Table 1.
Participant Characteristics of Study Sample and All Examinees
| Characteristic | Study Sample (n = 502) | Cohort 11, Offspring 1 Examinees (n = 8079) |
|---|---|---|
| Clinical Features | ||
| Age, years | 47.6 ± 17.9 | 46.3 ± 15.8 |
| Women, % | 57.8% | 53.9% |
| Systolic blood pressure, mmHg | 128 ± 21 | 129 ± 21 |
| Diastolic blood pressure, mmHg | 78 ± 10 | 80 ± 11 |
| Body mass index, kg/m2 | 24.7 ± 4.0 | 25.4 ± 4.3 |
| Hypertension | 30.3% | 32.6% |
| Atrial fibrillation, % | N/A | 0.6% |
| Diabetes, % | 12.2% | 8.1% |
| Cardiovascular Diseasea | ||
| Prior MI | 2.0% | 2.0% |
| Heart failure | 1.0% | 0.6% |
| Stroke | 1.2% | 0.8% |
| Cardiac medicationsb | 10.2% | 9.6% |
Values are mean ± SD or percentages. BP = blood pressure; MI = myocardial infarction.
aEstablished by clinical history, functional stress test or imaging stress test. bSee text for cardiac medications.
Lead aVL was the most frequently excluded lead, as only 460 subjects had P waves with a discernible onset and offset. In contrast, leads I and II had P waves measured in 500 subjects and were consequently the least frequently excluded. Lead II had the longest mean P‐wave duration, 103 ± 15 ms, and aVL the shortest mean duration, 75 ± 15 ms. The maximum P‐wave duration ranged from 71 to 162 ms with mean of 112 ± 12 ms. The minimum P‐wave duration ranged from 35 to 103 ms with mean of 65 ± 10 ms. P‐wave dispersion ranged from 12 to 82 ms. The mean P‐wave dispersion was 48 ± 12 ms (40–56). Summary measurements for each of the 12 leads are listed in Table 2. The distribution of the P‐wave duration in each ECG lead is illustrated in Figure 1.
Table 2.
Summary of Measurement of 502 Subjects Included in Preliminary Study
| Variable | N | Mean | SD |
|---|---|---|---|
| P‐Wave Indices (ms) | |||
| I | 500 | 88.8 | 16.3 |
| II | 500 | 103.4 | 14.5 |
| III | 482 | 90.9 | 16.6 |
| V1 | 494 | 76.5 | 14.4 |
| V2 | 472 | 79.3 | 14.5 |
| V3 | 490 | 87.8 | 14.8 |
| V4 | 497 | 94.8 | 15.2 |
| V5 | 496 | 96.1 | 15.0 |
| V6 | 494 | 95.6 | 15.0 |
| aVR | 498 | 95.0 | 14.6 |
| aVL | 460 | 75.3 | 15.2 |
| aVF | 487 | 99.4 | 17.3 |
| P maximum | 502 | 112.4 | 12.3 |
| P dispersion | 502 | 47.9 | 12.2 |
| Cornell LVH score (mV ms product) 36 | 442 | 1441 | 562 |
| LVH score (mm) | 497 | 13.7 | 9.1 |
Figure 1.
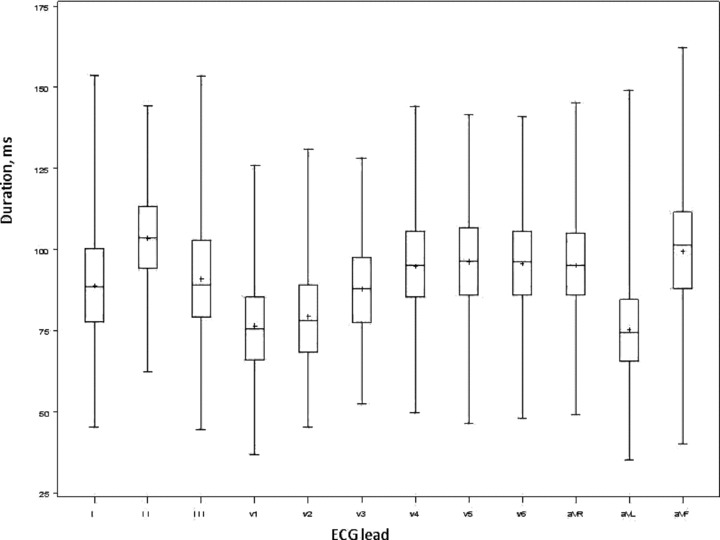
Box‐and‐whisker plot demonstrating the distribution of P‐wave duration per lead in milliseconds. The middle line of the box represents the median and the top and bottom borders are the interquartile range; the mean is depicted with a + sign. The figure shows overlap of the interquartile range among all 12 leads except aVL.
Assessment of correlation demonstrated maximum P‐wave duration and dispersion were strongly correlated (0.65, P < 0.0001). Maximum P‐wave duration had the highest correlation (r = 0.77, P < 0.0001) with lead II. The weakest correlations with maximum P‐wave duration occurred between leads V2 (r = 0.28, P < 0.0001), aVL (r = 0.34, P < 0.0001), and V1 (r = 0.36, P < 0.0001), all of which had the mean P‐wave durations <80 ms. P‐wave dispersion had moderate correlations with leads II (r = 0.46, P < 0.0001) and weak‐to‐mild correlations with the remaining leads.
Intrarater and Interrater Correlation Coefficients of P‐Wave Indices
Intrarater assessment with 20 ECGs showed high levels of correlation by ICC assessment. The intrarater ICC ranged from r = 0.69 (lead V4) to 0.97 (lead aVL). Eight leads had an intrarater ICC r ≥ 0.75, and all had r ≥ 0.50. Maximum P‐wave duration ICC was r = 0.80 and P‐wave dispersion was r = 0.82. Interrater ICCs for the 12 ECG leads ranged from r = 0.42 (lead avR) to r = 0.80 (lead I). Three leads had an ICC r ≥ 0.75 and 10 had r ≥ 0.50. P‐wave maximum had an interrater ICC of 0.56. P‐wave dispersion had an ICC of 0.70. LVH had excellent interrater (r = 0.99) and intrarater (r = 0.97) correlations.
DISCUSSION
We examined P‐wave indices of maximum P‐wave duration and P‐wave dispersion in a community‐based cohort study. We described the distribution of measurements within a segment of the cohort, and conducted a rigorous quality control assessment to determine the intra‐ and interrater reliability of our digital instrument.
We found excellent correlations for intrarater observations for maximum P‐wave duration and P‐wave dispersion. Interrater observations of maximum P‐wave duration showed moderate correlation by ICC and interrater assessment of P‐wave dispersion demonstrated excellent ICC. The moderate correlations of maximum P‐wave duration are likely attributable to discordant lead exclusion and P‐wave selection by the individual operators. LVH scores demonstrated excellent intra‐ and interrater reproducibility and serve as an internal control validating our measurement technique.
Our study was conducted using digital calipers. Current technology permits automated measurement of P‐wave duration and other P‐wave indices, such as amplitude and area, quantification that would not be possible without computer assistance. The relatively recent development of such technology, however, does not allow for investigation of P‐wave indices prior to its development. Indeed, if P‐wave indices serve as a biomarker for disease processes, measurement on older ECGs remains necessary for their quantification and epidemiologic study. In addition, software for automated calculation of P‐wave indices has limited availability. The widespread use of digital calipers employed in our study underscores the necessity for determining reliability.
P‐wave dispersion's moderate interrater reliability contrasts with the excellent values obtained for LVH scores. The difference in interrater reliability stems from the rapid on‐ and offset of the QRS segment, in comparison to the more ambiguous and slower amplitude of the P wave. In addition, P‐wave dispersion is calculated with two different measurements and therefore will be affected by choice of P wave, lead exclusion, or variable assessment of P‐wave onset or offset. Baseline wander, however subtle, will impact the legibility of P‐wave duration and is especially prevalent on the single‐channel ECGs used for this study's assessment. Use of digital ECGs with multiple channels would likely have improved measurement accuracy.
We reviewed the literature of these P‐wave indices to assess prior studies and the quality control assessments they employed. Studies with ≥30 subjects and the quality control indices employed by each study are listed in Table 3. Quality control assessments of P‐wave indices have been limited and have not been emphasized within the literature. In fact, multiple studies have been published without reporting quality control assessments. 16 , 18 , 30 , 44 , 45 , 46 The present study is further distinguished by its size. As shown in Table 3, most studies examining P‐wave indices have been smaller than ours. The prior literature is further limited by the absence of standardized techniques and methodologies for the measurement of P‐wave indices.
Table 3.
Selected Studies of P‐Wave Indices and Their Employed Quality Control Indices
| Study Author, Year Published | Study Design; Clinical Context | N (Referent Or Control Cohort)* | Maximum P‐Wave Duration (ms) | P‐Wave Dispersion (ms) | Quality Control Indices |
|---|---|---|---|---|---|
| Current study | Community‐based, retrospective. | Reference sample. | 112.4 ± 12.3 | 47.9 ±12.2 | Intra‐ and interrater ICC. |
| Dilaveris, 1998 3 | Cross‐sectional; PAF. | 40 | 101.0 ± 10.0 | 28.0 ± 7.0 | Mean percent error. |
| Andrikopoulos, 2000 48 | Cross‐sectional; PAF | 50 | 101.4 ± 10.1 | 29.8 ± 8.7 | Relative error. |
| Aytemir, 2000 2 | Cross‐sectional; PAF. | 70 | 101.0 ± 11.0 | 27.0 ± 10.0 | Coefficients of variation. |
| Tukek, 2002 30 | Cross‐sectional; COPD. | 33 | 93.0 ± 13.0 | 39.0 ± 7.0 | Not documented. |
| Gialafos, 2003 26 | Military cohort, young men. | 1353 | 96.0 ± 11.0 | 38.0 ± 10.0 | Relative error. |
| Guray, 2003 18 | Cross‐sectional; atrial septal defect | 47 | 102 ± 13 | 31 ± 9 | Not documented. |
| Turhan, 2003 23 | Cross‐sectional; aortic stenosis | 98 | 108.0 ± 7.0 | 32.0 ± 5.0 | Coefficients of variation. |
| Yigit, 2003 29 | Clinical trial; impact of exercise on P‐wave indices. | 155 | 94.0 ± 2.3 | 52.1 ± 2.0 | Mean % error of maximum & minimum measurements. |
| Gunduz, 2005 44 | Cross‐sectional; diastolic dysfunction. | 60 | 104 ± 9 | 43 ± 9 | Not documented. |
| Dagli, 2007 12 | Cross‐sectional; hypertension. | 60 | 64 ± 10.2 | 30.3 ± 6.6 | Variability (percentage) from mean. |
| Yazici, 2007 16 | Cross‐sectional; diabetes mellitus | 40 | 93 ± 10 | 28 ± 10 | Not documented. |
| Kosar, 2008 45 | Cross‐sectional; obesity. | 30 | 101.2 ± 8.2 | 17.0 ± 4.3 | Not documented. |
PAF = paroxysmal atrial fibrillation; ICC = intraclass correlation coefficient; COPD = chronic obstructive pulmonary disease.
Rigorous assessment of quality control is necessary in order to validate a measurement methodology. In this study, the intraclass correlation was used to ascertain how the intrarater and interrater observations agreed. By definition, the correlation was the closeness of fit between the measurements. The ICC demonstrated the reliability of the instrument and its precision for consistent measurements.
LIMITATIONS
Our study has several limitations. First, because of the technology available at the time of acquisition, many of the ECGs had baseline noise that limited the accuracy of determining P‐wave initiation and termination. Inaccurate measurement of P‐wave duration and dispersion would result in random error. More importantly, simultaneous lead acquisition has been described as more reliable and accurate than single‐lead acquisition for determining electrocardiographic intervals. 47 Thus, the use of digital ECGs may have superior results than our study by decreasing artifact and significantly enhancing measurement reliability, in addition to permitting acquisition of the other components of P‐wave indices (amplitude, area, and terminal force). Our intra‐ and interrater reliability assessment was limited to only 20 subjects; however, since each ECG required the measurement of up to three P waves per lead, we submit that our measurements were adequate. Finally, our study included young‐to‐elderly adults of European descent, resulting in limited generalizability to other age and ethnic groups.
CONCLUSION
P‐wave indices have had diverse application to cardiac and noncardiac disease states. Reproducibility and precision are critical for the integrity of any measurement technique in clinical epidemiology. The quality of the literature has been challenged by the lack of standardized methodologies of measurement technique and absence of quality control. We recommend rigorous quality control assessment to become a standard component for establishing measurement validity. Widespread implementation of quality control will legitimize diverse investigators’ efforts and contribute to the generalizability of their findings.
Acknowledgments
Acknowledgment: This research was supported by an American Heart Association award 09FTF2190028.
REFERENCES
- 1. Magnani JW, Williamson MA, Monahan KM, et al P wave indices: Current status and future directions in epidemiology, clinical and research applications. Circ Arrhythmia Electrophysiol 2009;2:72–79. [DOI] [PMC free article] [PubMed] [Google Scholar]
- 2. Aytemir K, Ozer N, Atalar E, et al P wave dispersion on 12‐lead electrocardiography in patients with paroxysmal atrial fibrillation. Pacing Clin Electrophysiol 2000;23:1109–1112. [DOI] [PubMed] [Google Scholar]
- 3. Dilaveris PE, Gialafos EJ, Sideris SK, et al Simple electrocardiographic markers for the prediction of paroxysmal idiopathic atrial fibrillation. Am Heart J 1998;135:733–738. [DOI] [PubMed] [Google Scholar]
- 4. Dilaveris PE, Gialafos JE. P‐wave dispersion: A novel predictor of paroxysmal atrial fibrillation. Ann Noninvasive Electrocardiol 2001;6:159–165. [DOI] [PMC free article] [PubMed] [Google Scholar]
- 5. Boriani G, Diemberger I, Biffi M, et al P wave dispersion and short‐term versus late atrial fibrillation recurrences after cardioversion. Int J Cardiol 2005;101:355–361. [DOI] [PubMed] [Google Scholar]
- 6. Perzanowski C, Ho AT, Jacobson AK. Increased P‐wave dispersion predicts recurrent atrial fibrillation after cardioversion. J Electrocardiol 2005;38:43–46. [DOI] [PubMed] [Google Scholar]
- 7. Dogan A, Avsar A, Ozturk M. P‐wave dispersion for predicting maintenance of sinus rhythm after cardioversion of atrial fibrillation. Am J Cardiol 2004;93:368–371. [DOI] [PubMed] [Google Scholar]
- 8. De Bacquer D, Willekens J, De Backer G. Long‐term prognostic value of P‐wave characteristics for the development of atrial fibrillation in subjects aged 55 to 74 years at baseline. Am J Cardiol 2007;100:850–854. [DOI] [PubMed] [Google Scholar]
- 9. Chandy J, Nakai T, Lee RJ, et al Increases in P‐wave dispersion predict postoperative atrial fibrillation after coronary artery bypass graft surgery. Anesth Analg 2004;98:303–310. [DOI] [PubMed] [Google Scholar]
- 10. Chang CM, Lee SH, Lu MJ, et al The role of P wave in prediction of atrial fibrillation after coronary artery surgery. Int J Cardiol 1999;68:303–308. [DOI] [PubMed] [Google Scholar]
- 11. Mathew JP, Fontes ML, Tudor IC, et al A multicenter risk index for atrial fibrillation after cardiac surgery. JAMA 2004;291:1720–1729. [DOI] [PubMed] [Google Scholar]
- 12. Dagli N, Karaca I, Yavuzkir M, et al Are maximum P wave duration and P wave dispersion a marker of target organ damage in the hypertensive population? Clin Res Cardiol 2008;97:98–104. [DOI] [PubMed] [Google Scholar]
- 13. Duru M, Seyfeli E, Kuvandik G, et al Effect of weight loss on P wave dispersion in obese subjects. Obesity (Silver Spring) 2006;14:1378–1382. [DOI] [PubMed] [Google Scholar]
- 14. Russo V, Ammendola E, De CI, et al Severe obesity and P‐wave dispersion: The effect of surgically induced weight loss. Obes Surg 2008;18:90–96. [DOI] [PubMed] [Google Scholar]
- 15. Seyfeli E, Duru M, Kuvandik G, et al Effect of obesity on P‐wave dispersion and QT dispersion in women. Int J Obes (Lond) 2006;30:957–961. [DOI] [PubMed] [Google Scholar]
- 16. Yazici M, Ozdemir K, Altunkeser BB, et al The effect of diabetes mellitus on the P‐wave dispersion. Circ J 2007;71:880–883. [DOI] [PubMed] [Google Scholar]
- 17. Can I, Aytemir K, Demir AU, et al P‐wave duration and dispersion in patients with obstructive sleep apnea. Int J Cardiol 2009;133:e85–e89. [DOI] [PubMed] [Google Scholar]
- 18. Guray U, Guray Y, Yylmaz MB, et al Evaluation of P wave duration and P wave dispersion in adult patients with secundum atrial septal defect during normal sinus rhythm. Int J Cardiol 2003;91:75–79. [DOI] [PubMed] [Google Scholar]
- 19. Janion M, Kurzawski J, Sielski J, et al Dispersion of P wave duration and P wave vector in patients with atrial septal aneurysm. Europace 2007;9:471–474. [DOI] [PubMed] [Google Scholar]
- 20. Senen K, Turhan H, Riza EA, et al P‐wave duration and P‐wave dispersion in patients with dilated cardiomyopathy. Eur J Heart Fail 2004;6:567–569. [DOI] [PubMed] [Google Scholar]
- 21. Yilmaz R, Demirbag R, Durmus I, et al Association of stage of left ventricular diastolic dysfunction with P wave dispersion and occurrence of atrial fibrillation after first acute anterior myocardial infarction. Ann Noninvasive Electrocardiol 2004;9:330–338. [DOI] [PMC free article] [PubMed] [Google Scholar]
- 22. Marijon E, Jani D, Garbarz E. P‐wave dispersion and percutaneous mitral valvuloplasty. Cardiol Rev 2007;15:42–45. [DOI] [PubMed] [Google Scholar]
- 23. Turhan H, Yetkin E, Atak R, et al Increased P‐wave duration and P‐wave dispersion in patients with aortic stenosis. Ann Noninvasive Electrocardiol 2003;8:18–21. [DOI] [PMC free article] [PubMed] [Google Scholar]
- 24. Asad N, Spodick DH. Prevalence of interatrial block in a general hospital population. Am J Cardiol 2003;91:609–610. [DOI] [PubMed] [Google Scholar]
- 25. Gialafos E, Psaltopoulou T, Papaioannou TG, et al Prevalence of interatrial block in young healthy men<35 years of age. Am J Cardiol 2007;100:995–997. [DOI] [PubMed] [Google Scholar]
- 26. Gialafos EJ, Dilaveris PE, Synetos AG, et al P wave analysis indices in young healthy men: Data from the digital electrocardiographic study in Hellenic Air Force Servicemen (DEHAS). Pacing Clin Electrophysiol 2003;26:367–372. [DOI] [PubMed] [Google Scholar]
- 27. Ninios I, Pliakos C, Ninios V, et al Prevalence of interatrial block in a general population of elderly people. Ann Noninvasive Electrocardiol 2007;12:298–300. [DOI] [PMC free article] [PubMed] [Google Scholar]
- 28. Can I, Onat AM, Aytemir K, et al Assessment of atrial conduction in patients with scleroderma by tissue Doppler echocardiography and P wave dispersion. Cardiology 2007;108:317–321. [DOI] [PubMed] [Google Scholar]
- 29. Yigit Z, Akdur H, Ersanli M, et al The effect of exercise to P wave dispersion and its evaluation as a predictor of atrial fibrillation. Ann Noninvasive Electrocardiol 2003;8:308–312. [DOI] [PMC free article] [PubMed] [Google Scholar]
- 30. Tukek T, Yildiz P, Akkaya V, et al Factors associated with the development of atrial fibrillation in COPD patients: The role of P‐wave dispersion. Ann Noninvasive Electrocardiol 2002;7:222–227. [DOI] [PMC free article] [PubMed] [Google Scholar]
- 31. Dawber TR, Meadors GF, Moore FE, Jr . Epidemiological approaches to heart disease: The Framingham Study. Am J Public Health Nations Health 1951;41:279–281. [DOI] [PMC free article] [PubMed] [Google Scholar]
- 32. Kannel WB, Feinleib M, McNamara PM, et al An investigation of coronary heart disease in families. The Framingham offspring study. Am J Epidemiol 1979;110:281–290. [DOI] [PubMed] [Google Scholar]
- 33. Sagie A, Larson MG, Goldberg RJ, et al An improved method for adjusting the QT interval for heart rate (the Framingham Heart Study). Am J Cardiol 1992;70:797–801. [DOI] [PubMed] [Google Scholar]
- 34. Badilini F, Sarapa N. Implications of methodological differences in digital electrocardiogram interval measurement. J Electrocardiol 2006;39:S152–S156. [DOI] [PubMed] [Google Scholar]
- 35. Kligfield P, Badilini F, Brown B, et al The ISCE ECG genome pilot challenge: A 2004 progress report. J Electrocardiol 2004;37(Suppl.):144–148. [DOI] [PubMed] [Google Scholar]
- 36. Molloy TJ, Okin PM, Devereux RB, et al Electrocardiographic detection of left ventricular hypertrophy by the simple QRS voltage‐duration product. J Am Coll Cardiol 1992;20:1180–1186. [DOI] [PubMed] [Google Scholar]
- 37. D’Agostino RB, Sr , Vasan RS, Pencina MJ, et al General cardiovascular risk profile for use in primary care: The Framingham Heart Study. Circulation 2008;117:743–753. [DOI] [PubMed] [Google Scholar]
- 38. Kannel WB, D’Agostino RB, Silbershatz H, et al Profile for estimating risk of heart failure. Arch Intern Med 1999;159:1197–1204. [DOI] [PubMed] [Google Scholar]
- 39. Levy D, Larson MG, Vasan RS, et al The progression from hypertension to congestive heart failure. JAMA 1996;275:1557–1562. [PubMed] [Google Scholar]
- 40. Wolf PA, D’Agostino RB, Belanger AJ, et al Probability of stroke: A risk profile from the Framingham Study. Stroke 1991;22:312–318. [DOI] [PubMed] [Google Scholar]
- 41. Okin PM, Roman MJ, Devereux RB, et al Electrocardiographic identification of increased left ventricular mass by simple voltage‐duration products. J Am Coll Cardiol 1995;25:417–423. [DOI] [PubMed] [Google Scholar]
- 42. Okin PM, Roman MJ, Devereux RB, et al Gender differences and the electrocardiogram in left ventricular hypertrophy. Hypertension 1995;25:242–249. [DOI] [PubMed] [Google Scholar]
- 43. Newton‐Cheh C, Larson MG, Corey DC, et al QT interval is a heritable quantitative trait with evidence of linkage to chromosome 3 in a genome‐wide linkage analysis: The Framingham Heart Study. Heart Rhythm 2005;2:277–284. [DOI] [PubMed] [Google Scholar]
- 44. Gunduz H, Binak E, Arinc H, et al The relationship between P wave dispersion and diastolic dysfunction. Tex Heart Inst J 2005;32:163–167. [PMC free article] [PubMed] [Google Scholar]
- 45. Kosar F, Aksoy Y, Ari F, et al P‐wave duration and dispersion in obese subjects. Ann Noninvasive Electrocardiol 2008;13:3–7. [DOI] [PMC free article] [PubMed] [Google Scholar]
- 46. Ciaroni S, Cuenoud L, Bloch A. Clinical study to investigate the predictive parameters for the onset of atrial fibrillation in patients with essential. Am Heart J 2000;139:814–819. [DOI] [PubMed] [Google Scholar]
- 47. Kligfield P, Gettes LS, Bailey JJ, et al Recommendations for the standardization and interpretation of the electrocardiogram: Part I: The electrocardiogram and its technology: A scientific statement from the American Heart Association Electrocardiography and Arrhythmias Committee, Council on Clinical Cardiology; the American College of Cardiology Foundation; and the Heart Rhythm Society: Endorsed by the International Society for Computerized Electrocardiology. Circulation 2007;115:1306–1324. [DOI] [PubMed] [Google Scholar]
- 48. Andrikopoulos GK, Dilaveris PE, Richter DJ, et al Increased variance of P wave duration on the electrocardiogram distinguishes patients with idiopathic paroxysmal atrial fibrillation. Pacing Clin Electrophysiol 2000;23:1127–1132. [DOI] [PubMed] [Google Scholar]