Abstract
Studying the pharmacokinetics of antiretroviral drugs in breast milk has important implications for the health of both the mother and the infant, particularly in resource-poor countries. Breast milk is a highly complex biological matrix, yet it is necessary to develop and validate methods in this matrix, which simultaneously measure multiple analytes, as women may be taking any number of drug combinations to combat human immunodeficiency virus infection. Here, we report a novel extraction method coupled to high-performance liquid chromatography and tandem mass spectrometry for the accurate, precise, and specific measurement of 7 antiretroviral drugs currently prescribed to infected mothers. Using 200 µL of human breast milk, simultaneous quantification of lamivudine (3TC), stavudine (d4T), zidovudine (ZDV), nevirapine (NVP), nelfinavir (NFV), ritonavir, and lopinavir was validated over the range of 10–10,000 ng/mL. Intraday accuracy and precision for all analytes were 99.3% and 5.0 %, respectively. Interday accuracy and precision were 99.4 % and 7.8%, respectively. Cross-assay validation with UV detection was performed using clinical breast milk samples, and the results of the 2 assays were in good agreement (P = 0.0001, r = 0.97). Breast milk to plasma concentration ratios for the different antiretroviral drugs were determined as follows: 3TC = 2.96, d4T = 1.73, ZDV = 1.17, NVP = 0.82, and NFV = 0.21.
Keywords: breast milk, HIV, mother-to-child transmission, antiretroviral, nucleoside analogue reverse transcriptase inhibitor, nonnucleoside reverse transcriptase inhibitor, protease inhibitors, LC-MS/MS, chromatography
INTRODUCTION
Women represent 50% of the human immunodeficiency virus (HIV)–infected population worldwide. Mother-to-child transmission of HIV is the most significant source of HIV infection in children younger than 10 years.1 In resource-poor settings, more than 40% of all HIV-1 transmission from mother to infant occurs during breastfeeding.2,3 In these settings, women must breast-feed their babies due to such issues as inadequate financial resources, lack of clean water supplies, and stigma. Recent reports also suggest that breastfed babies of HIV-infected mothers have a significantly lower rate of mortality than formula-fed infants.4 Therefore, a variety of antiretroviral strategies are currently being investigated for prevention of HIV transmission during breastfeeding.3,5 To support this effort, it is necessary to accurately characterize the exposure of antiretrovirals in breast milk to understand both the pharmacodynamics of HIV replication in breast milk and the pharmacology of antiretrovirals in the breast feeding infant.
Because human milk is a highly complex biological matrix, extracting drugs to accurately quantify total concentrations is extremely challenging. Milk contains large amounts of proteins and fats, and the proportions of these vary over time. This complexity necessitates a sophisticated extraction method for accurate and reproducible results. There are a number of methods for isolation of drugs from breast milk described in the literature: dialysis, ultrafiltration, liquid–liquid extraction (LLE), solid phase extraction (SPE), and immunoaffinity extraction. The most successful of those are based on LLE or SPE principles.6 However, the validation of these analytical methods is incomplete, primarily due to difficulties in achieving the requisite precision and accuracy.7
For this investigation, we modified our established multiplex liquid chromatography and tandem mass spectrometry (LC-MS/MS) method for measuring antiretroviral agents in blood plasma8 and combined it with a minor modification to our highly efficient extraction technique for breast milk9 to expand the range of analytes that can be measured in 1 assay. This article presents the validation of a high-performance liquid chromatography and tandem mass spectrometry (HPLC-MS/MS) assay for the simultaneous quantification of lamivudine (3TC), zidovudine (ZDV), stavudine (d4T), nevirapine (NVP), nelfinavir (NFV), lopinavir (LPV), and ritonavir (RTV) in human breast milk. This method was used to determine the extent of drug penetration in breast milk compared with blood plasma.
MATERIALS AND METHODS
Materials
3TC, ZDV, d4T, NVP, NFV, RTV, and LPV were obtained from the NIH AIDS Research & Reference Reagent Program (McKesson HBOC BioServices, Rockville, MD). The internal standard (IS) cimetidine (CMI) was purchased from Sigma Chemical Company (St Louis, MO). HPLC grade water and methanol were purchased from Fisher Scientific (Norcross, GA). Purified compressed nitrogen gas was obtained from National Welder’s Supply (Charlotte, NC). Breast milk was purchased from Biological Specialty Corporation (Colmar, PA). Three drug-free pooled human breast milk samples were obtained from multiple healthy nursing mothers, 1–6 months after delivery.
Instrumentation
A Shimadzu solvent delivery system (Columbia, MD) and a Leap HTC Pal thermostated autosampler (Carrboro, NC) connected to an Applied Biosystems API 4000 triple quadrupole mass spectrometer with a TurboSpray ion source (Applied Biosystems, Foster City, CA) were used for this analytical study. Tuning, operation, integration, and data analysis were performed using Analyst software v. 1.4.1 (Applied Biosystems).
Calibration Standards and Quality Control Samples
A stock solution for each anti-HIV drug (analyte) was prepared at a concentration of 1 mg/mL in a specific ratio of HPLC grade water to methanol. ZDV and NVP required 50% methanol, NFV and RTV required 60% methanol, and LPV required 70% methanol. The water-soluble compounds 3TC and d4T were dissolved in 100% HPLC water. The master stock solution was prepared as a composite of 7 analytes (1 mL each), adjusted in a volumetric flask to the final concentration of 100 µg/mL in 10 mL using 3 mL of 50% methanol in water. This 100 µg/mL stock solution was used to prepare 7 intermediate solutions (100, 250, 500, 1000, 5000, 10,000, and 50,000 ng/mL) in 50% methanol in water. The calibration curve (10, 25, 50, 100, 500, 1000, 5000, and 10,000 ng/mL) was prepared in drug-free pooled breast milk. Quality control (QC) samples were prepared at 80, 200, 800, 2000, and 8000 ng/mL from a separate 100 µg/mL master stock solution.
The IS chosen for this method was CMI. CMI 5 mg was weighed and dissolved in HPLC grade water to achieve a final concentration of 1 mg/mL (IS stock solution). To make the working IS solution, this stock solution was diluted further in HPLC grade water to a final working concentration of 2 µg/mL.
Sample Preparation
Whole breast milk was transferred to clean cryovials and stored at −70°C until analysis. Before extraction, all samples, including blank breast milk samples, clinical samples, calibration standards, and QC samples, were brought to room temperature.
Disruption of fat globules in breast milk with protein precipitation was modified for an mass spectrometry (MS) application from a previously published method.9 To each 200 µL sample of human breast milk (blank, calibrator, QC, or patient sample), 100 µL of normal hexane was added to assist in disruption of the fat globules. The tubes were capped and vortex mixed for 1.0 minute, sonicated for 1.0 minute, and then mixed with 125 µL of 15% pentafluoropropionic acid and 700 µL of CMI working IS (2 µg/mL water). All tubes were capped and vortex mixed for 0.5 minutes and centrifuged at 12,000 rpm (15600g) for 5 minutes at room temperature. The hexane mixed with the fat formed a solid disk at the top of the solution and allowed the supernatant to be poured into a conditioned SPE column while leaving the disk behind.9
Solid Phase Extraction
SPE columns (1 mL, 100 mg BOND ELUTE-C18; Varian, Harbor City, CA) were placed in a vacuum elution manifold (20-SPE system; Waters, Milford, MA). Cartridges were conditioned with 1 mL of HPLC grade methanol and equilibrated with 1.0 mL of 100 mM ammonium acetate (pH 7). The clear sample supernatant was carefully transferred to the conditioned SPE column and allowed to pass through the column bed with minimal suction (2–5 mm Hg). The column was further washed with 1 mL water. Finally, the analytes were eluted with 500 µL of 90 % methanol in HPLC water.
The sample eluant was evaporated to dryness under a nitrogen stream at 40°C, and the residue was reconstituted with 100 µL of a 50:50 mixture of HPLC grade water:HPLC grade methanol with 0.1% (vol/vol) formic acid. The resulting solution was vortexed for 0.5 minutes and centrifuged at 18,000g for 3 minutes. The supernatant was transferred to 200 µL HPLC polypropylene microvials with a support foot (Agilent Technologies), and 10 µL (for negative mode) or 3 µL (for positive mode) of the supernatant was injected into the HPLC column.
High-Performance Liquid Chromatography and MS/MS Detection
All samples were analyzed by LC-MS/MS using an Aquasil C18, 50 × 2.1 mm column, with a 5-µm particle size (Thermo Electron, San Jose, CA), based on a modification of a previously validated sensitive and specific LC-MS/MS method for measuring antiretroviral agents in blood plasma.8 Samples were injected twice, first for negative-mode quantification and second for positive-mode quantification.
Mobile Phase for Negative-Mode Analysis
For negative ion mode using reverse-phase chromatography, the flow rate was 0.75 mL/min. Initial conditions for mobile phase A (mobile phase Aneg) were 100% 10 mM ammonium acetate. These conditions were held for 0.7 minute and the eluant was directed to waste. From 0.7 to 2 minutes, the mobile phase composition increased linearly to 95% methanol (mobile phase Bneg), and the eluant directed to the mass spectrometer. The flow was held at 95% mobile phase Bneg until 2.3 minutes. Finally, the column was equilibrated with 100% mobile phase Aneg. Total runtime, including equilibration, was 3 minutes per injection.
Mobile Phase for Positive-Mode Analysis
For positive ion mode using reverse-phase chromatography, the flow rate was 0.5 mL/min. Initial conditions for mobile phase A (mobile phase Apos) were 100% of 0.1% formic acid in water. This was held for 0.7 minutes and the eluant was directed to waste. From 0.7 to 3 minutes, the mobile phase composition increased linearly to 7% of 0.1% formic acid in methanol (mobile phase Bpos), and the eluant directed to the mass spectrometer. From 3 to 9 minutes, the mobile phase composition increased linearly to 15% mobile phase Bpos. At 9 minutes, the second period of acquisition started. From 9 to 15 minutes, the mobile phase composition increased linearly to 95% mobile phase Bpos. The flow was held at 95% Bpos for 30 seconds. After this wash with 95% Bpos, the column was equilibrated with 100% Apos. Total runtime, including equilibration, was 18 minutes per injection.
Linearity
Linearity was assessed using 3 calibration curves run on separate days. For validation, each point on the calibration curve was run in duplicate (2 separate extractions). After validation, single calibration curves were used for routine clinical sample testing. Standard curve equations for each analyte were derived using weighted (1/x2) linear least-squares regression analysis.
Limits of Detection and Quantification Accuracy and Precision
The lower limit of quantification was defined as the concentration for which both the relative standard deviation (RSD, also called the coefficient of variation) and the percent deviation from the nominal concentration were less than 20%. Additionally, the lower limit of quantification had to have a signal to noise ratio above 5. The upper limit of quantitation was defined as the concentration for which both the RSD and the percent deviation from the nominal concentration were less than 15%.10 The lower limit of detection was defined as a signal to noise ratio of 3:1.
Accuracy and precision were quantified using 5 concentrations of QC samples covering the expected clinical concentrations: 80, 200, 800, 2000 and 8000 ng/mL. The calculated concentrations were compared with these nominal concentrations.
Specificity, Selectivity, Recovery, Matrix Effect, and Stability
Six blank human breast milk samples were prepared to determine the specificity, selectivity, recovery, and matrix effect of the analytical method. One half of the samples (“blank breast milk,” n = 3) were spiked with IS only, and one half of the samples (“double blank breast milk,” n = 3) were not spiked with anything. The double blank breast milk samples received 700 µL of IS-free HPLC grade water to maintain sample composition. With the exception of the addition of IS, all 6 samples were prepared and analyzed as described above. The results of the double blank breast milk samples were investigated for peaks that might interfere either with the detection of the 7 drugs of interest or with the IS. Peaks with an area >200 units and a signal to noise ratio > 1:3 at the retention time of any of the 7 analytes or of the IS were considered to be interfering.
To determine analyte recovery, peak areas of spiked breast milk (test) replicates were compared with those of spiked neat reconstitution solution (control) replicates of equal nominal concentration. Test and control replicates at 200 ng/mL (n = 6 each) and 2000 ng/mL (n = 6 each) were prepared. Test samples were extracted and analyzed as described above.
Possible matrix effects were investigated according to the method of Taylor.11 First, 18 double blank breast milk (test) samples were extracted as described above. At the reconstitution step, solutions containing 80 ng/mL, 200 ng/mL (n = 5), 2000 ng/mL (n = 5), or 8000 ng/mL (n = 5) of all 7 drugs of interest were used. After analysis, peak areas of these reconstituted test samples were compared with those of unextracted neat control samples at equal concentrations. Possible matrix effects were calculated as percent deviation from values observed with standard solutions.
Samples were tested for stability in breast milk at room temperature for 24 hours, in breast milk at 4°C for 72 hours, and in the reconstitution solution at room temperature in the HPLC autosampler for 24 hours.
Analysis of Clinical Samples and Cross-Validation
The clinical samples were obtained from the Breastfeeding, Antiretroviral, and Nutrition study.3,12 The study was approved by the Institutional Review Boards at the University of North Carolina at Chapel Hill and the National Health Science Research Committee in Malawi, and all subjects gave informed consent before enrolling. This study was designed to evaluate antiretroviral and nutrition interventions to reduce MTCT of HIV during breastfeeding. Clinical samples were obtained from women who had been randomized to receive antiretroviral therapy while breastfeeding. These samples were analyzed on 2 different days using 2 different standard curves. Data in both runs were compared to evaluate reproducibility of the methodology, performed as a requisite part of the validation process to ensure optimal interday LC-MS/MS detection. To confirm the quality of the data obtained by HPLC-MS/MS, these results were also compared (using Spearman rho) with those obtained from a validated LC–diode array detection assay.9
RESULTS
LC-MS/MS Analysis
Negative-Mode Analysis
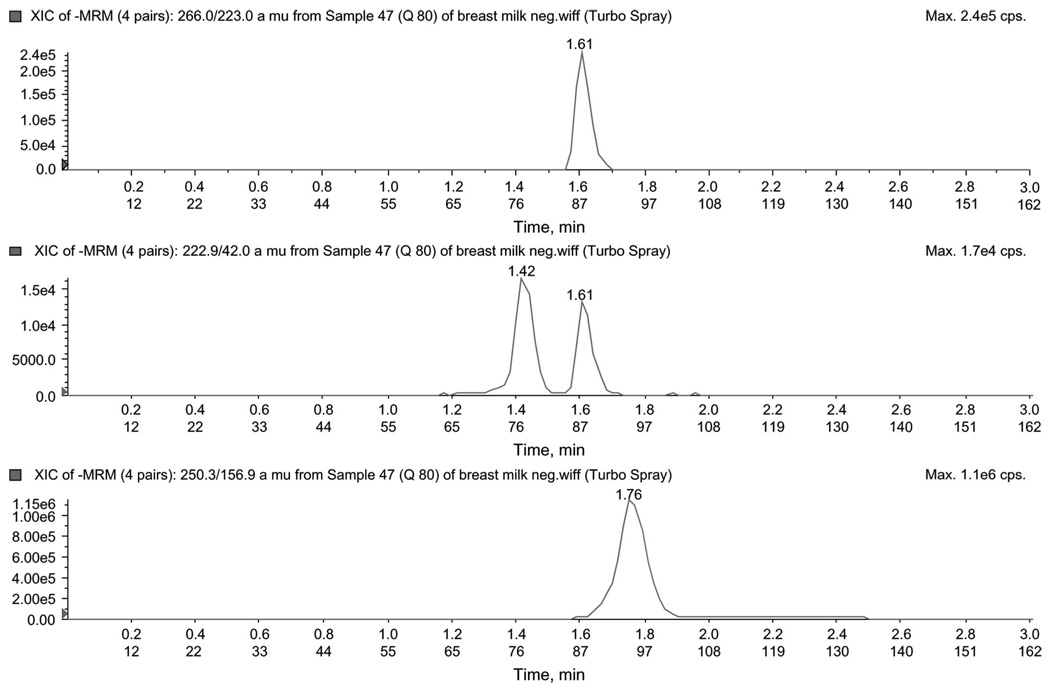
To improve signal intensity of negatively charged drugs, a separate injection using a mobile phase more amenable to producing negative ions was used. d4T (222.9→42.0), ZDV (266.0→223.0), and CMIneg (IS, 250.3→156.9) were monitored using multiple reaction monitoring (MRM) in negative ion mode using reverse-phase chromatography at 0.75 mL/min. As source fragmentation of ZDV produced apparent d4T, care was taken to ensure chromatographic separation between ZDV and d4T. An injection of 10 µL of reconstituted sample was required for an adequate d4T signal. Chromatograms for the negative analysis mode for the low QC are shown in Figure 1.
FIGURE 1.
Chromatogram of low QC (80 ng/mL) in negative mode. The figure illustrates peaks for ZDV (266.0/223.0), d4T (22.9/42.0), and CMI (250.3/156.9) ion pair.
Positive-Mode Analysis
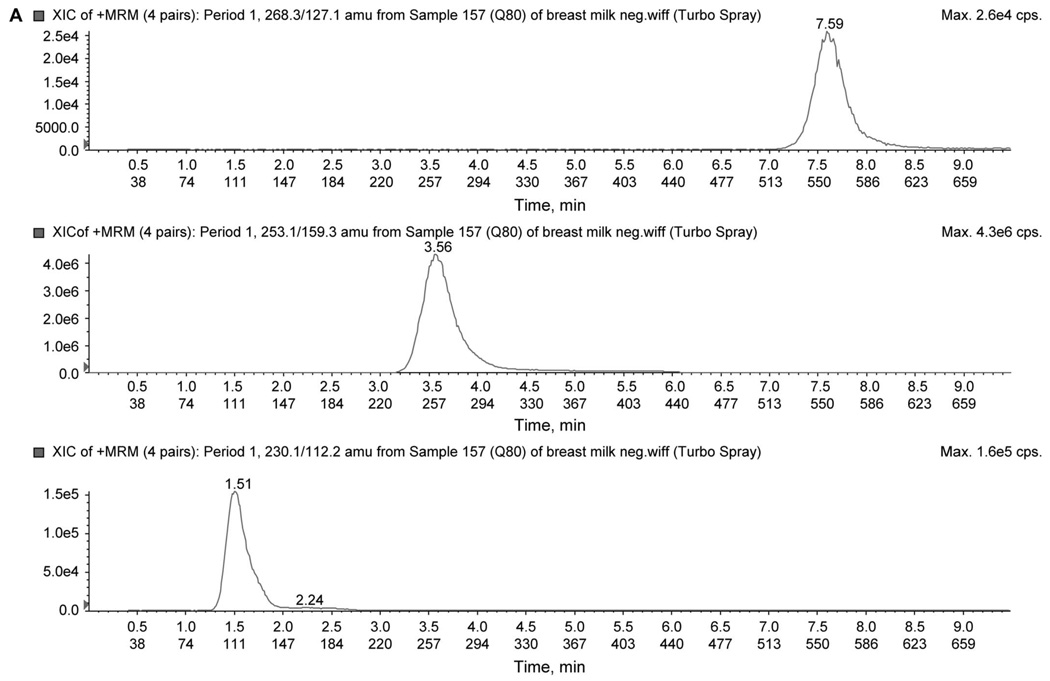
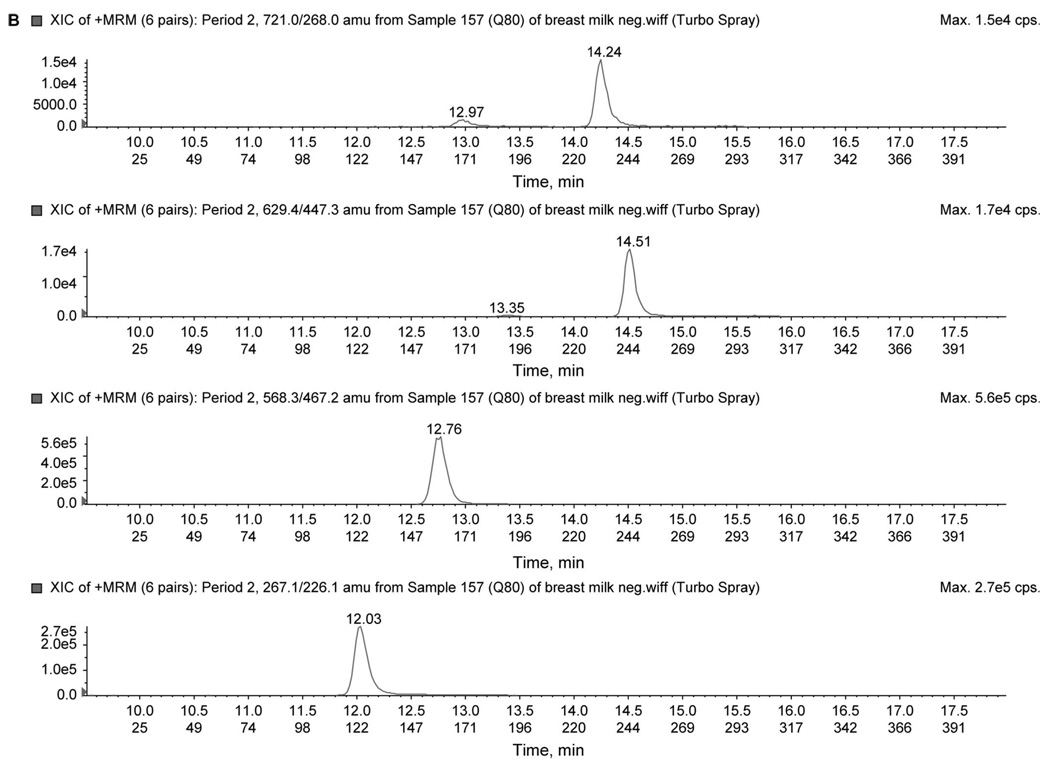
To improve signal intensity of positively charged drugs, a separate injection using a mobile phase more amenable to producing positive ions was used. In addition, a 2-period acquisition was used to reduce duty cycle as a means of further increasing signal intensity. The first period monitored the transitions (MRM) for 3TC (230.1→112.1), ZDV (268.3→127.1), and CMIpos (IS, 253.1→159.3). The second period monitored the transitions for NVP (267.2→226.1), NFV (568.3→467.2), LPV (629.4→447.3), and RTV (721.0→268.0). An injection of 3 µL was required. Chromatograms for the 2-period analysis are shown in Figure 2 using the low QC. All transitions for the 7 analytes are summarized in Table 1.
FIGURE 2.
A, Chromatogram of low QC (80 ng/mL) in positive-mode first period. The figure illustrates peaks for ZDV (268.3/127.1), CMI (253.1/159.3), and 3TC (230.13/112.2) ion pair. B, Chromatogram of low QC (80 ng/mL) in positive-mode second period. The figure illustrates peaks for RTV (721.0/268.0), LPV (629.4/447.3), NFV (568.3/467.2), and NVP (267.1/226.1) ion pair.
TABLE 1.
Mass Spectrometer Transition and Ionization Mode
| Compound Name |
Molecular Weight (g/mol) |
Ionization Mode |
Precursor Ion |
Product Ion |
|---|---|---|---|---|
| 3TC | 222.9 | Positive | 230.1 | 112.2 |
| D4T | 224.1 | Negative | 222.9 | 42.0 |
| CMI | 252.3 | Negative | 250.9 | 156.9 |
| CMI | 252.3 | Positive | 253.1 | 159.3 |
| ZDV | 267.1 | Negative | 265.7 | 222.9 |
| ZDV | 267.1 | Positive | 268.3 | 127.1 |
| NVP | 266.3 | Positive | 267.2 | 226.1 |
| NFV | 567.0 | Positive | 568.3 | 467.2 |
| RTV | 721.0 | Positive | 721.4 | 268.1 |
| LPV | 627.8 | Positive | 628.7 | 447.3 |
Assay Validation Linearity and Limits of Quantification
Standard curves over 3 days for d4T and ZDV were quantified using the peak area ratios (analyte peak area to ISneg peak area) of the spiked calibration standards (10–10,000 ng/mL). Standard curves over 3 days for 3TC, ZDV, NVP, NFV, RTV, and LPV were quantified using the peak area ratios (analyte peak area to ISpos peak area) of the spiked calibration standards (10–10,000 ng/mL). A weighted (1/x2) least-squares regression analyses were used for all analytes.
All drugs were linear over 10–10,000 ng/mL. Standard curve data are summarized in Table 2. The accuracy was between 80% and 120% for all levels (n = 3) and LLOQ (n = 5). At the LLOQ, accuracy and co-efficient of variation (CV%) were 117%–88% and 1.3%–8.4%, respectively, for all analytes. Calibration standard curves yielded correlation coefficients consistently ≥0.990 for all analytes across 3 different days. Concentrations ranging from 10 to 10,000 ng/mL were sufficient to quantify 3 nucleoside analogue reverse transcriptase inhibitors (3TC, d4T, and ZDV), 1 nonnucleoside reverse transcriptase inhibitor (NVP), and 3 protease inhibitors (NFV, RTV, and LPV).
TABLE 2.
Summary of Standard Curves, Linearity Range, r2, Slope, Intercept Values, Recovery, and Matrix Effect
| Drug | Range (ng) |
r2 | Recovery (%) |
Matrix Effect (% Deviation) |
|---|---|---|---|---|
| 3TC | 10–10,000 | 0.994 | 95.4 | −1.9 |
| D4T | 10–10,000 | 0.995 | 88.5 | −6.0 |
| ZDV | 10–10,000 | 0.998 | 92.6 | 1.3 |
| NVP | 10–10,000 | 0.994 | 99.3 | 2.0 |
| NFV | 10–10,000 | 0.992 | 89.0 | −3.6 |
| RTV | 10–10,000 | 0.996 | 86.7 | 6.4 |
| LPV | 10–10,000 | 0.993 | 96.6 | 4.5 |
| CMI Negative | 82.0 | −1.8 | ||
| CMI Positive | 82.0 | 3.3 |
Assay Accuracy and Precision
Accuracy and precision of the analytical procedure were evaluated using 3 concentrations of QC samples assayed in 3 replicates on 3 different days. The concentrations of the QC samples were back-calculated from daily calibration curves. Intra- and interday accuracy and precision for these concentrations are presented in Table 3. Accuracy for all analytes was within the acceptance limits (±15% of the nominal) specified by Shah et al.10 The ≤15% RSD criteria for repeatability (within-day precision) and time-different intermediate precision (between-day precision) were fulfilled for all analytes. Using the mean values, overall intraday accuracy and precision for all analytes were 99.3% and 5.0%, respectively, and interday accuracy and precision were 99.4% and 7.8%, respectively.
TABLE 3.
Summary of Accuracy and Precision for Method Validation of 7 Antiretroviral Drugs
| Within Day |
Between Day |
||||
|---|---|---|---|---|---|
| Anti-HIV Drug |
Concentration (ng/mL) |
Accuracy % (n = 5) |
CV% (n = 5) |
Accuracy % (n = 9) |
CV% (n = 9) |
| 3TC | 80 | 110 | 6.9 | 99 | 7.9 |
| 200 | 96 | 4.6 | 97 | 5.1 | |
| 800 | 101 | 2.4 | 103 | 5.2 | |
| 2000 | 101 | 6.4 | 104 | 2.8 | |
| 8000 | 110 | 9.1 | 111 | 12.2 | |
| D4T | 80 | 112 | 3.9 | 108 | 12.9 |
| 200 | 89 | 7.4 | 95 | 13.0 | |
| 800 | 84 | 4.5 | 87 | 4.6 | |
| 2000 | 86 | 3.2 | 98 | 10.7 | |
| 8000 | 103 | 11.5 | 96 | 12.2 | |
| ZDV | 80 | 105 | 6.9 | 113 | 7.3 |
| 200 | 91 | 5.9 | 92 | 4.3 | |
| 800 | 96 | 2.4 | 95 | 7.7 | |
| 2000 | 95 | 6.3 | 100 | 2.1 | |
| 8000 | 113 | 3.0 | 107 | 9.0 | |
| NVP | 80 | 116 | 3.6 | 110 | 7.3 |
| 200 | 101 | 4.4 | 99 | 5.3 | |
| 800 | 103 | 4.9 | 104 | 7.9 | |
| 2000 | 107 | 3.5 | 106 | 3.6 | |
| 8000 | 106 | 4.0 | 107 | 7.3 | |
| NFV | 80 | 109 | 6.7 | 108 | 12.1 |
| 200 | 105 | 0.5 | 99 | 9.4 | |
| 800 | 100 | 3.1 | 98 | 7.3 | |
| 2000 | 104 | 3.3 | 91 | 9.9 | |
| 8000 | 98 | 3.2 | 94 | 10.2 | |
| RTV | 80 | 107 | 5.8 | 116 | 9.8 |
| 200 | 104 | 2.8 | 104 | 7.9 | |
| 800 | 96 | 6.6 | 103 | 9.9 | |
| 2000 | 99 | 5.7 | 107 | 7.0 | |
| 8000 | 104 | 1.9 | 99 | 9.4 | |
| LPV | 80 | 114 | 5.5 | 116 | 10.8 |
| 200 | 103 | 0.9 | 102 | 5.6 | |
| 800 | 104 | 6.4 | 108 | 11.9 | |
| 2000 | 92 | 12.2 | 89 | 9.5 | |
| 8000 | 90 | 10.5 | 88 | 8.2 | |
CV, co-efficient of variation.
Selectivity, Recovery, Matrix Effect, and Stability
No peaks interfering with any of the 7 analytes or the IS were detected. Figure 2 illustrates the peaks in both positive and negative modes for the low QC sample.
Extraction recovery and matrix effects for all analytes are listed in Table 2. The extraction method demonstrated high extraction efficiency for all compounds and IS. Overall, recoveries of 92.6% (range 86.7%–99.3%) with an RSD of 5% (range 3.5%–6.4%) were obtained.
All analytes were stable under all conditions tested. Drugs retained greater than 92% of their original concentration in milk for 24 hours at room temperature, greater than 97% of their concentration for 72 hours at 4°C, and greater than 95% of their concentration in the reconstitution solution for 24 hours at room temperature in the HPLC autosampler.
Reproducibility of Clinical Samples and Cross-Assay Validation
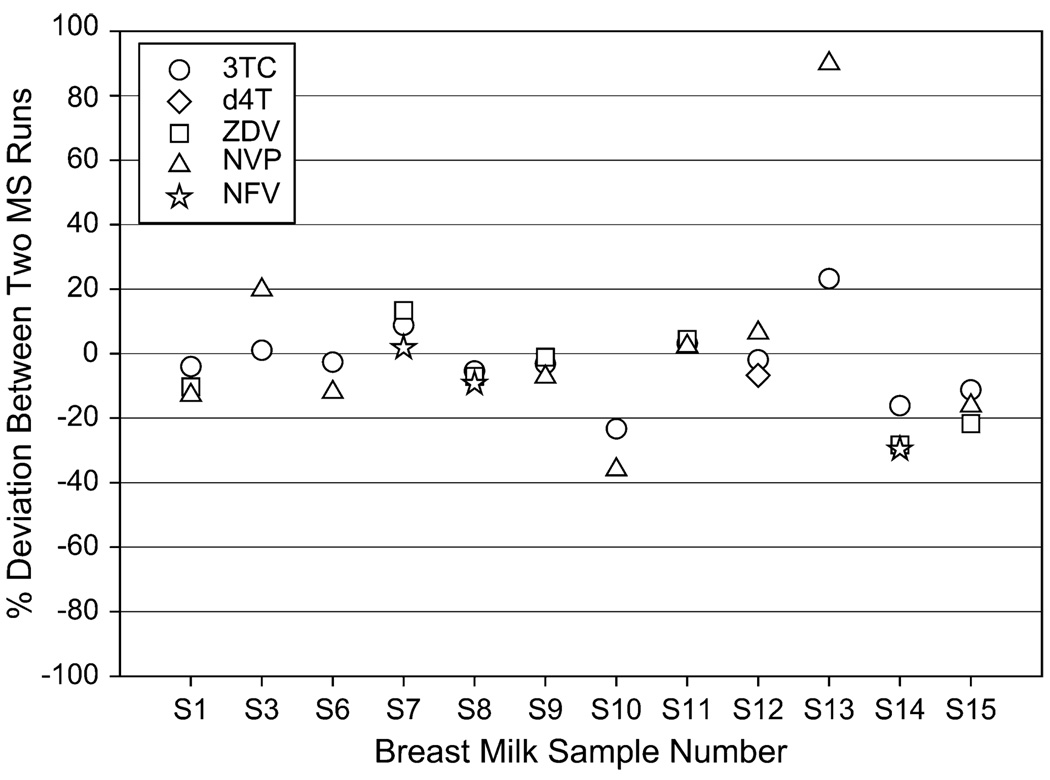
LC-MS/MS results for 15 clinical breast milk samples were compared in 2 different runs on 2 separate days. The average concentrations are represented and the percent deviation between the 2 runs for each analyte is shown in Figure 3.
FIGURE 3.
Percent deviation between 2 LC-MS/MS runs for 15 clinical samples.
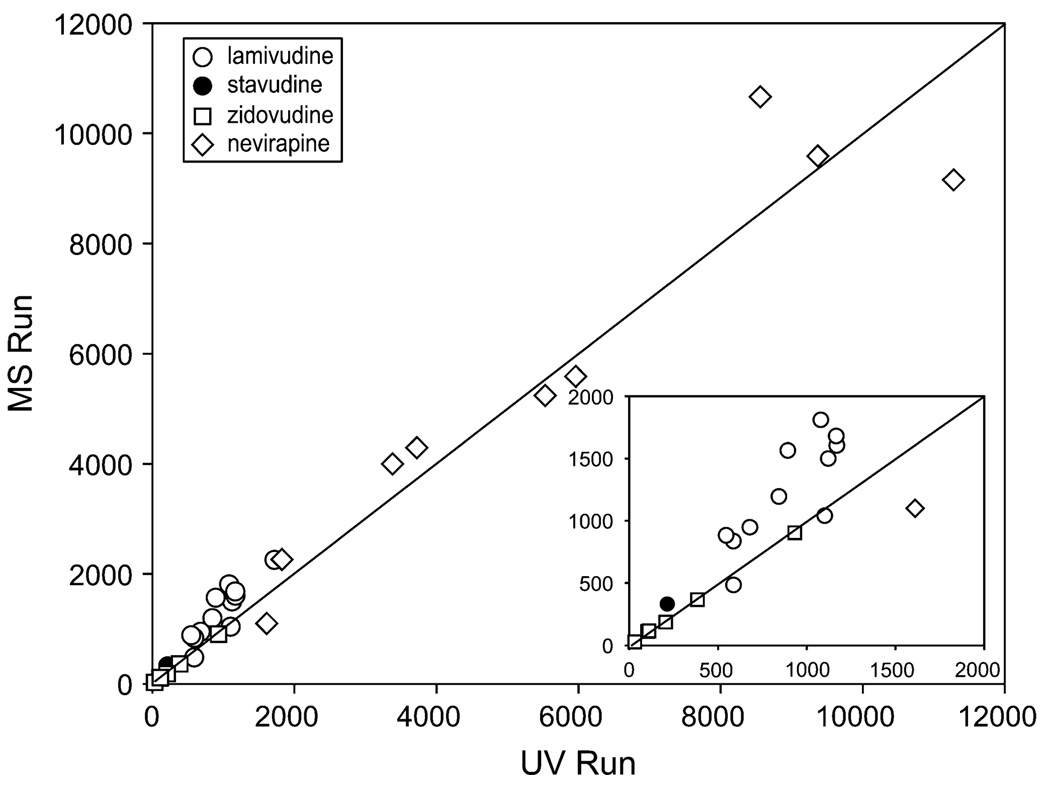
Finally, the results obtained by LC-MS/MS were compared with those obtained by the LC–diode array detection. Figure 4 plots the concentrations obtained by both methods with reference to the line of unity (m = 1) and illustrates good agreement between the assays’ final results. Spearman rho on these values was 0.97, with a P value of < 0.0001.
FIGURE 4.
Comparison of results between LC-MS/MS and LC-diode array detection (UV).
Breast Milk to Plasma Ratio
The breast milk concentrations were compared with plasma concentrations obtained concurrently in these women and measured using a validated UV method.13 The breast milk to blood plasma drug concentration ratios are listed in Table 4. The mean breast milk to blood plasma concentration ratios were >1 for 3TC, d4T, and ZDV (2.96, 1.73, and 1.17, respectively) and <1 for NVP and NFV (0.82 and 0.21, respectively). Of 60 samples analyzed for mothers taking LPV and RTV, no drug was detected in breast milk.
TABLE 4.
Breast Milk to Blood Plasma Concentration Ratios for 7 Antiretroviral Drugs
| 1 3TC BM/BP (n = 49) |
2 d4T BM/BP (n = 2) |
3 ZDV BM/BP (n = 21) |
4 NVP BM/BP (n = 39) |
5 NFV BM/BP (n = 29) |
6 RTV BM/BP (n = 60) |
7 LPV BM/BP (n = 60) |
|---|---|---|---|---|---|---|
| 2.96 | 1.73 | 1.17 | 0.82 | 0.21 | NA | NA |
NA, not available; BM, breast milk; BP, blood plasma.
DISCUSSION
Human milk is an optimal form of nourishment for infants.14 It is a complex biological matrix, whose components vary with the time of day, the day of lactation, from mother to mother, and among species.15 However, breast milk is also the source for HIV infection among a significant proportion of children in the developing world. Antiretroviral therapy, given to the mother during the baby’s first months of life, is being investigated as a possible intervention to prevent HIV transmission. As such, there is a need for accurately measuring antiretroviral drugs in breast milk to best understand the viral dynamics of HIV in this matrix and to accurately predict drug exposure in the infant.
In testing whether our UV method for blood plasma protease inhibitor quantitation16 could be used for breast milk, we had difficulties quantifying RTV and LPV and were only able to measure NVP and NFV accurately after LLE. Even after using a previously reported SPE technique9 (with modifications as described above), we found significant matrix interference that eliminated the possibility of accurate measures using LC-UV detection. Therefore, it was necessary to proceed to a highly selective detection method such as MS/MS.
MS/MS is the most advanced technology for small molecule analysis today.17 However, for any biological matrix, it is not useful without a good sample extraction method and an efficient chromatographic separation. MS/MS detection has several technical problems, which can limit its use in clinical pharmacology applications. These include ion suppression and ion enhancement due to matrix effects, limited dynamic range, and carryover. In this study, we overcame the dynamic range problem by modifying a previous method8 and widened the range from 1–500 to 10–10,000 ng/mL.
Additionally, extensive sample cleanup was needed before analysis. In this study, we modified a highly efficient extraction technique9 to include 3 additional protease inhibitors. This method now allows simultaneous extraction and analysis of nonpolar and highly lipophilic compounds (RTV and LPV) with relatively polar compounds (3TC and d4T)
To accommodate the lipophilicity of protease inhibitors, an increased amount of pentafluoropropionic acid (to 125 µL) was used to completely disrupt the fat globules. Additionally, increasing the organic portion of the eluting solution from 70% methanol (which was sufficient for eluting only 3TC, d4T, ZDV, and NVP) to 90% was necessary to elute RTV and LPV and increase extraction efficiency.
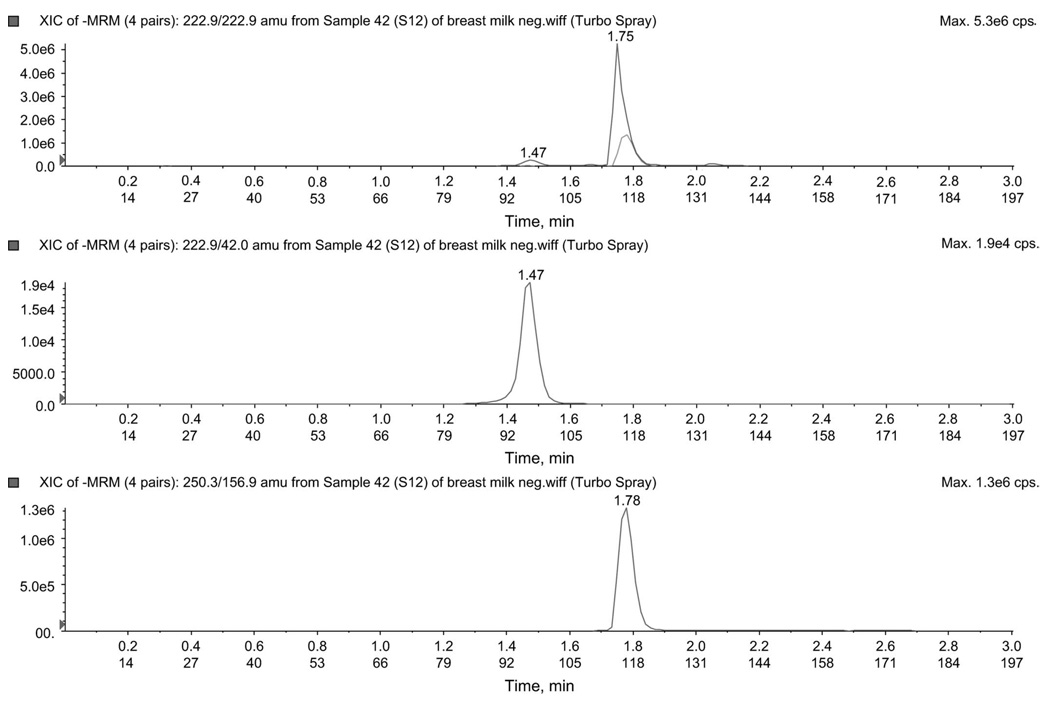
Electrospray ionization in both the positive and negative ion mode was used to detect all analytes. Therefore, it was critical for an IS to be chosen, which could be ionized in both negative and positive modes. Although an isotopically labeled IS may negate matrix effects, these can be very expensive to purchase or produce. Our CMI IS fulfilled the requirements of an IS and was less expensive. CMI, also used in our previous method,8 could be ionized in both modes. The extraction efficiency and matrix effect for CMI are shown in Table 2. Figure 5 illustrates a negative ion mode chromatogram for d4T and CMI in a clinical sample, and d4T concentration calculated as 213.8 ng/mL.
FIGURE 5.
Chromatogram in negative mode for 1 clinical sample. The figure illustrates peaks for d4T (222.9/42.0) and IS CMI (250.3/156.9) ion pairs.
CONCLUSIONS
This HPLC-MS/MS assay is comprehensive and capable of analyzing the most commonly investigated antiretroviral drugs for preventing vertical HIV transmission during breastfeeding. A modification of our highly efficient extraction technique for measuring antiretroviral drug concentrations in breast milk9 was made to include 3 protease inhibitors (NFV, RTV and LPV) in the analysis. Additionally, modifications to a previously published LC-MS/MS method8 included (1) improving the peak intensity for d4T by using negative mode, in an independent injection; (2) optimizing injection volumes for positive mode (3 µL) to avoid detector saturation and negative mode (10 µL) to increase sensitivity; (3) monitoring the 13 C detector transitions to avoid detector saturation; and (4) improving analyte sensitivity in positive mode by using 2 periods. Finally, based on our experience with this extraction method, the following sample treatment procedures should be followed for optimal results: (1) breast milk should be homogenized at room temperature before spiking with anti-retroviral drugs; (2) a bulk amount of breast milk calibrators, QCs, and blanks should be prepared at one time through intermediate stock solutions, not through serial dilution; (3) mix the drugs well using gentle agitation; and (4) continually mix the samples while aliquoting to ensure equal distribution of fat (and drug) in each tube at all concentration levels (this is particularly important for highly fat-soluble compounds).
This approach is recommended for simultaneously analyzing polar and nonpolar compounds in human breast milk in addition to other matrices containing large amounts of fat.
ACKNOWLEDGMENTS
This research was supported by the University of North Carolina Center for AIDS Research (P30 AI50410) and AI54980 (A.D.M.K.). It is a part of a PhD thesis in the Faculty of Science, Chemistry Department, Tanta University, Tanta, Egypt.
REFERENCES
- 1.Connor EM, Sperling RS, Gelber R, et al. Reducing the risk of maternalinfant transmission of HIV: a door is opened. N Engl J Med. 1994;331:1173. doi: 10.1056/NEJM199411033311801. [DOI] [PubMed] [Google Scholar]
- 2.The Breastfeeding and HIV International Transmission Study Group. Coutsoudis A, Dabis F, et al. Late postnatal transmission of HIV-1 in breast-fed children: an individual patient data meta-analysis. J Infect Dis. 2004;189:2154. doi: 10.1086/420834. [DOI] [PubMed] [Google Scholar]
- 3.De Cock KM, Fowler MG, Mercier E, et al. Prevention of mother-to-child HIV transmission in resource-poor countries: translating research into policy and practice. JAMA. 2000;283:1175. doi: 10.1001/jama.283.9.1175. [DOI] [PubMed] [Google Scholar]
- 4.Thior I, Shahin L, Smeaton L, et al. Breastfeeding plus infant zidovudine prophylaxis for 6 months vs formula feeding plus infant zidovudine for 1 month to reduce mother-to-child HIV transmission in Botswana: a randomized trial: the Mashi Study. JAMA. 2006;296:794. doi: 10.1001/jama.296.7.794. [DOI] [PubMed] [Google Scholar]
- 5.UNAIDS. AIDSEpidemic Update—December 2003. Vol. 3. Geneva, Switzerland: Joint United Nation Program on HIV/AIDS; 2003. pp. 7–13. [Google Scholar]
- 6.Rossi DT, Wright DS. Analytical considerations for trace determinations of drugs in breast milk. J Pharm Biomed Anal. 1997;15:495. doi: 10.1016/s0731-7085(96)01880-8. [DOI] [PubMed] [Google Scholar]
- 7.US Department of Health and Human Services Food and Drug Administration. Guidance for Industry: Biological Method Evaluation. Available at: http://www.fda.gov/cder/guidance/. Accessed June 1, 2007.
- 8.Jung BH, Rezk NL, Bridges AS, et al. Simultaneous determination of 17 antiretroviral drugs in human plasma for quantitative analysis with liquid chromatography-tandem mass spectrometry. Biomed Chromatogr. 2007;21:1095. doi: 10.1002/bmc.865. [DOI] [PubMed] [Google Scholar]
- 9.Rezk NL, Fargally AM, Kashuba AD. Development of a highly efficient extraction technique and specific multiplex assay for measuring antiretroviral drug concentrations in breast milk. Ther Drug Monit. 2007;29:429. doi: 10.1097/FTD.0b013e318074db39. [DOI] [PubMed] [Google Scholar]
- 10.Shah VP, Midha KK, Findlay JW, et al. Bioanalytical method validation: a revisit with a decade of progress. Pharm Res. 2000;17:1551. doi: 10.1023/a:1007669411738. [DOI] [PubMed] [Google Scholar]
- 11.Taylor PJ. High-performance liquid chromatography-mass spectrometry in the clinical laboratory. Ther Drug Monit. 2005;27:689. doi: 10.1097/01.ftd.0000179844.45589.c7. [DOI] [PubMed] [Google Scholar]
- 12.Van der Horst C, Fiscus S, Piwoz E, et al. Antiviral Ther. 2003;8(Suppl 1):S477. [Google Scholar]
- 13.Rezk NL, Tidwell RR, Kashuba AD. Simultaneous determination of six HIV nucleoside analogue reverse transcriptase inhibitors and nevirapine by liquid chromatography with ultraviolet absorbance detection. J Chromatogr B Analyt Technol Biomed Life Sci. 2003;791:137. doi: 10.1016/s1570-0232(03)00224-1. [DOI] [PubMed] [Google Scholar]
- 14.ESPGAN, Committee on Nutrition. Comment on the content and composition of lipids in infant formulas. Acta Paediatr Scand. 1991;69:654. doi: 10.1111/j.1651-2227.1991.tb11969.x. [DOI] [PubMed] [Google Scholar]
- 15.Lawrence RA. Breastfeeding, and medical disease. Med Clin North Am. 1989;73:583. doi: 10.1016/s0025-7125(16)30659-9. [DOI] [PubMed] [Google Scholar]
- 16.Rezk NL, Rustin D, Kashuba AD. Full validation of an analytical method for the HIV-protease inhibitor atazanavir in combination with 8 other antiretroviral agents and its applicability to therapeutic drug monitoring. Ther Drug Monit. 2006;28:217. doi: 10.1097/00007691-200608000-00006. [DOI] [PubMed] [Google Scholar]
- 17.Annesley TM. Ion suppression in mass spectrometry. Clin Chem. 2003;49:1041. doi: 10.1373/49.7.1041. [DOI] [PubMed] [Google Scholar]


