

Abstract
Mass analysis of proteolytic fragment peptides following hydrogen/deuterium exchange offers a general measure of solvent accessibility/hydrogen bonding (and thus conformation) of solution-phase proteins and their complexes. The primary problem in such mass analyses is reliable and rapid assignment of mass spectral peaks to the correct charge state and degree of deuteration of each fragment peptide, in the presence of substantial overlap between isotopic distributions of target peptides, autolysis products, and other interferant species. Here, we show that at sufficiently high mass resolving power (m/Δm50% ≥ 100,000), it becomes possible to resolve enough of those overlaps so that automated data reduction becomes possible, based on the actual elemental composition of each peptide without the need to deconvolve isotopic distributions. We demonstrate automated, rapid, reliable assignment of peptide masses from H/D exchange experiments, based on electrospray ionization FT-ICR mass spectra from H/D exchange of solution-phase myoglobin. Combined with previously demonstrated automated data acquisition for such experiments, the present data reduction algorithm enhances automation (and thus expands generality and applicability) for high-resolution mass spectrometry- based analysis of H/D exchange of solution-phase proteins.
Hydrogen/deuterium exchange (HDX) provides a direct measure of solvent exposure and hydrogen bonding to various segments (mass spectrometry) or residues (NMR) of proteins and their complexes in solution [1-4]. As such, it offers general access to protein solution higher-order structure (based on differences in amide hydrogen exchange rate among α-helix, β-sheet, and unstructured loops) and mapping of contact surfaces in protein complexes (based on difference in exchange rate between free and bound protein) [5-7]. In mass spectrometry-based HDX, a typical H/D exchange experiment begins by dilution of a protein solution tenfold with D2O buffer. After each of a series of H/D exchange periods, the reaction is quenched by lowering the pH to ~2.3–2.5 and temperature to ~0 °C, and proteolysis is achieved by addition of a low-pH protease such as pepsin. A very rapid on-line high performance liquid chromatography (HPLC) step prepares the sample for microelectrospray [8] mass spectrometry. With increasing H/D exchange period, the mass of each exposed segment of the protein increases, and can be monitored by mass spectrometry [6]. Although the “front end” procedures (dilution, HDX incubation, quenching, digestion, HPLC desalting, and electrospray ionization mass spectral data acquisition) have been successfully automated for both low-resolution [1] and high-resolution [9, 10] mass analyzers, automated data analysis for low-resolution [11, 12] or even high-resolution [13, 14] mass spectral data remains problematic.
Even before H/D exchange begins, the naturalabundance isotopic distributions for different peptides can overlap (Figure 1 top). However, it is relatively straightforward to select mass spectral peaks, determine their mass and charge states, and assign each peak to the correct peptide with “peak-picking” programs, particularly for multiply-charged peptides detected at mass resolving power sufficient to resolve species differing by ~1 Da in mass. For example, the charge state may be determined as the one which most closely matches the natural-abundance isotopic distribution for a peptide having that mass and composed of “average” amino acids (“averagine”) [15, 16]. However, as H/D exchange proceeds, the number of deuteriums in a given peptide can range from zero to the total number of peptide backbone N-H groups, and each of those masses is convolved with the natural abundance isotopic distribution (comprised mainly of 13C and 15N). It is in principle possible to deconvolve the natural abundance isotopic distribution to leave just the deuterium incorporation distribution [17]. However, in practice, such deconvolution is not sufficiently reliable to enable automated data reduction, due to limited signal-tonoise ratio and peak overlap in complex mixtures of many peptides: “Deconvolution is generally an illconditioned problem that does not necessarily have a unique solution even in the absence of noise.” [18]
Figure 1.
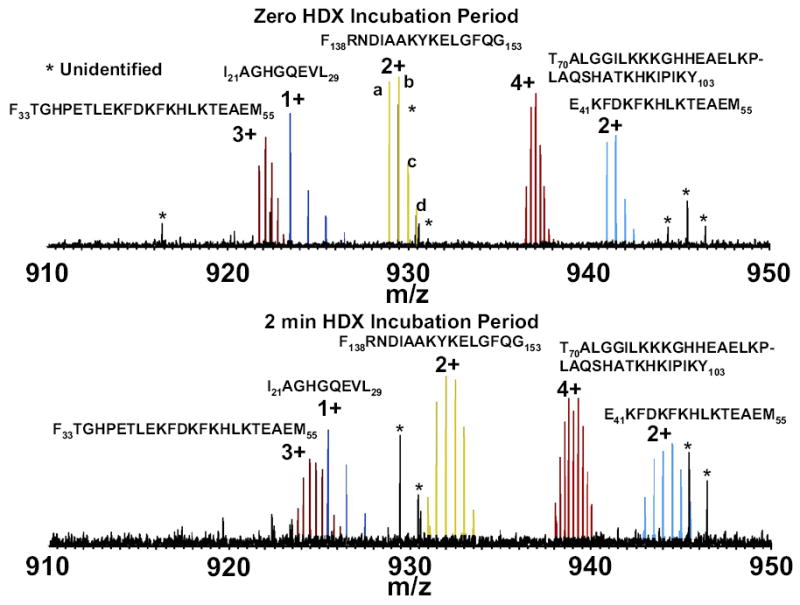
ESI FT-ICR mass spectra, showing five myoglobin peptide ions 910 < m/z < 950. Top: blank control experiment (no exposure to D2O). Peaks a–d for F138RNDIAAKYKELGFQG153 (2+ charge state) represent the natural abundance isotopic distribution (a = monoisotopic, and b–d contain 1–3 13C plus 15N atoms. Bottom: same display, but for peptides isolated after 2 min of H/D exchange.
Moreover, different peptide segments increase in mass at different rates, so the isotopic distributions can “cross over” each other (Figure 1, bottom). Thus, a single unresolved mass spectral peak may represent not only different combinations of 13C and 15N (e.g., 12Cc-2 13C2 1Hh 14Nn, 12Cc-1 13C1 1Hh 14Nn-1 15N1, and 12Cc 1Hh 14Nn-2 15N2, each ~2 Da higher in mass than the “monoisotopic” species, 12Cc 1Hh 14Nn) but also different numbers of deuteriums instead of hydrogens (e.g., 12Cc-1 13C1 1Hh-1 2H1 14Nn, 12Cc 1Hh-1 2H1 14Nn-1 15N1, 12Cc 1Hh-2 2H2 14Nn). The issue then becomes how to separate the number of deuteriums from the approximately isobaric combinations of 13C and 15N, so as to be able to generate the correct profile for number of deuteriums exchanged as a function of H/D exchange period for each peptide. In prior recent efforts to automate HDX analysis, this problem has been discussed [10, 11, 14, 18].
High-resolution Fourier transform ion cyclotron resonance mass spectrometry (FT-ICR MS) [19] provides mass resolving power (m/Δm50% ≥ 100,000, in which Δm50% denotes mass spectral peak full width at halfmaximum peak height) sufficient to resolve virtually all of the overlapped peptide isotopic distributions in such experiments [5-7, 10, 20-23]. In this paper, we devise an algorithm that can make those assignments reliable, rapid, and automatic, based on high-resolution, accurate Fourier transform ion cyclotron resonance mass spectral data. The present HDX analysis is based on the actual elemental composition of each peptide, and selects correct deuterated peptide assignments based on consideration of all possible numbers of deuteriums per peptide. The method also avoids the need to deconvolve isotopic distributions, and is thus less sensitive to experimental noise.
Experimental
Sample Preparation
Lyophilized horse heart myoglobin was purchased from Sigma Chemicals, St. Louis, MO, USA. The proteolytic enzyme, pepsin, was purchased as a lyophilized powder from Roche Molecular Biochemicals, Indianapolis, IN, USA. HPLC grade solvents were purchased from Fisher Scientific Research, Suwanee, GA, USA. D2O (99.96%) and all other chemicals were obtained from Sigma Chemicals. Myoglobin was dissolved in aqueous sodium phosphate buffer (50 mM, pH 8.0) to give 250 μL stock solution at 80 μM. Pepsin stock solution (~80 μM) was prepared fresh in 0.5% formic acid (pH 2).
Hydrogen/Deuterium Exchange
HDX was followed for 12 exchange periods (0, 30 s, 1, 2, 4, 8, 15, 30 min, 1, 2, 4, and 8 h) and a blank (no initial dilution with D2O), each with three replicates. The HDX reaction was initiated by dilution of 5 μL myoglobin stock solution in deuterated phosphate buffer (50 mM, pH 8.0) to 50 μL. A fully exchanged control was prepared separately by letting myoglobin solution exchange at 37 °C overnight. H/D exchange was quenched by lowering pH to 2.5, and protein digestion initiated by addition of an equivalent volume (50 μL) of pepsin stock solution. Ten μL of the resulting peptide mixture was injected onto an HPLC column before mass analysis. During HDX incubation and separation, all stock solutions, buffers, HPLC column, and solvents were kept at a constant temperature of 1 °C.
Automated Data Acquisition
Automated HDX data acquisition has been previously described [9, 10, 24, 25]. Here, a single head Leap HTS Pal was configured to perform an entire HDX experiment automatically: sample dilution with D2O (1:10), mixing, H/D exchange (three replicates each for blank, 12 increasing exchange periods, and fully exchanged), quenching, pepsin digestion (2 min at ~1 °C and pH 2.5), HPLC injection, and data acquisition by FT-ICR MS. HDX incubation periods were interlaced so as to complete the experiment in ~11.5 h, compared with more than 48 h for serial incubation periods.
HPLC and Mass Spectrometry
Following pepsin digestion, the Leap injected each sample onto a cooled (1 °C) 1 mm × 50 mm Vydac C–8 column for gradient elution, starting 1.5 min after sample injection (A = 95% H2O, 4.5% acetonitrile, 0.5% formic acid; B = 95% acetonitrile, 4.5% H2O, 0.5% formic acid; 0% B to 95% B in 1.5 min) by use of Shimadzu pumps (Shimadzu LC-10 AD HPLC system, Shimadzu Corporation, Kyoto, Japan) at 50 μL/min (mainly to remove salt and buffers, with only slight separation of peptides—a peak capacity of ~8). A 1/100 post-column split was made to a micro-ESI source interfaced to a 14.5 Tesla FT-ICR mass spectrometer [26] custom-interfaced to a ThermoFisher LTQ front end [27, 28]. Mass spectra were collected from 400 < m/z < 2000 at high mass resolving power (m/Δm50% = 200,000 at m/z 400), starting 4.5 min after sample injection.
The total data acquisition period for each sample was 7 min. To reduce space charge variation (and thus ICR frequency shift) from scan to scan, external ion accumulation was performed in the linear ion trap with a target ion population of one million charges collected for each FT-ICR measurement. LTQ-accumulated ions were transferred through three octopole ion guides to a capacitively coupled [29] closed cylindrical ICR cell for analysis. Typical ion accumulation period was less than 100 ms during peptide elution and the FT-ICR time domain signal acquisition period is 767 ms (i.e., a duty cycle of ~1 Hz). Automatic gain control [27] and high magnetic field provide excellent external calibration mass accuracy (typically less than 500 ppb RMS) [26].
Data Reduction
Data reduction was automated by three stages of software (see below). All three can run separately, but files generated by the first two are required for the third. Code was written in Visual Basic (Microsoft Development Environment 203, version 7.1.3088 and Microsoft Net Framework 1.1, version 1.1, 4322SP). Experimental mass spectral data were collected and stored in Xcalibur file format (Xcalibur Data System 2.0 Initial Release, 14 Feb 2005). Raw Xcalibur files were processed by ActiveX control (Xcaliburfileslib, XDK Xcalibur Files 1.2 type library, version 1.0, ThermoFisher Scientific, San Jose, CA, USA).
Automated Proteolytic Peptide List Formation (Supplementary Figure 1 Flowchart, which can be found in the electronic version of this article)
This analysis is performed on peptides following peptic digestion of the blank control (i.e., no deuterium incorporation). The user specifies: LC scan number range during which peptides elute; m/z range over which peptide signals are expected; peak relative magnitude threshold limit (as a multiple of rms baseline noise), χ2 threshold cutoff value (for fitting the natural abundance isotopic envelope to the poly-averagine equivalent); inter-peak spacing tolerance (typically ±0.003 Da); protein amino acid sequence; and acceptable ppm error tolerance for amino acid composition assignment. The algorithm identifies monoisotopic m/z and charge state (from the m/z separation between 12Cc and 13C1 12Cc-1 ions. Peaks with no assigned charge are removed, as well as multiple entries for the same peptide of the same charge. Uniquely assigned peptides are then listed, along with their amino acid sequences and number of exchangeable backbone amide hydrogens.
Automated HDX Experiment Cumulative Peak List File Formation
The flowchart for this step is not shown. This program joins peak lists from all collected scans into a single cumulative peak list (for further processing), and then calculates the m/z number-average and magnitude for each identified isotopic multiplet.
Automated Peptide Isotopic Envelope Peak Extraction (Supplementary Figure 2 flowchart)
Here, the user sets a “subwindow” tolerance (i.e., the m/z range within which the various (unresolved) peaks in the distribution are expected [9, 14]. Our “subwindows” are similar in concept to those used in the software program, “The Deuterator” [14], but they are calculated differently (see below). The program then compares each spectral peak position to that for the midrange of the subwindow. The final output is the deuterium incorporation time profile for each peptide. Standard deviation is computed from the three replicates for each H/D exchange period.
Results and Discussion
Peptide Identification
The present data reduction scheme relies on two assumptions: (1) monoisotopic m/z and charge state for each protein-digested peptide are available from the blank control experiment, and (2) after H/D exchange, the lowest nominal (nearest-integer) mass peak in each peptide isotopic distribution contains no 13C or 15N atoms. HDX of myoglobin was used to test the automated HDX system and data analysis. The flow charts for data analysis are shown in Supplementary Figures 1 and 2. The complete experiment consisted of three replicates each of a blank, a fully exchanged control, and samples exchanged for each of 12 HDX periods. Thirty-two peptic fragments of myoglobin (sequence coverage 99%) were identified in each of the blank samples and tracked during 12 incubation periods. The peptides from each incubation period elute in ~30 scans, resulting in 3 × 14 × 32 × 30 = 40,320 isotopic distributions to be analyzed. (Although not every isotopic distribution appears in every mass spectrum, the algorithm doesn’t know that in advance.)
ESI FT-ICR mass spectra showing five myoglobin peptide ions of 910 < m/z < 950 for two different H/D exchange periods are shown in Figure 1. As expected, each peptide isotopic distribution (but not those for impurities) broadens (with correspondingly reduced signal-to-noise ratio) and shifts to higher mass with increasing H/D exchange period. Two peptide isotopic distributions may overlap at one HPLC elution period, but not in another, due to different elution rates for different peptides; as a result, each of the five peptide distributions shown here overlaps with at least one other for at least one HPLC elution period. We next address how to deal with such overlaps.
Analysis begins by assignment of each peptide’s monoisotopic mass and charge state for the blank sample [16, 30], for a user-specified range of HPLC scans, m/z window width, abundance threshold, protein amino acid sequence, and ppm error limits for peptide mass assignment. This averagine fitting is performed by the original χ2 method [15]. Although other more sophisticated methods [30] are useful for isotopic envelopes of low S/N ratio (<2), the χ2 method is easier to implement, and we consider only peptide signals of high signal-to-noise ratio (≥10) anyway, because subsequent H/D exchange will broaden the isotopic distributions below reliable assignability. We find that a (user-specifiable) χ2 threshold of 0.1 is high enough to prevent rejection of the assigned charge state due to slight fluctuation of isotopic profile in different scans, but low enough to exclude possible incorrect charge assignments.
Figure 2, top shows two myoglobin peptic fragment isotopic distributions within 929 < m/z < 938: F138 RNDIAAKYKELGFQG153 (2+), easily distinguished by the sub-window selection from T70ALGGILKKKGHH EAELKPLAQSHTKHKIPIKY103 (4+) (without accurate mass measurement it would be difficult to automatically distinguish between multiple peptides or a single peptide with a complex (e.g., bimodal) deuterium exchange distribution). Moreover, the tight overlap between the doubly-charged peptide isotopic distribution and that from the unidentified singly-charged ion signals at m/z 929.5 and 930.5 (Figure 2, bottom) is clearly resolved (m/Δm50% ≈ 90,000 at one acquisition per second at m/z 930) for unambiguous assignment. In view of pepsin’s broad cleavage specificity, each peptide mass was compared to all possible sub-sequences of myoglobin, and assigned to the sub-sequence with closest match to the experimentally measured mass. If the experimental peptide mass matched more than one amino acid segment of myoglobin to within the same mass error, then the peptide was dropped from consideration, leaving 32 of 79 original candidate peptides. Most of the ambiguous peptides were isomers with the same amino acid composition but different amino acid sequence. In subsequent work we have implemented tandem MS/MS in the linear trap to confidently identify more peptides in the blank [31, 32].
Figure 2.
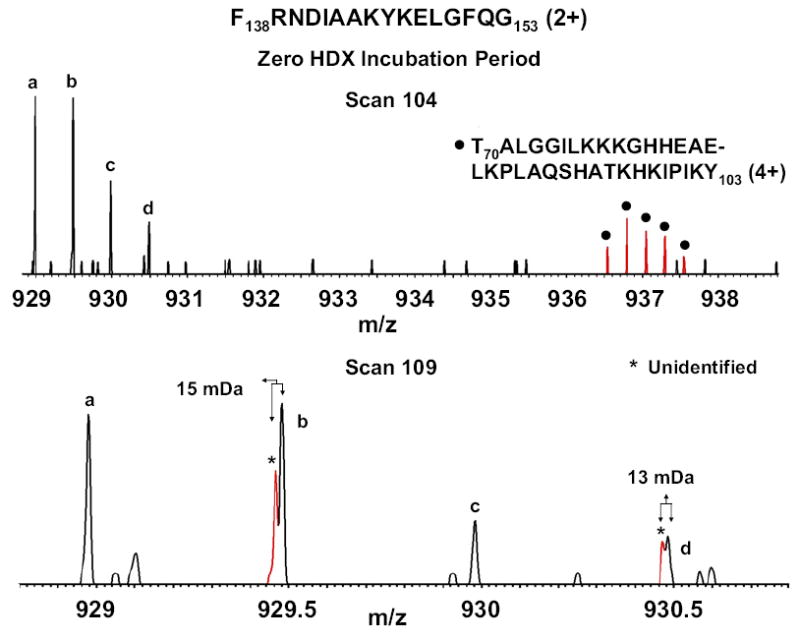
Resolution and identification of pepsin-digested myoglobin peptides in the absence of H/D exchange. Top: mass spectrum showing resolution of the isotopic distributions of a doubly charged target peptide (a, b, c, d) from another quadruply-charged peptide (filled circle). Bottom: resolution of the overlapped isotopic distributions of the same doubly charged target peptide (a, b, c, d) and an interferant singly-charged molecule (asterisk).
Counting Incorporated Deuteriums for Each Peptide
Following H/D exchange, the HPLC scans are similarly analyzed for mass and charge state, and the scan with the highest signal-to-noise ratio for each charge state of each peptide selected for further analysis. Since deuterium uptake should be the same for different charge states, data from different charge states serve as a consistency test.
Following H/D exchange, the next question is where to look for each peptide, given that the isotopic distributions typically shift to higher mass (and cross over each other). For each peptide (previously identified from the blank mass spectrum), the number of potentially exchangeable backbone amide hydrogens is one less than the number of amino acids (minus the number of prolines) in that peptide. Thus, we are certain to find the peptide isotopic distribution corresponding to somewhere between zero and the maximum number of exchangeable amide hydrogens. For the doubly-charged myoglobin segment shown in Figure 2 (top), there are 15 potentially exchangeable backbone amide hydrogens, so we need search only over that mass window (allowing for up to four 13C plus 15Natoms), or an overallmass-to-charge ratio window from 929 < m/z < 938.5 Da.
The natural-abundance isotopic distribution (in the absence of HDX) of the doubly-charged myoglobin fragment peptide, F138RNDIAAKYKELGFQG153 (2+), consists of five above-threshold nominal mass peaks, corresponding to 0-4 13C plus 15N atoms (peaks a–e in Figure 3, top). After 4 h of H/D exchange, various numbers of hydrogens have been replaced by deuteriums (Figure 3, bottom). For example, the possible isotopic variants of nominal m/z 933.5 are simulated in Figure 3, top, each with a peak width corresponding to the experimental mass resolving power of ~100,000, and with assumed equal probability of any number of exchanged hydrogens. Thus, the five original naturalabundance nominal mass species generate five peaks of the same nominal mass but with 5–9 deuteriums in place of hydrogens. The calculated (from the known peptide elemental composition) difference in mass between peaks a and e of Figure 3 (top) is 0.00565 Da, so a safe search range (taking into account the peak width) is twice that value. However, the peptide is doubly charged, so the search width becomes m/z 0.00565 (about 3-fold narrower than for Orbitrap data [14], due to higher resolving power and mass accuracy). Thus, each nominal mass peak of each peptide has a uniquely defined sub-window width and position based on the peptide elemental composition, charge state, and number of amide hydrogens. We have now established how to find the peptide masses after H/D exchange: somewhere in an overall window between zero and maximum number of exchanged amide backbone hydrogens, further narrowed to a series of sub-windows computed as in Figure 3, top.
Figure 3.
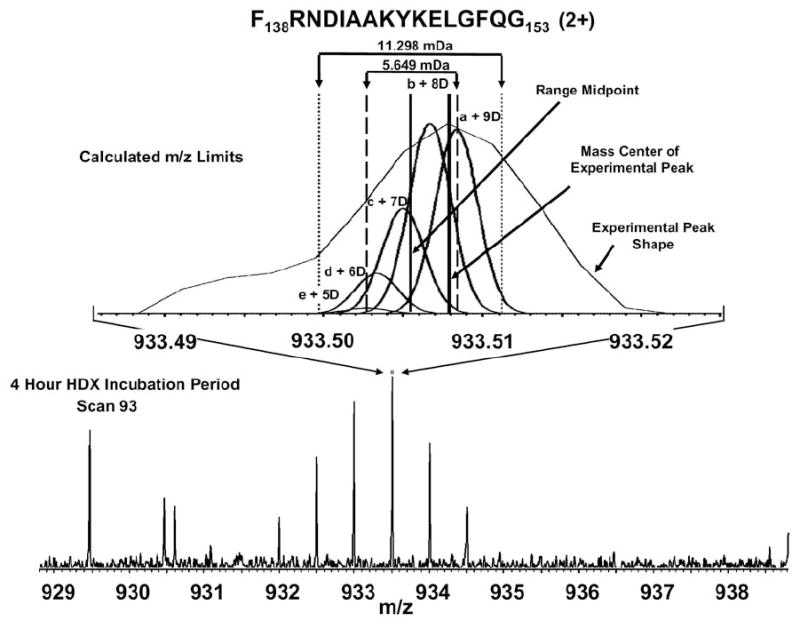
Bottom: ESI FT-ICR mass spectral segment showing the isotopic distribution for a doublycharged pepsin-digested myoglobin fragment peptide. Top: simulated (heavy lines) and experimental (thin line) spectra for the mass sub-window spanning unit m/z range. The outer pair of dotted vertical lines in the top diagram define the width of the m/z “sub-window” for peak searching (see text).
The next step is to determine the most probable number of exchanged hydrogens within each of the “sub-windows” just defined. Even at high mass resolving power, the individual peaks in a given “subwindow” (see Figure 3, top) are not resolved. Furthermore, the deuterium incorporation distribution is not known in advance. Therefore, the simplest approximation is to compute the midpoint between minimum and maximum number of exchanged hydrogens for each sub-window, and assign the correct peptide as the one whose (unresolved) experimental mass most closely matches the sub-window midpoint for that peptide. Mass measurement accuracy is essential. Achieving high measurement accuracy (to within <500 ppb rms) depends on controlling the ion number delivered to the ICR cell. By delivering ~1 million ions from the external ion accumulator for each scan, we are able to maximize mass measurement accuracy by optimization of signal-to-noise ratio and minimization of Coulomb-induced ion cyclotron frequency shift variation.
For example, Figure 4 shows isotopic distributions for 5+ (top) and 6+ (bottom) fragment peptides following 30 min of H/D exchange. In each case, the isotopic distribution of the stated peptide (blue in the top spectrum and red in the bottom spectrum) overlaps that of another peptide (black in both cases). However, the correct 5+ peptide (blue in Figure 4, top) matches its corresponding sub-window midpoint mass to within 2.0 mDa, and thus may be distinguished from the other peptide (3.7 mDa away from the sub-window midpoint). Similarly, the correct 6+ peptide (red in Figure 4, bottom) matches its sub-window midpoint mass more closely (1.3 mDa) than the other (black) peptide (4.4 mDa). Because all of the above comparisons involve peaks that are at least partially resolved, the process can be programmed and thus automated.
Figure 4.
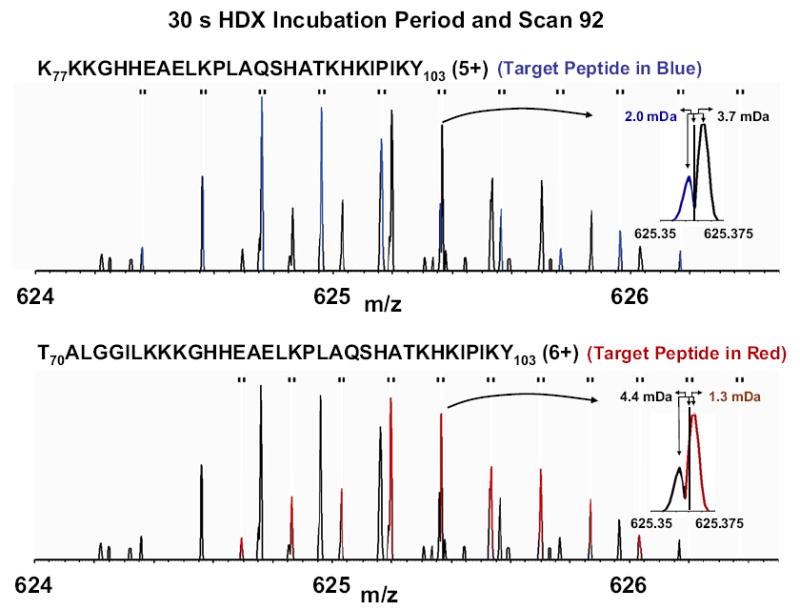
ESI FT-ICR mass spectra of a 5+ (top) and 6+ (bottom) pepsin-digested myoglobin peptide fragments. In each case, the target peptide (top inset, blue; bottom inset, red) is selected over an interferant peptide (black in each inset) based on closer match to the sub-window midpoint for that nominal mass (see text).
As noted above, the number of incorporated deuteriums is calculated separately for each charge state of each peptide. For a given HDX incubation period, the algorithm normally chooses the scan with the highest magnitude signal for a given charge state of a given peptide. However, if a particular mass spectrum fails to yield a good result (i.e., mass measurement error for the monoisotopic peak exceeds a specified threshold) for the most abundant charge state, that data can be replaced by that for another charge state and/or from a different scan, if necessary.
Validation
If the automated assignments of peptide identity are correct, the mass measurement error should be limited only by the mass resolution, the signal-to-noise ratio, and the number of data points per peak width [33, 34]. For example, 337 monoisotopic (no 13C or 15N) ion signals were detected throughout the complete HDX experiment (i.e., all HDX incubation periods and all HPLC scans) for the myoglobin fragment peptide, F138RNDIAAKYKELGFQG153 (2+), and the assignment errors were less than 0.5 mDa for 110 of the 337 peaks. Larger differences correspond to scans with low signal-to-noise ratio sampled near the beginning and end of the elution profile for that peptide. However, because the reported values for deuterium incorporation are based only on the highest signal-to-noise scans, the assignments all gave <0.5 mDa error and are thus highly reliable, even when interferant peaks were present.
Because of the wide range in HDX exchange rate constants for a given peptide, the deuterium uptake curve is visualized by plotting deuterium uptake versus log(HDX incubation period) (Figure 5) for two myoglobin peptides with the same charge state and similar length and number of exchangeable hydrogens. The data are corrected for back-exchange [35], and mapped (separately from the automated analysis) onto the threedimensional structure of myoglobin as by Lanman et al. [7] for HIV-1 capsid protein. The average peptide fractional back exchange was 0.422 (42.2%), and the average peptide fractional forward exchange was 0.134 (13.4%). Nevertheless, we were still able to make good correspondence between HDX data and myoglobin conformation. (Since the original submission of this paper, we have been able to reduce back-exchange by ~25%, by use of a ProZap C18 column (Grace Davidson, Deerfield, IL, USA), 2.1 mm × 10 mm, 1.5 μm particle size, 500 Å pore size), with wide inside diameter, short length, small particle size, and big pore size [36].)
Figure 5.
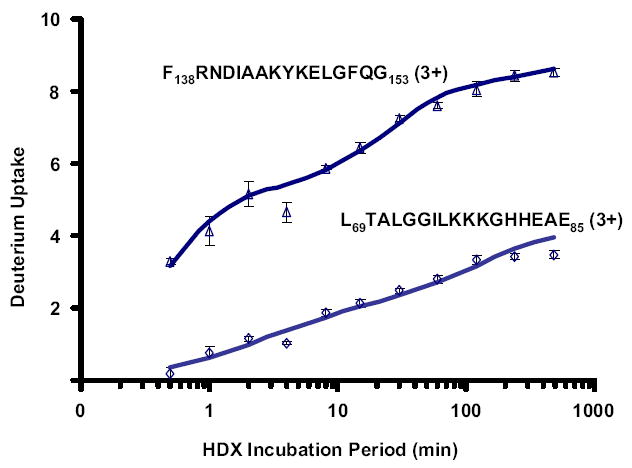
Deuterium uptake profiles for each of two triplycharged similar-length peptides produced by pepsin digestion of myoglobin. The HDX analysis is consistent with the surface accessibility of each peptide segment (see text).
The deuterium uptake profile for the peptide F138RNDIAAKYKELGFQG153 (3+) is similar to that for its doubly charged form. This peptide is near the C-terminus of myoglobin with its last four amide hydrogens in an unstructured region and relatively exposed to interaction with solvent. The deuterium uptake profile reveals fast exchange for five hydrogens, medium exchange rate for another four, and much slower exchange for the remaining six amide hydrogens located in a partially shielded α helix. By comparison, the peptide L69TALGGILKKKGHHEAE85 (3+) has just one short u-turn between two α helices in a more protected area of myoglobin structure, resulting in two amide hydrogens of medium exchange rate and very slow exchange for the remaining 14 protected amide hydrogens.
Conclusion
The present automated data analysis program (further described in the algorithm flow charts of Supplementary Figures 1 and 2) and interpreted the entire myoglobin HDX dataset (40,320 isotopic distributions) in ~1.5 h, a vast improvement over manual interpretation. Errors in data analysis are also reduced. Moreover, the data can be quickly re-analyzed with different input parameters (e.g., different S/N threshold). The algorithm takes full advantage of high mass resolution in analyzing H/D exchange experiments (Figure 3, top), and uses a novel method to calculate a sub-window with unique position and width for each nominal m/z of each peptide. In summary, the analysis program permits much greater speed, reliability, and flexibility for analysis of HDX mass spectral data and, thus, promises to extend significantly the range of applications of the HDX method. Since the original submission of this manuscript, the present automated HDX data reduction has been applied successfully to the analysis of the basis for inhibition of KIT kinase and its mutants by imatinib and sunitinib, agents for treatment of gastrointestinal stromal tumors [31], and to the elucidation of an allosteric signal transduction pathway for α-isopropylmalate synthase, target for anti-tuberculosis drugs, triggered by its feedback inhibitor L-leucine [37].
Supplementary Material
Acknowledgments
The authors acknowledge support for this work from NIH (R01 GM78359), NSF Division of Materials Research through DMR- 0654118 and the State of Florida.
Appendix A
Supplementary Material
Supplementary material associated with this article may be found in the online version at doi:10.1016/j.jasms.2009.12.016.
References
- 1.Englander JJ, Del Mar C, Li W, Englander SW, K JS, Stranz DD, Hamuro Y, Woods VLJ. Protein Structure Change Studied by Hydrogen-Deuterium Exchange, Functional Labeling, and Mass Spectrometry. Proc Natl Acad Sci U S A. 2003;100:7057–7062. doi: 10.1073/pnas.1232301100. [DOI] [PMC free article] [PubMed] [Google Scholar]
- 2.Englander SW. Hydrogen Exchange and Mass Spectrometry: A Historical Perspective. J Am Soc Mass Spectrom. 2006;17:1481–1489. doi: 10.1016/j.jasms.2006.06.006. [DOI] [PMC free article] [PubMed] [Google Scholar]
- 3.Truhlar SME, Droy CH, Torpey JW, Koeppe JR, Komives EA. Solvent Accessibility of Protein Surfaces by Amide H/2H Exchange MALDI-TOF Mass Spectrometry. J Am Soc Mass Spectrom. 2006;17:1490–1497. doi: 10.1016/j.jasms.2006.07.023. [DOI] [PubMed] [Google Scholar]
- 4.Weis DD, Wales TE, Engen JR, Hotchko M, Eyck LFT. Identification and Characterization of EX1 Kinetics in H/D Exchange Mass Spectrometry by Peak Width Analysis. J Am Soc Mass Spectrom. 2006;17:1498–1509. doi: 10.1016/j.jasms.2006.05.014. [DOI] [PubMed] [Google Scholar]
- 5.Wang F, Li W, Emmett MR, Hendrickson CL, Marshall AG, Zhang YL, Wu L, Zhang ZY. Conformational and Dynamic Changes of Yersinia Protein Tyrosine Phosphatase Induced by Ligand Binding and Active Site Mutation and Revealed by H/D Exchange and Electrospray Ionization Fourier Transform Ion Cyclotron Resonance Mass Spectrometry. Biochemistry. 1998;37:15289–15299. doi: 10.1021/bi981481q. [DOI] [PubMed] [Google Scholar]
- 6.Lam TT, Lanman JK, Emmett MR, Hendrickson CL, Marshall AG, Prevelige PE. Mapping of Protein:Protein Contact Surfaces by Hydrogen/Deuterium Exchange, Followed by On-Line High-Performance Liquid Chromatography-Electrospray Ionization Fourier-Transform Ion- Cyclotron-Resonance Mass Analysis. J Chromatogr A. 2002;982:85–95. doi: 10.1016/s0021-9673(02)01357-2. [DOI] [PubMed] [Google Scholar]
- 7.Lanman J, Lam TKT, Barnes S, Sakalian M, Emmett MR, Marshall AG, Prevelige PEJ. Identification of Novel Interactions in HIV-1 Capsid Protein Assembly by High-Resolution Mass Spectrometry. J Mol Biol. 2003;325:759–772. doi: 10.1016/s0022-2836(02)01245-7. [DOI] [PubMed] [Google Scholar]
- 8.Emmett MR, Caprioli RM. Microelectrospray Mass Spectrometry: Ultra-High-Sensitivity Analysis of Peptides and Proteins. J Am Soc Mass Spectrom. 1994;5:605–613. doi: 10.1016/1044-0305(94)85001-1. [DOI] [PubMed] [Google Scholar]
- 9.Kazazic S, Emmett MR, Blakney GT, Marshall AG. Automated Hydrogen Deuterium Exchange with High Resolution FT-ICR MS Analysis and Enhanced Automated Data Reduction. Proceedings of the 54th ASMS Annual Conference on Mass Spectrometry and Allied Topics; Seattle, WA. 27 May–2 June, 2006; p. TP394. [Google Scholar]
- 10.Chalmers MJ, Busby SA, Pascal BD, He Y, Hendrickson CL, Marshall AG, Griffin PR. Probing Protein Ligand Interactions by Automated Hydrogen/Deuterium Exchange Mass Spectrometry. Anal Chem. 2006;78:1005–1014. doi: 10.1021/ac051294f. [DOI] [PubMed] [Google Scholar]
- 11.Hotchko M, Anand GS, Komives EA, Eyck LFT. Automated Extraction of Backbone Deuteration Levels from Amide H/2H Mass Spectrometry Experiments. Protein Sci. 2006;15:583–601. doi: 10.1110/ps.051774906. [DOI] [PMC free article] [PubMed] [Google Scholar]
- 12.Weis DD, Engen JR, Kass IJ. Semi-Automated Data Processing of Hydrogen Exchange Mass Spectra Using HX-Express. J Am Soc Mass Spectrom. 2006;17:1700–1703. doi: 10.1016/j.jasms.2006.07.025. [DOI] [PubMed] [Google Scholar]
- 13.Buijs J, Hakansson K, Hagman C, Hakansson P, Oscarsson S. A New Method for the Accurate Determination of the Isotopic State of Single Amide Hydrogens within Peptides using Fourier Transform Ion Cyclotron Resonance Mass Spectrometry. Rapid Commun Mass Spectrom. 2000;14:1751–1756. doi: 10.1002/1097-0231(20001015)14:19<1751::AID-RCM89>3.0.CO;2-T. [DOI] [PubMed] [Google Scholar]
- 14.Pascal BD, Chalmers MJ, Busby SA, Mader CC, Southern MR, Tsinoremas NF, Griffin PR. The Deuterator: Software for the Determination of Backbone Amide Deuterium Levels from H/D Exchange MS Data. BMC Bioinformatics. 2007;8:156–168. doi: 10.1186/1471-2105-8-156. [DOI] [PMC free article] [PubMed] [Google Scholar]
- 15.Senko MW, B SC, McLafferty FW. Determination of Monoisotopic Masses and Ion Populations for Large Biomolecules from Resolved Isotopic Distributions. J Am Soc Mass Spectrom. 1995;6:229–233. doi: 10.1016/1044-0305(95)00017-8. [DOI] [PubMed] [Google Scholar]
- 16.Horn DM, Z RA, McLafferty FW. Automated Reduction and Interpretation of High Resolution Electrospray Mass Spectra of Large Molecules. J Am Soc Mass Spectrom. 2000;11:320–332. doi: 10.1016/s1044-0305(99)00157-9. [DOI] [PubMed] [Google Scholar]
- 17.Zhang Z, Guan S, Marshall AG. Enhancement of the Effective Resolution of Mass Spectra of High-Mass Biomolecules by Maximum- Entropy Based Deconvolution to Eliminate the Isotopic Natural Abundance Distribution. J Am Soc Mass Spectrom. 1997;8:659–670. [Google Scholar]
- 18.Abzalimov RR, Kaltashov IA. Extraction of Local Hydrogen Exchange Data from HDX CAD MS Measurements by Deconvolution of Isotopic Distributions of Fragment Ions. J Am Soc Mass Spectrom. 2006;17:1543–1551. doi: 10.1016/j.jasms.2006.07.017. [DOI] [PubMed] [Google Scholar]
- 19.Marshall AG, Hendrickson CL, Jackson GS. Fourier Transform Ion Cyclotron Resonance Mass Spectrometry: A Primer. Mass Spectrom Rev. 1998;17:1–35. doi: 10.1002/(SICI)1098-2787(1998)17:1<1::AID-MAS1>3.0.CO;2-K. [DOI] [PubMed] [Google Scholar]
- 20.Lanman J, Lam TKT, Emmett MR, Marshall AG, Sakalian M, Prevelige PE., Jr Key Interactions in HIV-1 Maturation Identified by Mass Spectrometry Based H/D Exchange. Nat Struct Mol Biol. 2004;11:676–677. doi: 10.1038/nsmb790. [DOI] [PubMed] [Google Scholar]
- 21.Lisal J, Lam TKT, Kainov DE, Emmett MR, Marshall AG, Tuma R. Functional Visualization of a Viral Molecular Motor by Hydrogen-Deuterium Exchange Reveals Transient States During RNA Packaging. Nat Struct Mol Biol. 2005;2:460–466. doi: 10.1038/nsmb927. [DOI] [PubMed] [Google Scholar]
- 22.Lisal J, Kainov DE, Lam TKT, Emmett MR, Wei H, Gottlieb P, Marshall AG, Tuma R. Interaction of Packaging Motor with the Polymerase Complex of dsRNA Bacteriophage. Virology. 2006;351:73–79. doi: 10.1016/j.virol.2006.03.025. [DOI] [PubMed] [Google Scholar]
- 23.Seyfried NT, Atwood JAI, Yongye A, Almond A, Day AJ, Orlando R, Woods RJ. Fourier Transform Mass Spectrometry to Monitor Hyaluronan-Protein Interactions: Use of Hydrogen/Deuterium Amide Exchange. Rapid Commun Mass Spectrom. 2007;21:121–131. doi: 10.1002/rcm.2817. [DOI] [PMC free article] [PubMed] [Google Scholar]
- 24.Woods VLJ, Hamuro Y. High Resolution, High-Throughput Amide Deuterium Exchange-Mass Spectrometry (DXMS) Determination of Protein Binding Site Structure and Dynamics: Utility in Pharmaceutical Design. J Cellular Biochem. 2001;37(Suppl):89–98. doi: 10.1002/jcb.10069. [DOI] [PubMed] [Google Scholar]
- 25.Hamuro Y, Coales SJ, Southern MR, Nemeth-Cawley JJ, Stranz DD, Griffin PR. Rapid Analysis of Protein Structure and Dynamics by Hydrogen/Deuterium Exchange Mass Spectrometry. J Biomol Techniques. 2003;14:171–182. [PMC free article] [PubMed] [Google Scholar]
- 26.Schaub TM, Hendrickson CL, Horning S, Quinn JP, Senko MW, Marshall AG. High-Performance Mass Spectrometry: Fourier Transform Ion Cyclotron Resonance at 14.5 Tesla. Anal Chem. 2008;80:3985–3990. doi: 10.1021/ac800386h. [DOI] [PubMed] [Google Scholar]
- 27.Schwartz JC, Senko MW, Syka JEP. A Two-Dimensional Quadrupole Ion Trap Mass Spectrometer. J Am Soc Mass Spectrom. 2002;13:659–669. doi: 10.1016/S1044-0305(02)00384-7. [DOI] [PubMed] [Google Scholar]
- 28.Syka JEP, Marto JA, Bai DL, H S, Senko MW, Schwartz JC, Ueberheide B, Garcia B, Busby SA, Muratore T, Shabanowitz J, Hunt DF. Novel Linear Quadrupole Ion Trap/FT Mass Spectrometer: Performance Characterization and Use in the Comparative Analysis of Histone H3 Post-Translational Modifications. J Proteome Res. 2004;3:621–626. doi: 10.1021/pr0499794. [DOI] [PubMed] [Google Scholar]
- 29.Beu SC, Laude DA., r Elimination of Axial Ejection during Excitation with a Capacitively Coupled Open Trapped-Ion Cell for FTICRMS. Anal Chem. 1992;64:177–180. [Google Scholar]
- 30.Chen L, Sze SK, Yang H. Automated Intensity Descent Algorithm for Interpretation of Complex High-Resolution Mass Spectra. Anal Chem. 2006;78:5006–5018. doi: 10.1021/ac060099d. [DOI] [PubMed] [Google Scholar]
- 31.Gajiwala KS, Wu JC, Christensen J, Deshmukh GD, Diehl W, DiNitto JP, English JM, Greig MJ, He YA, Jacques SL, Lunney EA, McTigue M, Molina D, Quenzer T, Wells PA, Yu X, Zhang Y, Zou A, Emmett MR, Marshall AG, Zhang HM, Demetri GD. KIT Kinase Mutants Show Unique Mechanisms of Drug Resistance to Imatinib and Sunitinib in Gastrointestinal Stromal Tumor Patients. Proc Nat Acad Sci U S A. 2009;106:1542–1547. doi: 10.1073/pnas.0812413106. [DOI] [PMC free article] [PubMed] [Google Scholar]
- 32.Zhang HM, Mcloughlin SM, He H, Nilsson CL, Emmett MR, Marshall AG. Conformational and Functional Effect of Posttranslational Modifications on sRAGE Protein by Solution-Phase H/D Exchange FT-ICR Mass Spectrometry. Proceedings of the 57th ASMS Annual Conference on Mass Spectrometry and Allied Topics; Philadelphia, PA. 31 May–5 June, 2007. [Google Scholar]
- 33.Chen L, Cottrell CE, Marshall AG. Effect of Signal-to-Noise Ratio and Number of Data Points upon Precision in Measurement of Peak Amplitude, Position, and Width in Fourier Transform Spectrometry. Chemom Intell Lab Syst. 1986;1:51–58. [Google Scholar]
- 34.Yanofsky CM, Bell AW, Lesimple S, Morales F, Lam TKT, Blakney GT, Marshall AG, Carrillo B, Lekpor K, Boismenu D, Kearney RE. Multicomponent Internal Recalibration of an LC-FTICR-MS Analysis of a Partially Characterized Complex Peptide Mixture: Systematic and Random Errors. Anal Chem. 2005;77:7246–7254. doi: 10.1021/ac050640q. [DOI] [PubMed] [Google Scholar]
- 35.Zhang Z, Smith DL. Determination of Amide Hydrogen Exchange by Mass Spectrometry: A New Tool for Protein Structure Elucidation. Protein Sci. 1993;2:522–531. doi: 10.1002/pro.5560020404. [DOI] [PMC free article] [PubMed] [Google Scholar]
- 36.Zhang HM, Bou-Assaf GM, Emmett MR, Marshall AG. Fast Reversed-Phase Liquid Chromatography to Reduce Back Exchange and Increase Throughput in H/D Exchange Monitored by FT-ICR Mass Spectrometry. J Am Soc Mass Spectrom. 2009;20:520–524. doi: 10.1016/j.jasms.2008.11.010. [DOI] [PMC free article] [PubMed] [Google Scholar]
- 37.Frantom PA, Zhang HM, Emmett MR, Marshall AG, Blanchard JS. Mapping of the Allosteric Network in the Regulation of A-Isopropylmalate Synthase from Mycobacterium tuberculosis by the Feedback Inhibitor L-Leucine: Solution-Phase H/D Exchange Monitored by FT-ICR Mass Spectrometry. Biochemistry. 2009;48:7457–7464. doi: 10.1021/bi900851q. [DOI] [PubMed] [Google Scholar]
Associated Data
This section collects any data citations, data availability statements, or supplementary materials included in this article.