Abstract
We present a direct method for producing images of kinetic parameters from list mode PET data. The time-activity curve for each voxel is described by a one-tissue compartment, 2-parameter model. Extending previous EM algorithms, a new spatiotemporal complete data space was introduced to optimize the maximum likelihood function. This leads to a straightforward parametric image update equation with moderate additional computation requirements compared to the conventional algorithm. Qualitative and quantitative evaluations were performed using 2D (x,t) and 4D (x,y,z,t) simulated list mode data for a brain receptor study. Comparisons with the two-step approach (frame-based reconstruction followed by voxel-by-voxel parameter estimation) show that the proposed method can lead to accurate estimation of the parametric image values with reduced variance, especially for the volume of distribution (VT).
I. Introduction
Dynamic positron emission tomography (PET) permits quantification of tracer dynamics. The current data processing path for parametric imaging is to reconstruct a time series of images from measured projection data independently and then estimates each voxel’s kinetic parameters from the time-activity curve (TAC), typically with a compartmental model. This frame-based approach requires selection of the duration of each frame, involving a choice between collecting longer scans with good counting statistics but poor temporal resolution, or shorter scans that are noisy but preserve temporal resolution. Optimal use of the dynamic data requires accurate noise estimates for data weighting; this estimation is challenging for nonlinear iterative reconstruction methods because its noise is spatially variant and object dependent.
Direct approaches for creation of parametric images have been in the literature for over 20 years. In 1983, Snyder [1] developed a list mode expectation-maximization (EM) maximum likelihood (ML) algorithm for estimation of parametric images using inhomogeneous spatial-temporal Poisson processes and a kinetic compartmental model. Carson and Lange [2] also proposed an EM framework for direct parametric image reconstruction algorithm with a one tissue model. Subsequently, many direct kinetic estimation methods [3-8] for sinogram data have been produced. However, for a high-resolution scanner such as the HRRT with 4.5×10⁹ potential lines of response, list mode data is preferred; this can reduce the data storage requirements while maintaining highest resolution by storing the measured attributes of each event in the list. Other direct methods [9-14] were developed from linear basis functions, whose the temporal model is linear with respect to the parameters. Although such basis functions can represent the TACs, they have no direct physiological meaning and kinetic parameters must still be calculated from the dynamic images, leading again to a two-step process. The application of kinetic compartment models is more biologically based, becoming the primary goal of dynamic PET. Tsoumpas et al [5] and Wang et al [6] proposed direct parametric image reconstruction methods, whose compartment model is linear (Patlak plot) model, and is thus limited to irreversible tracers such as FDG. Here, we present a new EM-based direct parametric image reconstruction algorithm for list mode data by combining nonlinear one tissue compartment model (1T) into the physical model.
II. Theory
We extend the notation of Lange and Carson [15] from static to 4D. The physical model for the projection measurement Yit on line of response (LOR) i at time t is:
| (1) |
where cij is the probability of an emission from voxel j (activity λjt at time t) detected on LOR i, and Δt is the duration of time bin t (equal to the time resolution of the list mode data). For simplicity, attenuation, normalization, randoms and scatter are not included here, although this is a straightforward addition to the algorithm. The 1T model is:
| (2) |
where Pτ is the input function and the parameters are K1 and k2. The log likelihood function is:
| (3) |
The complete data space recognizes that the activity at any time is the sum of activities delivered to the system at earlier times, each with a different residence time. Thus, define the spatiotemporal complete data space Xijtτ to be the counts collected along LOR i in time bin t emitted from voxel j and where the input was delivered at time τ
| (4) |
From the complete data, the EM algorithm for the estimation of the parameters can be derived.
E-step, at iteration n:
| (5) |
M-step: maximization of conditional data likelihood,
| (6) |
Define the sensitivity image,
| (7) |
Taking partial derivatives with respect to K1j and k2j, and setting to zero, for K1j yields:
| (8) |
which leads to the K1j update equation
| (9) |
For k2j,
| (10) |
The K1j update (Eq. 9) is inserted into Eq.10, which leads to
| (11) |
The left hand side is a function of k2 and the input function (assumed known) and the right hand side is a function of the data. Define the left hand side expression as a function of k2:
| (12) |
and obtain the k2j update equation
| (13) |
where H(k2) can be pre-computed when the input function is known. To assess the proposed algorithm, 2D tests and 4D tests were performed.
III. Methods
To update k2, the inverse of H(k2) is required. H(k2) is independent of measured data, so it can be computed when a plasma input is given, as is shown in Fig.1A. H(k2) was computed for a 30-min simulation (Fig. 1B). A fifth order polynomial log function can fit H(k2)’s inverse very well (Fig.1 C). The fitting error is shown in Fig.1D; errors of less then 1×10⁻⁴ in k2 were found. This is determined by precomputing H(k2) and then fitting the inverse functions with a polynomial log function.
Fig. 1.
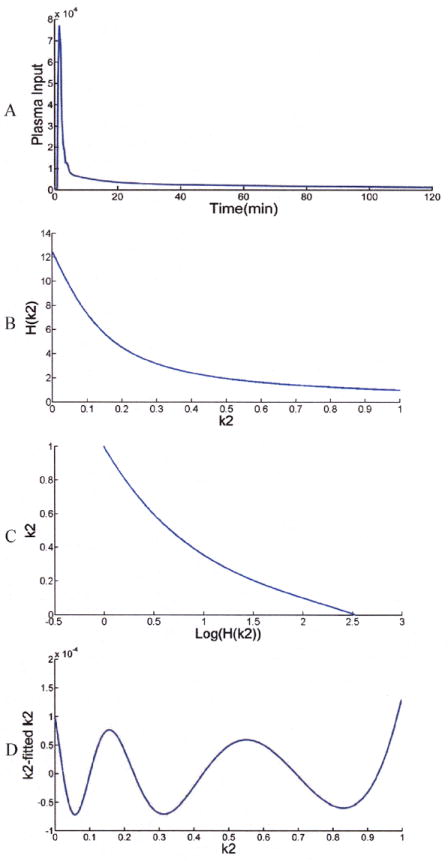
A: Measured plasma input, B: H(k2), C: Inverse log function: k2~Log(H(k2)), D: k2 fitting error with polynomial (note change of scale)
A. 2D tests
Tests were performed for the case of 100 voxels, where gray matter (GM), white matter (WM) and basal ganglia (BG) were simulated. Fig.2 and Table I show the K1 and k2 values of the 1D phantom, which are typical of receptor kinetics. Fifty 30-min list mode data replicates were created by forward projection of Eq. 2 with a measured input function and with sampling, resolution and sensitivity (Q) comparable to that of the HRRT. Poisson noise was added to each replicate, corresponding to 6.3×10⁵ events. Random and scatter events were not included. Values were reconstructed with the new algorithm and with the 2-step method (30×1 min frames). To fairly compare the two methods, for the 2-step method, nonlinear weighted least square method was utilized to estimate parametric values after the first step reconstruction, with weights are based on Noise Equivalent Counts (NEC).
Fig. 2.
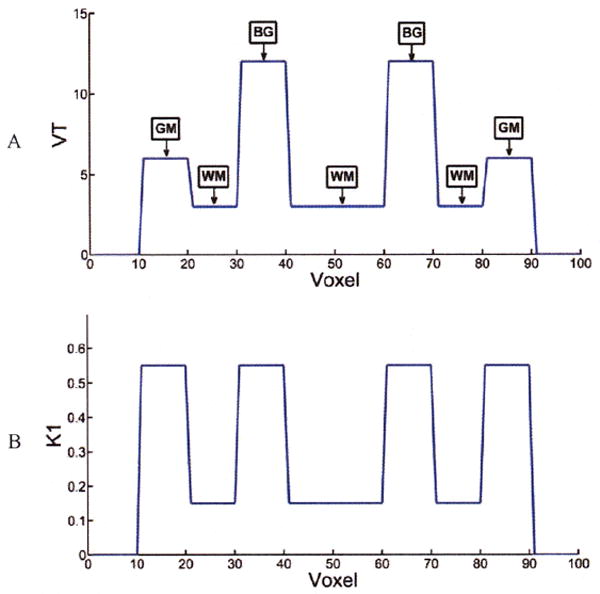
1D phantom: A: VT, B: K1
Table I.
2D test results
| Frame | 4D | ||||
|---|---|---|---|---|---|
| Bias(%) | COV(%) | Bias(%) | COV(%) | ||
| K1 | GM(true=0.55) | 1.1 | 6 | 1.1 | 4 |
| WM(true=0.15) | -1.6 | 9 | -1.6 | 7 | |
| BG(true=0.55) | 1.2 | 5 | 1.2 | 3 | |
| k2 | GM(true=0.092) | 0.0 | 8 | 0.2 | 5 |
| WM(true=0.05) | 0.1 | 19 | 0.2 | 14 | |
| BG(true=0.046) | 0.1 | 11 | 0.4 | 8 | |
| VT | GM(true=6) | 1.3 | 4 | 0.9 | 3 |
| WM(true=3) | 0.6 | 13 | -0.4 | 10 | |
| BG(true=12) | 1.8 | 7 | 1.2 | 5 | |
B. 4D tests
A 10-cm diameter spherical 3D phantom (Fig.3) was created with 3 embedded regions, corresponding to GM (K1=0.55, VT=6), WM(K1=0.15, VT=3) and BG(K1=0.55, VT=12), with the same kinetics as the 2D test. One list mode file was simulated based on the HRRT and the new 4D method was integrated into the MOLAR software [16]. Results were compared to the frame-based 2-step method (6×30 sec, 3×60 sec, 2×120 sec, 4×300 sec) using 30 subsets for both methods. Images were saved after each subset reconstruction update (sub-iteration).
Fig. 3.
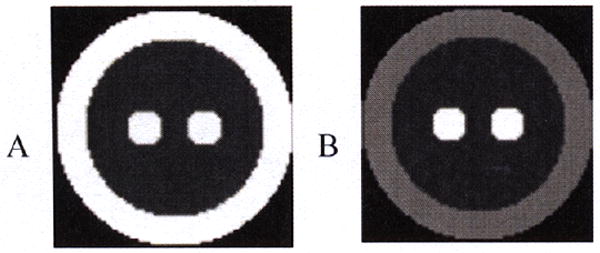
3D phantom: A: K1 (0~0.55 mL/min/mL) B: VT (0-12 mL/mL)
IV. Results and Discussion
A. 2D tests
Table I shows the mean percent bias and coefficients of variation (COV) for GM, WM and BG across the 50 realizations for frame based method and the proposed method after 60 iterations. 4D percent bias was comparable to frame-based values, and slightly smaller for VT, which is more the important parameter for brain receptor studies. 4D’s advantage was clearly demonstrated by COV reduction of ~ 30%.
B. 4D tests
Fig.4 shows 4D and frame-based results after 30 and 60 sub-iterations. Visually, for the K1 30 sub-iterations image, there is little difference between the two methods. But for VT, 4D is clearly better than frame-based method, especially for the high VT value region BG and low VT value region WM. However, for the K1 60 sub-iterations image, frame-based method is less noisy, but for the VT, 4D is still better. After 1 iteration (30 sub-iterations), the 4D method produced parametric images close to true images, which indicates that it may have faster convergence than frame-based method. Mean bias and COV across each region of interest (ROI’s) voxels were calculated from the one realization. Fig.5 shows the plots of bias vs. variability for the three ROIs, plotted at intervals of 10 sub-iterations (30~90). As sub-iteration number increases, the curves (and the noise) go up.
Fig. 4.
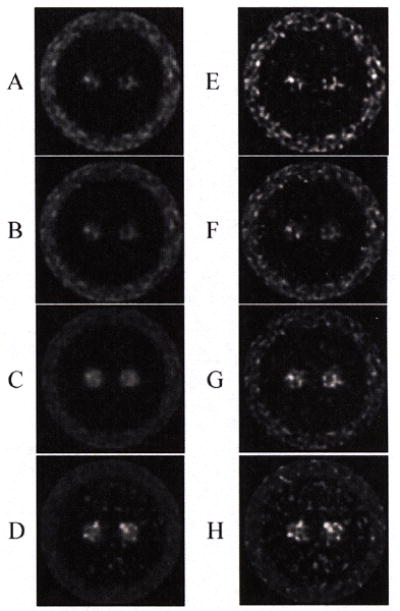
The results of two methods after 30 (left side: A, B, C and D) and 60 sub-iterations (left side: E, F, G and H). A. K1 image (0~2) for 4D B. K1 image (0~2) for frame-based method, C. VT mean image (0~30) for 4D, D. VT mean image (0~30) for frame-based method, E. K1 image (0~2) for 4D F. K1 image (0~2) for frame-based method, G. VT mean image (0~30) for 4D, H. VT mean image (0~30) for frame-based method.
Fig. 5.
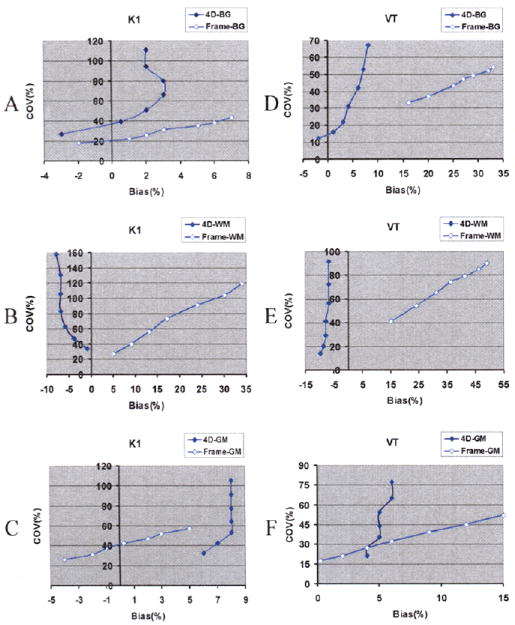
COV versus Bias curves for 4D (solid line) and frame-based method (circled line). As sub-iterations goes up (30~90), the curves go up
For K1, 4D has higher noise than frame-based method at the same iteration for all the three regions, and 4D is more biased for the GM region, although these biases were small. K1 bias was larger for the frame method in BG and WM. Like the 2D tests, 4D produce more accurate VT images than frame-based. In addition, unlike the frame-based method, 4D’s bias doesn’t change much with the increasing sub-iterations, which further suggests that it may converge faster.
In terms of computational complexity, the 4D method is somewhat more intensive than the frame method, because the computations in forward- and backprojection steps are more intensive. H(k2) and its inverse add an insignificant amount of computation. In the 4D method, handling of the whole list mode file (usually several billion events) is required, which requires more memory or more disk swapping.
V. Conclusions
In this paper, we introduced a method for the direct reconstruction of kinetic parameters from PET list mode data, which integrated the one tissue compartment model and the PET physical model and facilitated kinetic parameters estimation with the help of new spatiotemporal complete data space. Substantial more evaluation is required including simulations with motion correction, random correction and scatter correction and human data evaluations. Careful comparison of convergence between 4D and frame-based methods will be essential for fair comparisons of resolution and noise. In addition, it is necessary to optimize the software to decrease the computation time. We believe that this 4D EM method is a promising approach for kinetic parameter estimation directly from measured data.
Acknowledgments
We acknowledge the support of R01NS058360 (NINDS) and Siemens Medical Systems, Zhongdong Sun for programming and the staffs of Yale PET Center for the studies which formed the basis of this work.
Contributor Information
Jianhua Yan, Email: jianhua yan@yale.edu.
Beata Planeta-Wilson, Email: beata.planeta-wilson@yale.edu.
Richard E. Carson, Email: richard.e.carson@yale.edu.
References
- 1.Snyder DL. Parameter estimation for dynamic studies in emission-tomography systems having list-mode data. IEEE Trans Nucl Sci. 1984;31:925–31. [Google Scholar]
- 2.Carson RE, Lange K. The EM parametric image reconstruction algorithm. J Am Statist Assoc. 1985;80:20–22. [Google Scholar]
- 3.Kamasak ME, Bouman CA, Morris ED, Sauer K. Direct reconstruction of kinetic parameter images from dynamic PET data. IEEE Trans Med Imaging. 2005;24:636–650. doi: 10.1109/TMI.2005.845317. [DOI] [PubMed] [Google Scholar]
- 4.Yetik S, Qi J. Direct estimation of kinetic parameters from the sinogram with an unknown blood function. IEEE Biomed Img Symp Macro to Nano. 2006;1:295–298. [Google Scholar]
- 5.Tsoumpas C, Turkheimer FE, Thielemans K. Study of direct and indirect parametric estimation methods of linear models in dynamic positron emission tomography. Med Phys. 2008;35:1299–309. doi: 10.1118/1.2885369. [DOI] [PubMed] [Google Scholar]
- 6.Wang G, Fu L, Qi J. Maximum a posteriori reconstruction of the Patlak parametric image from sinograms in dynamic PET. Phys Med Biol. 2008;53:593–604. doi: 10.1088/0031-9155/53/3/006. [DOI] [PubMed] [Google Scholar]
- 7.Matthews J, Bailey DL, Price P, Cunningham VJ. The direct calculation of parametric images from dynamic PET data using maximum-likelihood iterative reconstruction. Phys Med Biol. 1997;42:1155–73. doi: 10.1088/0031-9155/42/6/012. [DOI] [PubMed] [Google Scholar]
- 8.Meikle SR, Matthews JC, Cunningham VJ, Bailey DL, Livieratos L, Jones T, Price P. Parametric image reconstruction using spectral analysis of PET projection data. Phys Med Biol. 1998;43:651–66. doi: 10.1088/0031-9155/43/3/016. [DOI] [PubMed] [Google Scholar]
- 9.Nichols TE, Qi J, Asma E, Leahy RM. Spatiotemporal reconstruction of list-mode PET data. IEEE Trans Med Imaging. 2002;21:396–404. doi: 10.1109/TMI.2002.1000263. [DOI] [PubMed] [Google Scholar]
- 10.Reader AJ, Sureau FC, Comtat C, Trebossen R, Buvat I. Joint estimation of dynamic PET images and temporal basis functions using fully 4D ML-EM. Phys Med Biol. 2006;51:5455–74. doi: 10.1088/0031-9155/51/21/005. [DOI] [PubMed] [Google Scholar]
- 11.Li Q, Asma E, Ahn S, Leahy RM. A fast fully 4D incremental gradient reconstruction algorithm for list mode PET data. IEEE Trans Med Imaging. 2007;26:58–67. doi: 10.1109/TMI.2006.884208. [DOI] [PubMed] [Google Scholar]
- 12.Verhaeghe J, D’Asseler Y, Vandenberghe S, Staelens S, Lemahieu I. An investigation of temporal regularization techniques for dynamic PET reconstructions using temporal splines. Med Phys. 2007;34:1766–78. doi: 10.1118/1.2723879. [DOI] [PubMed] [Google Scholar]
- 13.Reader AJ, Matthews JC, Sureau FC, Comtat C, Trebossen R, Buvat I. Fully 4D image reconstruction by estimation of an input function and spectral coefficients. IEEE Nucl Sci Symp Med Im Conf. 2007;4:3260–7. [Google Scholar]
- 14.Verhaeghe J, Ville DVD, Khalidov I, D’Asseler Y, Lemahieu I, Unser M. Dynamic PET reconstruction using wavelet regularization with adapted basis functions. IEEE Trans Med Imaging. 2008;27:943–59. doi: 10.1109/TMI.2008.923698. [DOI] [PubMed] [Google Scholar]
- 15.Lange K, Carson RE. EM reconstruction algorithms for emission and transmission tomography. J Comput Assist Tomogr. 1984;8:306–316. [PubMed] [Google Scholar]
- 16.Carson RE, Barker WC, Johnson JL. Design of a motion-compensation OSEM list-mode algorithm for resolution-recovery reconstruction for the HRRT. IEEE Nucl Sci Symp Med Im Conf. 2003;5:3281–3285. [Google Scholar]


