

Abstract
Maximal exercise may be limited by central fatigue defined as an inability of the central nervous system to fully recruit the involved muscles. This study evaluated whether a reduction in the cerebral oxygen-to-carbohydrate index (OCI) and in the cerebral mitochondrial oxygen tension  relate to the ability to generate a maximal voluntary contraction and to the transcranial magnetic stimulated force generation. To determine the role of a reduced OCI and
  in central fatigue, 16 males performed low intensity, maximal intensity and hypoxic cycling exercise. Exercise fatigue was evaluated by ratings of perceived exertion (RPE), arm maximal voluntary force (MVC), and voluntary activation of elbow flexor muscles assessed with transcranial magnetic stimulation. Low intensity exercise did not produce any indication of central fatigue or marked cerebral metabolic deviations. Exercise in hypoxia (
 0.10) reduced cerebral oxygen delivery ∼25% and
  decreased 11 ± 4 mmHg (P < 0.001) together with OCI (6.2 ± 0.7 to 4.8 ± 0.5, P < 0.001). RPE increased while MVC and voluntary activation were reduced (P < 0.05). During maximal exercise
  declined 8 ± 4 mmHg (P < 0.05) and OCI to 3.8 ± 0.5 (P < 0.001). RPE was 18.5, and MVC and voluntary activation were reduced (P < 0.05). We observed no signs of muscular fatigue in the elbow flexors and all control MVCs were similar to resting values. Exhaustive exercise provoked cerebral deoxygenation, metabolic changes and indices of fatigue similar to those observed during exercise in hypoxia indicating that reduced cerebral oxygenation may play a role in the development of central fatigue and may be an exercise capacity limiting factor.
Introduction
Whole body exercise provokes central fatigue or an inability of the central nervous system (CNS) to fully recruit the muscles involved in the exercise challenge (Lepers et al. 2002; Ross et al. 2007; Amann & Dempsey, 2008), and this may result from perturbations of cerebral oxygenation and metabolism (Dalsgaard, 2006; Nybo & Rasmussen, 2007). Whether these phenomena are coupled is, however, not known, but an indication of coupling between cerebral oxygenation and central fatigue is provided by the reduced ability to generate force during a hand grip contraction (although the ability to perform fast movement (finger tapping) is not affected) by a low level of cerebral oxygenation (Rasmussen et al. 2007).
As evaluated by both near-infrared spectroscopy (Ide et al. 1999) and the BOLD signal derived during functional magnetic resonance (Kastrup et al. 2002), cerebral oxygenation increases in response to low to moderate intensity exercise, but indices of cerebral oxygenation decrease during maximal exercise (Subudhi et al. 2008, 2009). During whole body exercise it can be a problem to maintain the arterial oxygen saturation (Dempsey & Wagner, 1999), and also hyperventilation-induced lowering of the arterial carbon dioxide tension  challenges oxygenation of the brain since cerebral blood flow (CBF) decreases, as confirmed by the transcranial Doppler derived middle cerebral artery mean flow velocity (MCA Vmean) (Jørgensen et al. 1992). Accordingly, cerebral capillary oxygen saturation
  and the mitochondrial oxygen tension
  , as calculated from the arterial and internal jugular venous oxygen saturations and CBF (Gjedde et al. 2005; Rasmussen et al. 2007), decreases and also the molar ratio between cerebral uptake of oxygen to that of glucose (OGI) and, especially, the ratio taking both glucose and lactate into account (OCI) become low (Dalsgaard, 2006).
Cerebral hypoxia appears to impose a limit to maximal exercise during hypoxia, since its reversal is associated with improved performance (Nielsen et al. 1999; Subudhi et al. 2008), and we hypothesized that there exists a coupling between central fatigue and perturbations in cerebral oxygenation and metabolism. To test that hypothesis, the ability of the CNS to fully recruit the muscles involved in whole body exercise was evaluated by maximal voluntary contraction (MVC) and transcranial magnetic stimulation (TMS) (Gandevia et al. 1996) while  was calculated. To focus on the potential role of cerebral oxygenation for central fatigue, exercise was carried out during both normoxia and hypoxia.
Methods
Sixteen males at an age of 20–34 years participated in this study (75 ± 7 kg, 179 ± 6 cm, maximal oxygen uptake 4.2 ± 0.7 l min−1; means ±s.d.) after providing informed consent as approved by the Ethics Committee of Copenhagen and Frederiksberg (KF 01257177). The study conformed to the Declaration of Helsinki. Prior to the experiment, the subjects were familiarized with the experimental procedures. The pre-trial included 20 min of ergometer cycling at a reduced (0.10) oxygen fraction  and the workload for the main experiment was chosen as ∼95% of the intensity the subject could sustain (124 ± 21 W). Finally the subjects performed incremental cycling to determine maximal oxygen uptake.
Instrumentation
A catheter was under local anaesthesia (2% lidocaine), placed retrograde with the Seldinger technique in the right internal jugular vein (1.6 mm, 14 gauge; ES-04706, Arrow International, Reading, PA, USA) as guided by an ultrasound image and advanced to the bulb of the vein. Arterial blood was drawn from a catheter in the brachial artery (1.1 mm, 20 gauge) of the non-dominant arm and used to record mean arterial pressure (MAP) (Edwards Life Sciences, Irving, CA, USA). Blood pressure data were interfaced with a Dialogue-2000 monitor (IBC-Danica, Copenhagen, Denmark), sampled at 200 Hz (DI-720, Dataq, Akron, OH, USA), and stored. The MCA Vmean was evaluated by transcranial Doppler (Transcan, EME, Überlingen, Germany) in the middle cerebral artery (MCA). Depending on the position with the best signal-to-noise ratio, the proximal part of the MCA was insonated at a depth of 40–60 mm from the temporal bone and the probe was secured with a headband.
To determine isometric elbow flexion force, the right elbow was flexed 90 deg and fully supinated with the wrist secured to a strain gauge dynamometer (14 bit A/D conversion) when the subject was sitting on the cycling ergometer (Fig. 1A). Electromyographic (EMG) activity was recorded with surface electrodes (Cleartrace, 1700-030, Conmed, Utica, NY, USA) placed over the muscle belly and tendons of biceps, brachioradialis and triceps muscles. The EMG signal was amplified (×1000), filtered (25–1000 Hz), digitised, and sampled (sampling rate 5 kHz) to a computer using a CED Micro1401 and Spike2 software (Cambridge Electronic Design, Cambridge, UK). EMG activity was quantified as the root-mean-square values and was expressed relative to the activity obtained during the control MVC. For stimulation of the biceps, surface electrodes (Cleartrace, Conmed) were placed on each of the motor points (MPs). A computer triggered a double 1 ms electrical stimulus at constant current (inter-stimuli interval: 10 ms, S7A Digitimer). Stimulation intensity was set 10–20% above the level required to produce a resting twitch of maximal amplitude.
Figure 1.

Voluntary activation during cycling A, the subject was sitting on the cycling ergometer (not shown) with his right arm flexed 90 deg and fully supinated and the wrist secured in the strain gauge dynamometer. Surface EMG electrodes were placed at the belly and the tendon at the biceps brachii muscle (BB), the triceps brachii muscle (TB) and the brachioradialis muscle (BR). For motorpoint stimulation surface electrodes were placed at BB and a circular coil was positioned over the vertex for TMS stimulation. B, relation between the amplitude of the superimposed twitch evoked by TMS between 60 and 100% of MVC was extrapolated and the y-intercept was used as the estimated biceps resting twitch evoked by TMS. Data from one subject. C, motor point and force tracing (bold line) from TMS stimulation during a MVC. D and E, arm EMG and force tracing from one subject while cycling and while performing a MVC. F, motorpoint stimulation evoked twitch at rest did not change due to the whole-body exercise, which indicates that peripheral fatigue was not present in the biceps muscle at any time of the cycling protocol.
Transcranial magnetic stimulation of the motor cortex
We used a circular coil (Magstim Rapid Rate, The Magstim Co. Ltd, Whitland, Wales, UK) positioned over the vertex to evoke MEPs in biceps brachii. The direction of the current flow in the coil was clockwise to preferentially activate the muscles on the contralateral side. Stimulation intensity was set to evoke a large motor potential (MEP) in m. biceps brachii with little or no MEP in the antagonist m. triceps brachii during stimulation.
Blood sampling
Blood was sampled in pre-heparinised syringes, kept anaerobic at room temperature and analysed within 30 min for blood gas variables, glucose and lactate using a combined blood gas machine and co-oximeter (ABL 725, Radiometer, Copenhagen, Denmark). To express deviations in cerebral metabolism associated with activation of the brain (Fox & Raichle, 1986; Madsen et al. 1999), OGI and OCI were calculated (Dalsgaard et al. 2002).
Setup for measurements of voluntary activation
The setup was performed while the subject was seated but otherwise resting on the cycling ergometer and included (a) three MVCs of which the largest was taken to represent control muscle strength and (b) determination of MP and TMS stimulation intensity. TMS twitch force in biceps brachii at rest was estimated according to Todd et al. (2003). Thus voluntary contractions at 60%, 80% and 100% of MVC were performed and by linear extrapolation from these values, the estimated resting twitch amplitude was obtained (Fig. 1B).
Cycling exercise protocol
Following instrumentation, the subjects exercised for 20 min breathing room air at the workload determined in the preliminary trial (124 ± 21 W) and following 10 min of recovery, cycled at the same workload for 20 min at a  of 0.10. After approximately 90 min of rest, the subjects then performed graded exercise with a 10% increase in workload every fifth minute until exhaustion while breathing room air. Blood was drawn immediately before all exercise bouts, after 10 min, and at the end of exercise.
After 1 min of exercise and at the time for each blood sample, we obtained rating of perceived exertion (RPE) on the Borg 6–20 scale (Borg, 1975). The subjects were asked ‘How hard do you find the exercise right now?’. A few seconds apart, voluntary activation and contractile properties were assessed in two maximal contractions by TMS and electrical stimulation of the MP. During each contraction, TMS and MP stimulations were given once followed by a resting MP stimulation.
Calculations
Voluntary activation was quantified by the force responses. Using magnetic cortical stimulation any increment in elbow flexion force evoked during a MVC (superimposed twitch, Fig. 1C) was expressed as a fraction of the amplitude of the maximal response evoked by the same stimulus in the relaxed muscle. This resting twitch was estimated by linear interpolation of the TMS induced muscle twitches obtained at different levels of contractions above 50% MVC (Gandevia et al. 1996) (Fig. 1B):
 |
Changes in CBF, oxygen delivery, cerebral metabolic rate for oxygen  , and carbohydrate (CMRCHO; glucose +½ lactate) were derived from the MCA Vmean and the cerebral arterial–venous difference (a-v diff) for O2 and [glucose +½ lactate], respectively, assuming an unchanged internal diameter of the MCA (Bradac et al. 1976; Serrador et al. 2000) with resting mean CBF set at 46 ml (100 g)−1 min−1 (Madsen et al. 1993). The average capillary oxygen saturation
  was then calculated (Gjedde et al. 2005; Rasmussen et al. 2007, 2010b):
| (1) |
The O2 extraction fraction  is expressed as
| (2) |
and combining (1) and (2) yields:
| (3) |
assuming that the O2 extraction rises linearly with distance as blood traverses the capillary network (Kety, 1957). The dissolved oxygen accounts for less than 2% of the arterial oxygen (0.12 mm at 100 mmHg  ) and was disregarded. Equation (3) can then be simplified to
| (4) |
Solution of the Hill equation of O2 saturation yielded the mean  ,
,
 |
(5) |
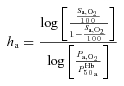
where P50a is the  when haemoglobin is half-saturated and ha is Hill's coefficient for arterial blood, P50 was estimated by the Radiometer ABL 725 machine and ha and hv were subsequently calculated using similar formalism as for ha
 |
(6) |
Because of the absence of capillary recruitment within the brain, O2 diffusibility (L) was assumed to be stable at 4.4 μmol (100 g)−1 min−1 mmHg−1 (Rasmussen et al. 2007). Changes in  relative to rest were then calculated:
| (7) |
Values for cerebral haemoglobin oxygenation tracks changes in  across the physiological range of
  and
and  (Rasmussen et al. 2007) providing support for the approach used.
Statistical analysis
Resting values prior to the three bouts of exercise were pooled and blood-derived values outside 2 s.d. were considered outliers and ignored for the analysis. During submaximal exercise blood gas values obtained after 10 min were pooled with those obtained at the end of exercise as we assumed steady state was established since no significant differences in the main outcome variables were observed from 10 to 20 min of exercise. As a consequence, we present data for rest, low intensity exercise with and without hypoxia and two points during graded exercise (after 10 min and at exhaustion). Some electrodes fell off due to sweating during high intensity exercise and MP evoked twitch in biceps muscle was not optimal. Data were, therefore, compared to set-up intensity of motor point stimulation for each subject and data smaller than any value in the set-up were excluded leaving data for 10 subjects of sufficient quality to warrant analysis. One-way repeated-measures ANOVA (proc mixed, SAS 9.1, SAS Institute Inc., Cary, NC, USA) with Tukey's post hoc procedure identified statistical significance (P < 0.05) of values presented as means ±s.d. Correlation coefficients were obtained with Pearson's test. Furthermore, the relationship between indices of fatigue and cerebral metabolism and oxygenation taking the individual subjects into consideration was tested with ANOVA (proc mixed, SAS 9.1).
Results
Rest
Heart rate and blood pressure are presented in Table 1. The arterial oxygen saturation was 98 ± 1%, the venous saturation 58 ± 4%, and MCA Vmean was 39 ± 5 cm s−1 resulting in an estimated brain oxygen delivery of 401 ± 28 μmol (100 g)−1 min−1. The  was 79 ± 4%, P50 25.7 ± 0.6 and 27.5 ± 1.4 mmHg in arterial and venous blood, respectively (Table 2), while ha and hv were 2.90 ± 0.05 and 2.70 ± 0.03, respectively, yielding a
  of 39 ± 2 mmHg.
Table 1.
Cardiovascular responses to exercise
 (%) (%) |
0.21 | 0.21 | 0.10 | 0.21 | 0.21 |
|---|---|---|---|---|---|
| Workload (W) | Rest | 124 ± 21 | 124 ± 21 | 226 ± 38 | 279 ± 75 |
| Workload (% of max) | Rest | 44 ± 8% | 44 ± 8% | 81 ± 13% | 100% |
| HR (beats min−1) | 90 ± 11 | 133 ± 13*** | 153 ± 10*** | 159 ± 11*** | 164 ± 13*** |
| MAP (mmHg) | 93 ± 5 | 102 ± 5** | 91 ± 3 | 108 ± 5*** | 100 ± 5** |
| MCA Vmean (cm s−1) | 39 ± 5 | 44 ± 5*** | 59 ± 5*** | 43 ± 3* | 39 ± 4 |
 , inspiratory oxygen fraction; HR, heart rate; MAP, mean arterial pressure; MCA Vmean, cerebral blood flow velocity in the middle cerebral artery. *, ** and ***, different from rest, P < 0.05, P < 0.01 and P < 0.001, respectively. Values are means ±s.d.
Table 2.
Arterial (a) and internal jugular venous (v) blood derived variables
 (%) (%) |
0.21 | 0.21 | 0.10 | 0.21 | 0.21 | |
|---|---|---|---|---|---|---|
| Workload (W) | Rest | 124 ± 21 | 124 ± 21 | 226 ± 38 | 279 ± 75 | |
| Workload (% of max) | Rest | 44 ± 8% | 44 ± 8% | 81 ± 13% | 100% | |
| pH | a | 7.42 ± 0.02 | 7.4 ± 0.02* | 7.43 ± 0.03 | 7.39 ± 0.02** | 7.36 ± 0.02*** |
| v | 7.35 ± 0.02 | 7.35 ± 0.01 | 7.39 ± 0.03*** | 7.33 ± 0.02** | 7.3 ± 0.03*** | |
 (mmHg) (mmHg) |
a | 36 ± 1 | 38 ± 2*** | 25 ± 2*** | 34 ± 2** | 28 ± 2*** |
| v | 48 ± 3 | 48 ± 2 | 32 ± 2*** | 47 ± 3* | 42 ± 2*** | |
 (mmHg) (mmHg) |
a | 100 ± 6 | 94 ± 6* | 30 ± 4*** | 90 ± 6*** | 91 ± 8*** |
| v | 31 ± 2 | 34 ± 3*** | 21 ± 2*** | 30 ± 3 | 31 ± 3 | |
 (%) (%) |
a | 98 ± 1 | 98 ± 0 | 58 ± 5*** | 97 ± 1 | 97 ± 1 |
| v | 58 ± 4 | 64 ± 3*** | 36 ± 4*** | 55 ± 6 | 52 ± 3*** | |
| P50 (mmHg) | a | 25.7 ± 0.6 | 26.2 ± 0.5 | 26 ± 0.9 | 26.4 ± 0.9 | 28.5 ± 1.4*** |
| v | 27.5 ± 1.4 | 27.6 ± 1.2 | 26.9 ± 1.8 | 28.0 ± 1.5 | 29.6 ± 2*** | |
| h | a | 2.90 ± 0.05 | 2.91 ± 0.05 | 2.64 ± 0.04*** | 2.84 ± 0.07 | 2.86 ± 0.04 |
| v | 2.70 ± 0.03 | 2.71 ± 0.04 | 2.54 ± 0.03*** | 2.69 ± 0.06 | 2.77 ± 0.06* |
 , inspiratory oxygen fraction;
  and
and  , partial pressures of carbon dioxide and oxygen, respectively;
  , haemoglobin oxygen saturation; P50, partial pressure of oxygen where haemoglobin is half saturated; h, Hill's coefficient. *, ** and ***, different from rest, P < 0.05, P < 0.01 and P < 0.001, respectively. Values are means ±s.d.
The arterial glucose and lactate concentrations were 5.8 ± 0.3 and 1.2 ± 0.3 mm, respectively, with a cerebral a-v diff of 0.6 ± 0.1 and −0.1 ± 0.1 mm (Table 3). The OGI was 5.8 ± 0.9 and OCI 6.2 ± 0.7 with a CMRCHO of 26 ± 6 μmol (100 g)−1 min−1.
Table 3.
Cerebral metabolic variables during cycling
 (%) (%) |
0.21 | 0.21 | 0.10 | 0.21 | 0.21 |
|---|---|---|---|---|---|
| Workload (W) | Rest | 124 ± 21 | 124 ± 21 | 226 ± 38 | 279 ± 75 |
| Workload (% of max) | Rest | 44 ± 8% | 44 ± 8% | 81 ± 13% | 100% |
| O2 a-v diff. (mmol) | 3.5 ± 0.3 | 3.1 ± 0.4* | 2.0 ± 0.3*** | 3.8 ± 0.4 | 4.1 ± 0.4*** |
| Oxygen delivery (μmol (100 g)−1 min−1) | 401 ± 28 | 486 ± 41*** | 386 ± 41 | 465 ± 48*** | 435 ± 26* |
 (%) (%) |
40 ± 4 | 34 ± 4*** | 39 ± 5 | 42 ± 4 | 46 ± 3*** |
 (mmHg) (mmHg) |
39 ± 2 | 43 ± 2** | 25 ± 2*** | 39 ± 3 | 40 ± 3 |
 (μmol 100 g−1 min−1) (μmol 100 g−1 min−1) |
158 ± 11 | 156 ± 15 | 136 ± 15** | 189 ± 20*** | 185 ± 19*** |
| CMRCHO (μmol 100 g−1 min−1) | 26 ± 6 | 26 ± 5 | 32 ± 12 | 38 ± 7** | 51 ± 10*** |
 (mmHg) (mmHg) |
0 ± 0 | 3.6 ± 3 | -10.6 ± 4.4*** | -3.6 ± 5.2 | -8.0 ± 4.5* |
| Glca (mmol l−1) | 5.8 ± 0.3 | 5.5 ± 0.3 | 6.8 ± 0.6*** | 5.1 ± 0.3*** | 5.7 ± 0.4 |
| Laca (mmol l−1) | 1.2 ± 0.3 | 1.7 ± 0.8 | 8.8 ± 1.7*** | 4.9 ± 1.5*** | 10.8 ± 1.7*** |
| Glc av diff. (mmol) | 0.6 ± 0.1 | 0.6 ± 0.1 | 0.5 ± 0.1 | 0.7 ± 0.1 | 0.8 ± 0.1** |
| Lac av diff. (mmol) | -0.1 ± 0.1 | -0.1 ± 0.1 | 0.0 ± 0.2* | 0.2 ± 0.2*** | 0.8 ± 0.2*** |
| OGI | 5.8 ± 0.9 | 5.4 ± 1,2 | 4.7 ± 1.3 * | 5.9 ± 1.6 | 5.4 ± 0.9 |
| OCI | 6.2 ± 0.7 | 6.1 ± 0.6 | 4.8 ± 0.5*** | 4.9 ± 0.5*** | 3.8 ± 0.5*** |
 , inspiratory oxygen fraction; a-v diff, arterio-venous differences,
  and CMRCHO, cerebral metabolic rate of oxygen and carbohydrate [glucose +½ lactate], respectively;
  , oxygen extraction fraction;
  , cerebral mean capillary oxygen tension; Δ
 , changes in cerebral mitochondrial oxygen tension; OCI, oxygen/glucose index; OGI, oxygen/carbohydrate index; *, ** and ***, different from rest, P < 0.05, P < 0.01 and P < 0.001, respectively. Values are mean ±s.d.
Submaximal exercise at sea level
During low intensity exercise ( 0.21) at 124 ± 21 W, heart rate, blood pressure and MCA Vmean increased (Table 1). The arterial, venous, and capillary saturations were unaffected by exercise (Tables 2 and 3) and oxygen delivery increased with MCA Vmean. The P50 increased slightly in both arterial and venous blood, while no significant changes were observed in the Hill coefficient. The
  changed across trials (P < 0.001; Table 3) and hence each
  value was used to calculate
  . The cerebral O2 extraction fraction was 34 ± 4% and lower than at rest (P < 0.001). The
  increased to 43 ± 2 mmHg (P < 0.01) and
  by 4 ± 3 mmHg (P= 0.05). No significant changes were observed in cerebral oxygen or carbohydrate metabolism.
During exercise the rectified raw EMG indicated that the biceps was <2% activated when compared to the EMG obtained during a MVC (Fig. 1D and E) and the muscle was, therefore, considered not to be directly involved in cycling and no muscle fatigue was developed since the size of the twitch evoked by MP stimulation did not change (Fig. 1F). RPE remained low (∼12) while MVC remained at 101 ± 17% of the set-up value and, similarly, voluntary activation was not affected (92 ± 8%, Fig. 1).
Exercise in hypoxia
Hypoxia augmented the increases in heart rate and MCA Vmean, while blood pressure was comparable to rest (Table 1) with arterial and venous oxygen saturation reduced (P < 0.001). The cerebral O2 extraction fraction was 39 ± 5% and arterial and venous P50 were similar to rest with corresponding ha and hv values of 2.64 ± 0.04 and 2.54 ± 0.03 (P < 0.001 versus rest, Tables 2 and 3). Yet,  fell to 25 ± 2 mmHg and despite the increase in MCA Vmean (P < 0.001), oxygen delivery declined ∼20% compared to control exercise (P < 0.001). Thus, both
  (∼15%; P < 0.01) and
  (11 ± 4 mmHg; P < 0.001) decreased.
Arterial glucose and lactate concentrations increased with exercise at a  of 0.10 (P < 0.001); however, no significant a-v diff for lactate was observed across the brain (0.04 ± 0.2; P= 0.33 versus control exercise, Table 3). Thus, CMRCHO was unchanged (P= 0.57) making OGI decrease to 4.7 ± 1.3 (P < 0.05) and OCI to 4.8 ± 0.6 (P < 0.001).
During exercise in hypoxia RPE increased to 17 (12–20; P < 0.05). After 1 min of exercise MVC was not different from rest, but at the end of trial MVC was 94 ± 25% of the control value (P < 0.05). Similarly, voluntary activation was reduced (to 82 ± 14%; P < 0.05).
Maximal exercise
When exercise proceeded to exhaustion breathing room air, heart rate and blood pressure increased compared to rest (P < 0.001, Table 1). There were only minor changes in the arterial and jugular venous oxygen saturation and MCA Vmean compared to control exercise. The cerebral O2 extraction was 46 ± 3% at the end of exercise (P < 0.001, Table 3), P50a increased to 28.5 ± 1.4 mmHg and P50v to 29.6 ± 2.0 mmHg (P < 0.001, Table 2), and the arterial Hill coefficient to 2.77 ± 0.06 (P < 0.05). Oxygen delivery increased (P < 0.001), while  did not change (40 ± 3 mmHg). Since
  increased (P < 0.001),
  decreased 8 ± 5 mmHg compared to rest (P < 0.05). The cerebral a-v diff. for glucose and lactate increased in proportion to their arterial concentrations (P < 0.001). Consequently, the OCI decreased because CMRCHO increased (P < 0.001) and reached a lowest value of 3.8 ± 0.5 (P < 0.001). No significant change in OGI was observed.
The amplitude of motor point stimulation during the exercise did not differ from control values, which indicates that the muscle was not fatigued (Fig. 1F). Similarly, after 1 min of incremental exercise to exhaustion, MVC was no different from control. At exhaustion, however, when the subjects reported maximal exertion, MVC was reduced (95 ± 12%) and voluntary activation had decreased to 85 ± 14% (P < 0.05).
Relationship between voluntary activation and cerebral metabolism
During exercise, regardless of its intensity or oxygen provision, RPE was correlated to  (mean: r2= 0.76; P < 0.05; individual data: r2= 0.18; P < 0.01; Fig. 2). The RPE was also correlated to OCI (mean: r2= 0.94; P < 0.05; individual data: r2= 0.15; P < 0.05) but not to OGI (mean: r2= 0.04). Furthermore, MVC (mean: r2= 0.76; individual data: r2= 0.12; P < 0.05) and voluntary activation (mean: r2= 0.82; individual data: r2= 0.12; P < 0.01) were correlated to
  . For OCI, however, only the mean values correlated to MVC (r2= 0.92) and voluntary activation (r2= 0.80; both P < 0.05). When the individual data were taken into consideration, the correlations disappeared (MVC: r2= 0.001; voluntary activation: r2= 0.04).
Figure 2.

Relation between measurements of fatigue (y-axis) and cerebral metabolism and oxygenation (x-axis) Data are individual and mean (open symbols) for 16 subjects (filled circles) and the four colours illustrates exercise in normoxia at 124 (black), 226 (green) and 279 W (red) and in hypoxia at 124 W (blue). The regression lines are computed according to the mean values. OCI, cerebral oxygen/carbohydrate index; Δ , changes in cerebral mitochondrial oxygen tension; RPE, ratings of perceived exertion; MVC, maximal voluntary contraction.
Discussion
This study presents several main findings: (1) that strenuous exercise reduces voluntary activation of a muscle not directly involved in the exercise and, therefore, not fatigued, (2) that the reduction in cortical motor output is in parallel with indices of cerebral deoxygenation and, less so, increased metabolism, (3) that there is no net difference for lactate across the brain during exercise in hypoxia, and (4) that during exercise in hypoxia both OGI and OCI are reduced.
Voluntary activation during strenuous exercise
The impact of exercise on the brain alone can be evaluated by several variables. The RPE may provide an estimate of the subjects’ sensation of the exercise but RPE is a subjective measure that may depend on both sensory information and cortical output. The influences of RPE are difficult to separate, if not impossible, and we did not attempt this in the present study. Similarly, a MVC is the sum of the motor systems performance including the efficacy of the CNS and of the contractile apparatus (Gandevia, 2001). Thus, MVC depends on the fatigue in either of these two parameters. Hence, a MVC does not allow for separation between central fatigue and peripheral (muscle) fatigue. On the other hand, central fatigue can be defined as a reduction in the voluntary activation of the muscles during exercise (Gandevia, 2001) and measured using twitch interpolation during a MVC (Merton, 1954).
A link between a decline in voluntary force and decrease in cerebral oxygenation has been shown during a sustained maximal handgrip contraction (Rasmussen et al. 2007). In the present study we have further explored the relation between cerebral metabolism and neural activation of muscles. For lower limb muscles it has been shown that whole-body exercise reduces MVC and VA in the muscles directly involved in and fatigued by the exercise (Lepers et al. 2002; Millet et al. 2002; Ross et al. 2007). Conversely, muscles not involved in the exercise are not previously reported to be affected with regards to the maximal voluntary force (Savard et al. 1996; Ross et al. 2007).
We have found that moderate to maximal cycling resulted in a general reduction in motor performance measured as MVC and voluntary activation of the elbow flexor muscle m. biceps brachii. During cycling the EMG activity in m. biceps brachii was minimal (less than 2% of that observed during a maximal elbow flexion) and we consider the muscle non-fatigued, at least in regards to any contraction induced fatigue. However, systemic pH and lactate could induce changes in an inactive muscle (Bangsbo et al. 1995), but we found no changes in the resting twitch force produced from electrical stimulation of the motor point of m. biceps brachii (Fig. 1F). The reduction in elbow flexor MVC during cycling exercise is therefore more likely to be of central origin. For example many small diameter group III and IV afferents signal the high level of metabolites in the muscles to the CNS, the result being a less than optimal activation of the muscles. Our findings point towards a global phenomenon activated by whole-body exercise that affects the motor system generally, such that even muscles which are not fatigued by the exercise, no longer can be activated optimally. Cerebral metabolism is a candidate that may influence the motor cortical function in particular but this study was not designed to evaluate which central mechanisms are involved in developing central fatigue.
Fatigue and cerebral metabolism
Both at rest and during exercise, CBF depends on  (Kety & Schmidt, 1948; Rasmussen et al. 2006). Maximal exercise reduces
  and in this study cerebral perfusion was insufficient to maintain
  although the decrease in
  (−8 mmHg) was less than what was established during exercise in hypoxia (−11 mmHg). Flow-metabolism coupling is non-linear (Fox & Raichle, 1986; Vafaee & Gjedde, 2000) and small changes in regional oxygen consumption, e.g. during exercise, may require a proportionally larger increase in regional blood flow and, hence, in oxygen delivery. The present data suggest that increases in regional cerebral metabolism may be limited by a low
  or a too low elevation of CBF as indicated by MCA Vmean. Besides a limitation in how much CBF increases,
  is also reduced by increased
  . Brain core temperature increases 1–2°C with submaximal exercise and even more during maximal exercise and would predict an increase in the
  without considering the additional effect of neuronal activation (Nybo et al. 2002). Assuming a Q10 of 2, it would be expected that
  should increase by more than 10% during maximal exercise and in the present study
  increased ∼15% during maximal exercise. All measurements were, however, global and regions of brain that are in charge of recruiting and modulating activity in the exercising muscles are likely to require a larger increase in blood flow than the average calculated for the brain as a whole. We can state only that the brain was unable to maintain
  during exercise in the hypoxic trial indicating that the effect of hypoxia on the brain was not trivial. Thus, when cerebral hypoxia was provoked during exercise, either by lowering of the
  or by hyperventilation-induced reduction in CBF (MCA Vmean), cortical motor output expressed as voluntary activation declined and the correlation between voluntary activation and
  supports that so-called central fatigue may be provoked by inadequate oxygenation of the brain as during handgrip exercise (Rasmussen et al. 2007). In support hereof, increasing oxygen supply to the brain increases whole-body exercise capacity (Kayser et al. 1994; Subudhi et al. 2008).
For maximal exercise the reduction in  was not as large as during exercise in hypoxia. Changes in voluntary activation may, however, also relate to changes in OCI or cerebral non-oxidative carbohydrate metabolism that appears to be intimately coupled to cerebral activation not only during exercise (Dalsgaard, 2006) but also during mental stress (Madsen et al. 1992) and in response to stimulation by light as evaluated by positron emission tomography over the visual cortex (Fox et al. 1988). However, when the indices of central fatigue, RPE and voluntary activation, were correlated to indices of cerebral metabolism, significant correlation was found only between RPE and OCI, but not between MVC and voluntary activation and OCI.
Brain lactate uptake in hypoxia
During exercise in hypoxia there was no net cerebral uptake of lactate although the arterial concentration was comparable (∼9 vs.∼11 mm) to that established during maximal exercise where there was a net lactate uptake. It seems that the brain takes up lactate in proportion to its arterial concentration during exercise (Dalsgaard, 2006; van Hall et al. 2009). Furthermore, the lactate taken up by the brain does not accumulate within the brain or in the cerebrospinal fluid (Dalsgaard et al. 2004b), nor is it released as a related compound (Rasmussen et al. 2010a), supporting that it is oxidized (van Hall et al. 2009). Yet, the brain also releases a small amount of lactate at rest and although there is a net uptake during exercise, there is also a doubling of the lactate released (van Hall et al. 2009) that is further accelerated by maximal exercise (G. van Hall, personal communication). It is, therefore, likely that the balance for lactate over the brain during exercise in hypoxia reflects an equal uptake and release. If so, it may be that the release of lactate from the brain during exercise in hypoxia corresponds to the uptake of lactate by the brain during the maximal exercise trial of approximately ∼0.6 mmol l−1 or ∼6 times the resting value. Yet, such calculation needs confirmation, e.g. by the use of stable isotopes as established for submaximal exercise (van Hall et al. 2009).
OGI and OCI during exercise in hypoxia
During maximal exercise the reduction in OCI is usually driven by a proportionally larger increase in the cerebral uptake of lactate than of glucose (Dalsgaard, 2006) and in this study OGI, in contrast to OCI, did not change significantly when exercise was maximal. However, during prolonged exercise that does not provoke an increase in the arterial lactate concentration, the OCI becomes reduced because of an accelerated cerebral glucose uptake when exercise becomes strenuous (Nybo & Secher, 2004). Similarly, during mental stress (Madsen et al. 1992) and exposure to flashing light (Fox et al. 1988), both associated with a low lactate level, a decrease in OCI is driven by the reduction in OGI. The cerebral non-oxidative carbohydrate consumption may represent increases in anaerobic energy metabolism, but how that is coupled to the apparently delicate balance of serving the neurons with substrate from blood or as proposed from astrocytes (Pellerin & Magistretti, 1994) needs to be established. We can only state that a β2-adrenergic mechanism seems to be involved in that OCI decreases at rest in response to intravenous infusion of adrenaline but not in response to noradrenaline (Seifert et al. 2009). Furthermore, the exercise-induced reduction in OCI is blocked by the non-selective β-blocker propranolol (Larsen et al. 2008), while the β1-selective antagonist metoprolol is without an effect on cerebral non-oxidative metabolism during exercise (Dalsgaard et al. 2004a).
Limitations
We used TCD to estimate flow with the assumption that data are not influenced by a change in the internal diameter of the insonated vessel. The CBF is regulated distally to the basal cerebral vessels (Giller et al. 1993; Serrador et al. 2000) and, hence, MCA diameter is not expected to change. In support, the increase in the MCA Vmean during exercise mirrors the increase in carotid flow (Hellström et al. 1996) and during exercise the increase in MCA Vmean is also in parallel with a 133Xe-washout determination of CBF (Jørgensen, 1995).
There was a tendency for the motor point stimulation to decrease at the end of exhaustive exercise although this did not reach statistical significance. We cannot, however, exclude that the study was statistically underpowered to detect muscular fatigue that may have been present at the end of the exhaustive exercise.
Conclusions
During the intense brain activation needed to perform maximal exercise, regulation of CBF does not suffice to maintain adequate  . When also
  was reduced during exercise in hypoxia, the increase in
  could not be maintained and in both situations
  fell. Also during exercise in hypoxia OCI decreases and that was the case even though there was no net uptake of lactate by the brain. Because we also found that motor cortical output, to an inactive muscle, is less than optimal during whole-body maximal exercise as during exercise in hypoxia, we consider that cerebral metabolic changes associated with the exercise have a general influence on neural function. Our findings indicate that there may be a relation between cerebral oxygenation and central fatigue, but further studies are needed to explore that relation.
Acknowledgments
The authors thank Anette Andersson, Morten Bundgaard, Lisbet Dalgaard, Thomas Kjeld, Sophie Lalande, Carsten Lundby, Camilla A. Madsen, Stefan Mortensen, Pernille Nordby, Lars Nybo, Signe Palludan, Peter Plomgaard, Morten Strømstad, Henrik Sørensen and Morten Zaar for their skilful assistance. The study received support from the Centre of Inflammation and Metabolism, Copenhagen Muscle Research Centre, and the Centre of Functionally Integrative Neuroscience. The study was also supported by grants from Anti Doping Danmark and the Lundbeck Foundation.
Glossary
Abbreviations
- CBF
cerebral blood flow
- MCA
middle cerebral artery
- MVC
maximal voluntary force
- OCI
oxygen-to-carbohydrate index
- OGI
oxygen-to-glucose index
- RPE
ratings of perceived exertion
- TMS
transcranial magnetic stimulation
Author contributions
N.C.P., P.R., R.K.M. designed the study; J.N., N.H.S., N.C.P., P.R., R.K.M. performed the study; A.G., J.N., N.C.P., P.R. analysed the data; J.N., M.O., N.H.S., N.C.P., P.R. wrote the paper. All authors approved the final version of the manuscript and The work was performed at Rigshospitalet, University of Copenhagen, Denmark.
References
- Amann M, Dempsey JA. Locomotor muscle fatigue modifies central motor drive in healthy humans and imposes a limitation to exercise performance. J Physiol. 2008;586:161–173. doi: 10.1113/jphysiol.2007.141838. [DOI] [PMC free article] [PubMed] [Google Scholar]
- Bangsbo J, Aagaard T, Olsen M, Kiens B, Turcotte LP, Richter EA. Lactate and H+ uptake in inactive muscles during intense exercise in man. J Physiol. 1995;488:219–229. doi: 10.1113/jphysiol.1995.sp020960. [DOI] [PMC free article] [PubMed] [Google Scholar]
- Borg G. Simple rating for estimation of perceived exertion. In: Borg G, editor. Physical Work and Effort. New York: Pergamon; 1975. pp. 39–46. [Google Scholar]
- Bradac GB, Simon RS, Heidsieck CH. Angiographically verified transient alteration of intercranial arteries and veins in dependence of different CO2 tension. Neuroradiology. 1976;10:257–262. doi: 10.1007/BF00327574. [DOI] [PubMed] [Google Scholar]
- Dalsgaard MK. Fuelling cerebral activity in exercising man. J Cereb Blood Flow Metab. 2006;26:731–750. doi: 10.1038/sj.jcbfm.9600256. [DOI] [PubMed] [Google Scholar]
- Dalsgaard MK, Ide K, Cai Y, Quistorff B, Secher NH. The intent to exercise influences the cerebral O2/carbohydrate uptake ratio in humans. J Physiol. 2002;540:681–689. doi: 10.1113/jphysiol.2001.013062. [DOI] [PMC free article] [PubMed] [Google Scholar]
- Dalsgaard MK, Ogoh S, Dawson EA, Yoshiga CC, Quistorff B, Secher NH. Cerebral carbohydrate cost of physical exertion in humans. Am J Physiol Regul Integr Comp Physiol. 2004a;287:R534–540. doi: 10.1152/ajpregu.00256.2004. [DOI] [PubMed] [Google Scholar]
- Dalsgaard MK, Quistorff B, Danielsen ER, Selmer C, Vogelsang T, Secher NH. A reduced cerebral metabolic ratio in exercise reflects metabolism and not accumulation of lactate within the human brain. J Physiol. 2004b;554:571–578. doi: 10.1113/jphysiol.2003.055053. [DOI] [PMC free article] [PubMed] [Google Scholar]
- Dempsey JA, Wagner PD. Exercise-induced arterial hypoxemia. J Appl Physiol. 1999;87:1997–2006. doi: 10.1152/jappl.1999.87.6.1997. [DOI] [PubMed] [Google Scholar]
- Fox PT, Raichle ME. Focal physiological uncoupling of cerebral blood flow and oxidative metabolism during somatosensory stimulation in human subjects. Proc Natl Acad Sci U S A. 1986;83:1140–1144. doi: 10.1073/pnas.83.4.1140. [DOI] [PMC free article] [PubMed] [Google Scholar]
- Fox PT, Raichle ME, Mintun MA, Dence C. Nonoxidative glucose consumption during focal physiologic neural activity. Science. 1988;241:462–464. doi: 10.1126/science.3260686. [DOI] [PubMed] [Google Scholar]
- Gandevia SC. Spinal and supraspinal factors in human muscle fatigue. Physiol Rev. 2001;81:1725–1789. doi: 10.1152/physrev.2001.81.4.1725. [DOI] [PubMed] [Google Scholar]
- Gandevia SC, Allen GM, Butler JE, Taylor JL. Supraspinal factors in human muscle fatigue: evidence for suboptimal output from the motor cortex. J Physiol. 1996;490:529–536. doi: 10.1113/jphysiol.1996.sp021164. [DOI] [PMC free article] [PubMed] [Google Scholar]
- Giller CA, Bowman G, Dyer H, Mootz L, Krippner W, Loftus CM, Muizelaar JP. Cerebral arterial diameters during changes in blood-pressure and carbon-dioxide during craniotomy. Neurosurgery. 1993;32:737–742. [PubMed] [Google Scholar]
- Gjedde A, Johannsen P, Cold GE, Østergaard L. Cerebral metabolic response to low blood flow: possible role of cytochrome oxidase inhibition. J Cereb Blood Flow Metab. 2005;25:1183–1196. doi: 10.1038/sj.jcbfm.9600113. [DOI] [PubMed] [Google Scholar]
- Hellström G, Fischer-Colbrie W, Wahlgren NG, Jögestrand T. Carotid artery blood flow and middle cerebral artery blood flow velocity during physical exercise. J Appl Physiol. 1996;81:413–418. doi: 10.1152/jappl.1996.81.1.413. [DOI] [PubMed] [Google Scholar]
- Ide K, Horn A, Secher N. Cerebral metabolic response to submaximal exercise. J Appl Physiol. 1999;87:1604–1608. doi: 10.1152/jappl.1999.87.5.1604. [DOI] [PubMed] [Google Scholar]
- Jørgensen L, Perko M, Secher NH. Regional cerebral artery mean flow velocity and blood flow during dynamic exercise in humans. J Appl Physiol. 1992;73:1825–1830. doi: 10.1152/jappl.1992.73.5.1825. [DOI] [PubMed] [Google Scholar]
- Jørgensen LG. Transcranial Doppler ultrasound for cerebral perfusion. Acta Physiol Scand Suppl. 1995;625:1–44. [PubMed] [Google Scholar]
- Kastrup A, Kruger G, Neumann-Haefelin T, Glover GH, Moseley ME. Changes of cerebral blood flow, oxygenation, and oxidative metabolism during graded motor activation. Neuroimage. 2002;15:74–82. doi: 10.1006/nimg.2001.0916. [DOI] [PubMed] [Google Scholar]
- Kayser B, Narici M, Binzoni T, Grassi B, Cerretelli P. Fatigue and exhaustion in chronic hypobaric hypoxia: influence of exercising muscle mass. J Appl Physiol. 1994;76:634–640. doi: 10.1152/jappl.1994.76.2.634. [DOI] [PubMed] [Google Scholar]
- Kety SS. Determinants of tissue oxygen tension. Fed Proc. 1957;16:666–671. [PubMed] [Google Scholar]
- Kety SS, Schmidt CF. The effects of altered arterial tensions of carbon dioxide and oxygen on cerebral blood flow and cerebral oxygen consumption of normal young men. J Clin Invest. 1948;27:484–492. doi: 10.1172/JCI101995. [DOI] [PMC free article] [PubMed] [Google Scholar]
- Larsen TS, Rasmussen P, Overgaard M, Secher NH, Nielsen HB. Non-selective beta-adrenergic blockade prevents reduction of the cerebral metabolic ratio during exhaustive exercise in humans. J Physiol. 2008;586:2807–2815. doi: 10.1113/jphysiol.2008.151449. [DOI] [PMC free article] [PubMed] [Google Scholar]
- Lepers R, Maffiuletti NA, Rochette L, Brugniaux J, Millet GY. Neuromuscular fatigue during a long-duration cycling exercise. J Appl Physiol. 2002;92:1487–1493. doi: 10.1152/japplphysiol.00880.2001. [DOI] [PubMed] [Google Scholar]
- Madsen PL, Cruz NF, Sokoloff L, Dienel GA. Cerebral oxygen/glucose ratio is low during sensory stimulation and rises above normal during recovery: excess glucose consumption during stimulation is not accounted for by lactate efflux from or accumulation in brain tissue. J Cereb Blood Flow Metab. 1999;19:393–400. doi: 10.1097/00004647-199904000-00005. [DOI] [PubMed] [Google Scholar]
- Madsen PL, Holm S, Herning M, Lassen NA. Average blood flow and oxygen uptake in the human brain during resting wakefulness: a critical appraisal of the Kety-Schmidt technique. J Cereb Blood Flow Metab. 1993;13:646–655. doi: 10.1038/jcbfm.1993.83. [DOI] [PubMed] [Google Scholar]
- Madsen PL, Schmidt JF, Holm S, Jørgensen H, Wildschiødtc G, Christensen NJ, Friberg L, Vorstrup S, Lassen NA. Mental stress and cognitive performance do not increase overall level of cerebral O2 uptake in humans. J Appl Physiol. 1992;73:420–426. doi: 10.1152/jappl.1992.73.2.420. [DOI] [PubMed] [Google Scholar]
- Merton PA. Voluntary strength and fatigue. J Physiol. 1954;123:553–564. doi: 10.1113/jphysiol.1954.sp005070. [DOI] [PMC free article] [PubMed] [Google Scholar]
- Millet G, Lepers R, Maffiuletti N, Babault N, Martin V, Lattier G. Alterations of neuromuscular function after an ultramarathon. J Appl Physiol. 2002;92:486–492. doi: 10.1152/japplphysiol.00122.2001. [DOI] [PubMed] [Google Scholar]
- Nielsen HB, Boushel R, Madsen P, Secher NH. Cerebral desaturation during exercise reversed by O2 supplementation. Am J Physiol Heart Circ Physiol. 1999;277:H1045–H1052. doi: 10.1152/ajpheart.1999.277.3.H1045. [DOI] [PubMed] [Google Scholar]
- Nybo L, Moller K, Volianitis S, Nielsen B, Secher NH. Effects of hyperthermia on cerebral blood flow and metabolism during prolonged exercise in humans. J Appl Physiol. 2002;93:58–64. doi: 10.1152/japplphysiol.00049.2002. [DOI] [PubMed] [Google Scholar]
- Nybo L, Rasmussen P. Inadequate cerebral oxygen delivery and central fatigue during strenuous exercise. Exerc Sport Sci Rev. 2007;35:110–118. doi: 10.1097/jes.0b013e3180a031ec. [DOI] [PubMed] [Google Scholar]
- Nybo L, Secher NH. Cerebral perturbations provoked by prolonged exercise. Prog Neurobiol. 2004;72:223–261. doi: 10.1016/j.pneurobio.2004.03.005. [DOI] [PubMed] [Google Scholar]
- Pellerin L, Magistretti PJ. Glutamate uptake into astrocytes stimulates aerobic glycolysis: a mechanism coupling neuronal activity to glucose utilization. Proc Natl Acad Sci U S A. 1994;91:10625–10629. doi: 10.1073/pnas.91.22.10625. [DOI] [PMC free article] [PubMed] [Google Scholar]
- Rasmussen P, Dawson EA, Nybo L, van Lieshout JJ, Secher NH, Gjedde A. Capillary-oxygenation-level-dependent near-infrared spectrometry in frontal lobe of humans. J Cereb Blood Flow Metab. 2007;27:1082–1093. doi: 10.1038/sj.jcbfm.9600416. [DOI] [PubMed] [Google Scholar]
- Rasmussen P, Nyberg N, Jaroszewski JW, Krogh-Madsen R, Secher NH, Quistorff B. Brain nonoxidative carbohydrate consumption is not explained by export of an unknown carbon source: evaluation of the arterial and jugular venous metabolome. J Cereb Blood Flow Metab. 2010a doi: 10.1038/jcbfm.2010.25. in press doi 10.1038/jcbfm.2010.1025. [DOI] [PMC free article] [PubMed] [Google Scholar]
- Rasmussen P, Overgaard A, Fabricius-Bjerre A, Bjarrum M, Carlsson C, Petersen N, Nielsen HB, Volianitis S, Gjedde A, Secher NH. The effects of normoxia, hypoxia, and hyperoxia on cerebral haemoglobin saturation using near infrared spectroscopy during maximal exercise. Int J Ind Ergon. 2010b;40:190–196. [Google Scholar]
- Rasmussen P, Stie H, Nielsen B, Nybo L. Enhanced cerebral CO2 reactivity during strenuous exercise in man. Eur J Appl Physiol. 2006;96:299–304. doi: 10.1007/s00421-005-0079-3. [DOI] [PubMed] [Google Scholar]
- Ross EZ, Middleton N, Shave R, George K, Nowicky A. Corticomotor excitability contributes to neuromuscular fatigue following marathon running in man. Exp Physiol. 2007;92:417–426. doi: 10.1113/expphysiol.2006.035972. [DOI] [PubMed] [Google Scholar]
- Savard GK, Areskog NH, Saltin B. Maximal muscle activation is not limited by pulmonary ventilation in chronic hypoxia. Acta Physiol Scand. 1996;157:187–190. doi: 10.1046/j.1365-201X.1996.493234000.x. [DOI] [PubMed] [Google Scholar]
- Seifert TS, Brassard P, Jorgensen TB, Hamada AJ, Rasmussen P, Quistorff B, Secher NH, Nielsen HB. Cerebral non-oxidative carbohydrate consumption in humans driven by adrenaline. J Physiol. 2009;587:285–293. doi: 10.1113/jphysiol.2008.162073. [DOI] [PMC free article] [PubMed] [Google Scholar]
- Serrador JM, Picot PA, Rutt BK, Shoemaker JK, Bondar RL. MRI measures of middle cerebral artery diameter in conscious humans during simulated orthostasis. Stroke. 2000;31:1672–1678. doi: 10.1161/01.str.31.7.1672. [DOI] [PubMed] [Google Scholar]
- Subudhi AW, Lorenz MC, Fulco CS, Roach RC. Cerebrovascular responses to incremental exercise during hypobaric hypoxia: effect of oxygenation on maximal performance. Am J Physiol Heart Circ Physiol. 2008;294:H164–171. doi: 10.1152/ajpheart.01104.2007. [DOI] [PubMed] [Google Scholar]
- Subudhi AW, Miramon BR, Granger ME, Roach RC. Frontal and motor cortex oxygenation during maximal exercise in normoxia and hypoxia. J Appl Physiol. 2009;106:1153–1158. doi: 10.1152/japplphysiol.91475.2008. [DOI] [PMC free article] [PubMed] [Google Scholar]
- Todd G, Taylor JL, Gandevia SC. Measurement of voluntary activation of fresh and fatigued human muscles using transcranial magnetic stimulation. J Physiol. 2003;551:661–671. doi: 10.1113/jphysiol.2003.044099. [DOI] [PMC free article] [PubMed] [Google Scholar]
- Vafaee MS, Gjedde A. Model of blood-brain transfer of oxygen explains nonlinear flow-metabolism coupling during stimulation of visual cortex. J Cereb Blood Flow Metab. 2000;20:747–754. doi: 10.1097/00004647-200004000-00012. [DOI] [PubMed] [Google Scholar]
- van Hall G, Stromstad M, Rasmussen P, Jans O, Zaar M, Gam C, Quistorff B, Secher NH, Nielsen HB. Blood lactate is an important energy source for the human brain. J Cereb Blood Flow Metab. 2009;29:1121–1129. doi: 10.1038/jcbfm.2009.35. [DOI] [PubMed] [Google Scholar]