

Abstract
Context:
Sweat sodium losses have never been reported in a large cohort of American football players.
Objective:
To compare sweat rates (SwtRs), sweat sodium concentrations (SwtNa+), and sodium losses in 3 groups of players (backs and receivers [BK], linebackers and quarterbacks [LB/QB], and linemen [LM]) to determine if positional differences and, therefore, size differences exist.
Design:
Observational study.
Setting:
Data were collected during practices in the second week of 2 consecutive training camps. The wet bulb globe temperature was 78.5°F ± 3.5°F (25.9°C ± 1.9°C).
Patients or Other Participants:
Eighteen BK, 12 LB/QB, and 14 LM volunteered.
Intervention(s):
Sterile sweat patches were applied to the right forearm after the skin was appropriately cleaned. The patches were removed during practice, placed in sterile tubes, centrifuged, frozen, and later analyzed by flame photometry.
Main Outcome Measure(s):
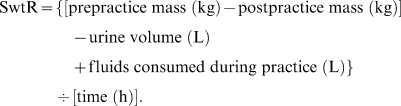
Sweat rate, SwtNa+, and sodium loss. We calculated SwtR by change in mass adjusted for urine produced and fluids consumed divided by practice time in hours.
Results:
Other than age, physical characteristics were different among groups (P < .001). The SwtR was different among groups (F2,41 = 7.3, P = .002). It was lower in BK (1.42 ± 0.45 L/h) than in LB/QB (1.98 ± 0.49 L/h) (P < .05) and LM (2.16 ± 0.75 L/h) (P < .01), but we found no differences between SwtRs for LB/QB and LM. The SwtNa+ was not different among groups (BK = 50 ± 16 mEq/L, LB/QB = 48.2 ± 23 mEq/L, and LM = 52.8 ± 25 mEq/L) and ranged from 15 to 99 mEq/L. Sweat sodium losses ranged from 642 mg/h to 6.7 g/h, and findings for group comparisons approached significance (P = .06). On days when players practiced 4.5 hours, calculated sodium losses ranged from 2.3 to 30 g/d.
Conclusions:
The BK sweated at lower rates than did the midsized LB/QB and large LM, but LB/QB sweated similarly to LM. Sweat sodium concentration and daily sodium losses ranged considerably. Heavy, salty sweaters require increased dietary consumption of sodium during preseason.
Keywords: hypovolemia, sodium consumption, hydration, thermoregulation, fluid balance, electrolyte balance
Key Points
Sweat sodium concentration ranged considerably from one athlete to another.
Sweat sodium losses may be difficult to replace in some American football players.
Football players need to be educated about the dangers of overdrinking.
Recent field investigations1–11 of intestinal temperatures, sweat rates (SwtRs), sweat losses, serum electrolytes, and urinary measures of hydration have vastly improved our understanding of thermoregulation and fluid balance in American football players during preseason training. Higher core temperatures and greater SwtRs have been documented5,9,10 in large interior linemen (LM) than in running and defensive backs and wide receivers (BK). Because these direct comparisons between the LM and BK have always occurred under identical equipment and environmental conditions, the higher core temperatures in the LM are likely due to a larger body mass and, therefore, greater metabolic rate at a given exercise intensity combined with a lower body surface area (BSA) to mass ratio.5,7,12 Similarly, the higher rates of sweating in the LM are likely caused by greater mass (higher metabolic rate) and larger BSA, as both are correlated with SwtR.5,9,10 Adequate sweat production is critical for evaporative heat dissipation, particularly in large athletes exercising in protective equipment, but it may be challenging for heavy, salty sweaters to maintain electrolyte balance, and therefore fluid balance, when practicing twice per day on consecutive days, as is typical in both professional and high school football.
Mean daily sweat losses of between 8 and 10 L/d were reported in a series of studies3–5,9 involving both professional and collegiate football players. Using average sweat sodium concentrations (SwtNa+) (approximately 50 mEq/L),13 calculated daily sodium losses in excess of 10 g/d have occurred in some of these players.9,11 In the United States, the recommended dietary sodium intake for an adult man is less than 1200 mg/d, which may be inadequate for replacing the sodium losses reported in some football athletes, potentially resulting in sodium depletion.14,15 Low serum sodium levels, hypovolemia, and an inability to maintain body mass during preseason have been documented2,4,11 in both collegiate and professional football players. These findings are likely the result of high volumes of sweat losses being replaced with hypotonic fluids over consecutive days of double practice sessions in addition to inadequate dietary sodium consumption. Although daily sodium intake is likely adequate for most athletes in the United States, this may not hold true for football players who are known to lose up to 15 L of sweat per day during preseason training.11
Investigators have reported on SwtNa+ and sodium losses during training and games in European football (soccer) players13,16–19 and on SwtRs and sweat losses in endurance athletes, such as runners3,20; however, few data on American football players are available. We have reported differences in SwtRs between LM and BK, but we have not studied the midsized players, such as linebackers, fullbacks, and quarterbacks (LB/QB).9 Additionally, we have calculated sweat sodium losses based on average SwtNa+ data published in the literature, but we have not directly measured SwtNa+ or sodium losses in football players. Therefore, the purpose of our study was to measure SwtRs, SwtNa+, and sodium losses in 1 professional football team and to make comparisons among 3 groups of players (BK, LB/QB, and LM) to determine if positional differences and, therefore, size differences exist. We hypothesized that SwtR would be greater in LM than in LB/QB and BK and greater in LB/QB than in BK but that no differences would be found in SwtNa+.
METHODS
Participants
Forty-four professional football players from the same National Football League (NFL) team volunteered to participate in our study. They included 18 BK, 12 LB/QB, and 14 LM (including tight ends, defensive ends, and interior linemen). All participants provided written informed consent, and the study was approved by the Institutional Review Board for Human Subjects at West Chester University.
Procedures
All data were collected during outdoor practices between days 6 and 14 of 2 consecutive preseason training camps held at the same facility. The wet bulb globe temperature across all days was 78.5°F ± 3.5°F (25.9°C ± 1.9°C). Two or 3 players representing at least 2 of the 3 groups (BK, LB/QB, and LM) were studied during each practice to ensure that in no situation was only 1 of the groups studied during any 1 practice. The preseason schedule for this NFL team was identical for the 2 consecutive years and consisted of players participating in a conditioning test in the morning of the first day and practicing for 2.25 hours that afternoon in helmets, shorts, and shells (shells). For the following 3 days, the team practiced for 2.25 hours in the morning (full pads) and then for 2.25 hours in the afternoon in shells. From the fifth through the 14th day, the entire team practiced in full pads each morning for 2 to 2.25 hours and every other afternoon in shells for 1 to 1.25 hours. On the days when some of the players were not practicing in the afternoon, special teams practices were held in full pads for 1 to 1.5 hours; therefore, practices ranged in length from 1 to 2.25 hours, and all calculations are based on SwtR and sweat sodium losses per hour of practice.
Sweat Collection
Before practices, the right upper forearm of each player was wiped with isopropyl alcohol and dried with sterile gauze. The same area was then thoroughly washed with deionized water and dried completely with a separate sterile gauze sponge. A 2.5 × 2.5–cm sterile sweat patch was applied to the skin and secured with impermeable microfilm tape. This specific site has been shown to be representative of whole-body SwtNa+.21,22 The patches were removed between 40 and 60 minutes after the start of practice while the players were on the field but were not engaged in physical activity. Extensive pilot testing has shown that this is the appropriate length of time in the football population (under similar environmental conditions) for the patches to absorb an adequate volume of sweat without becoming saturated. The gauze patches were immediately placed in sterile, low-retention tubes (Fisher Scientific, Pittsburgh, PA) and taken to an on-site laboratory where they were centrifuged for 10 minutes at 2500 rpm (model 5453; Eppendorf AG, Hamburg, Germany) within 20 minutes of the conclusion of practice. The neat sweat samples were frozen and subsequently analyzed for sodium content by flame photometry (model EW-02655-00; Cole-Parmer, Vernon Hills, IL).
Sweat Rate
Participants recorded body mass before and after practice while dressed in dry shorts. After the prepractice body mass measurement, participants dressed and reported to the field, where they drank their choice of either water alone or water and sports drinks (sodium = 19.1 mEq/L, potassium = 3.4 mEq/L, sugar = 59 g/L) during practice from premeasured, individual containers, as previously described.3,9 After practice, they voided their bladders for volumetric measurements. Most players on this team have had their SwtRs measured previously, so they understood the data collection protocol, the importance of not spitting out the water, and the need for the researchers to collect all of the urine they produced between the 2 body mass measurements. The SwtR was calculated by change in mass adjusted for urine produced and fluids consumed divided by practice time in hours using the following formula3,23:
 |
Calculations
The SwtNa+ was converted from parts per million to milliequivalents per liter and also reported as milligrams or grams for general ease of interpretation. Sweat sodium losses were calculated per hour of practice (in both millimoles and milligrams), and total sweat and sodium losses were calculated for 4.5 hours to estimate what the players would lose on a typical day of twice-daily practices. The BSA was calculated per the method of Dubois and Dubois.24
Statistical Analysis
Group differences in physical characteristics, SwtRs (L/h), calculated sweat losses for 4.5 hours of practice (L), SwtNa+ (mEq/L), sweat sodium losses (mmol/h and mg/h), calculated sodium losses for 4.5 hours of practice (mmol and g), fluid consumption (mL/h), urine volume (mL/h), percentage of weight loss, and percentage of weight loss replaced by fluids were made using 1-way analysis of variance. We used the post hoc Tukey test when a significant F value was found. Relationships between BSA and SwtR, mass and SwtR, and SwtR and fluids consumed during practices were calculated using the Pearson product moment correlation. We used VassarStats (2008; Vassar College, Poughkeepsie, NY) for statistical analysis. This software did not provide exact statistical values for the post hoc Tukey test. The α level was set at .05.
RESULTS
All physical characteristics except age were different among the 3 groups (Table 1). The SwtR was different among groups (F2,41 = 9.74, P < .0003) and specifically was lower in BK than in LB/QB (P < .05) and LM (P < .01), but we found no differences between LB/QB and LM (Table 2; Figure 1). Consequently, calculated sweat losses for 4.5 hours of practice during days with 2 practice sessions were also different (F2,41 = 9.74, P < .0003), with BK lower than LB/QB (P < .05) and LM (P < .01), but no differences existed between LB/QB and LM (Table 3). The SwtNa+ was not different among groups (F2,41 = 1.15, P = .86) (BK = 50 ± 16 mEq/L, LB/QB = 48.2 ± 23 mEq/L, LM = 52.8 ± 25 mEq/L), and overall it ranged from 15 to 99 mEq/L (Figure 2). Sweat sodium losses ranged from 22.5 mmol/h (517 mg/h) to 291 mmol/h (6.7 g/h), and findings for group comparisons (BK = 73 ± 4 mmol/h, LB/QB = 96 ± 5 mmol/h, LM = 121 ± 8 mmol/h) approached significance (F2,41 = 2.98, P = .06) (Figure 3). Calculated sodium losses when players practiced 4.5 h/d are shown in Table 3 and ranged from 2.3 g/d in a cornerback to 30.2 g/d in a tight end. Fluid consumption was different among groups (F2,41 = 4.85, P = .012) and was lower in BK than in LM (P < .05), but no differences existed between BK and LB/QB or between LB/QB and LM (Table 2). No differences existed among groups in terms of urine volume, percentage of weight loss, or percentage of weight loss replaced by fluids (Table 2). We found moderate correlations between BSA and SwtR (r = 0.52, P < .0005), mass and SwtR (r = 0.44, P = .003), and SwtR and fluids consumed during practices (r = 0.60, P < .001) (Figures 4–6).
Table 1.
Physical Characteristics of the 3 Groups of Football Playersa

Table 2.
Fluid Turnover and Weight Loss in 3 Groups of Football Players

Figure 1.

Sweat rate in small (backs), midsized (linebackers and quarterbacks), and large (linemen) professional football players. a Indicates backs were different from linebackers and quarterbacks (P < .05). b Indicates backs were different from linemen (P < .01).
Table 3.
Calculated Sweat and Sodium Losses in 4.5 Hours of Preseason Practices

Figure 2.

Sweat sodium concentration was not different among groups.
Figure 3.

Estimated sweat sodium losses in 4.5 hours of practice during preseason approached significance (P = .06).
Figure 4.

Sweat rate and body surface area were correlated (r = 0.52, P < .0005).
Figure 6.

Sweat rate and fluid consumption during practice were correlated (r = 0.60, P < .001).
Figure 5.

Sweat rate and body mass were correlated (r = 0.44, P = .003).
DISCUSSION
We are the first to investigate actual sodium losses in a large cohort of American football players at any level of competition. We sought to identify if positional differences and, therefore, body size differences exist in SwtRs, SwtNa+, or sodium losses within American football players. Indeed, we5,7,9 previously documented differences in SwtRs and core temperatures between large LM and smaller BK but did not include midsized players, such as LB/QB. Data related to thermoregulation and fluid balance have indicated that football players represent a heterogeneous population compared with players in other sports.1,3 Football players consistently sweat at higher rates compared with average-sized soccer players or endurance athletes,3,13,16–19,25,26 and even within the sport of football, LM have higher SwtRs and sweat losses compared with BK.9,10 The physical differences inherent to these groups of players should result in SwtRs that are higher in the LM than in BK, with the midsized LB/QB in between, which is what we found. However, it is interesting to note that the LB/QB appeared to be more similar to the LM with regard to SwtRs, although their BSAs and masses were equally different from those of both BK and LM. This may be the result of the relatively large individual variability in SwtRs, which have been reported in the literature.3,9,13,18,27–29
We also expected to find no differences in SwtNa+ among the 3 groups. The mean SwtNa+ values of between 49 and 52 mEq/L in our football players were nearly identical to those found in a series of studies in elite soccer players.13,16,17 We used the forearm for placement of sweat patches, which actually could have resulted in an underestimation of total body SwtNa+.13,17 Maughan et al13 placed sweat patches on elite soccer players at 4 different sites, which yielded sodium concentrations of 43 ± 13 mmol/L (43 ± 13 mEq/L) on the forearm, 59 ± 17 mmol/L (59 ± 17 mEq/L) on the chest, 52 ± 16 mmol/L (52 ± 16 mEq/L) on the back, and 37 ± 11 mmol/L (37 ± 11 mEq/L) on the thigh, with an overall mean concentration of 49 ± 12 mmol/L (49 ± 12 mEq/L). The sodium concentration of the thigh sweat samples was different from that of both the chest and back samples, and the forearm sweat samples were different from the chest samples.13 In a study by Maughan et al,17 SwtNa+ ranged from 40 to 90 mmol/L (40–90 mEq/L; mean, 72 ± 15 mmol/L [72 ± 15 mEq/L]) from chest sweat samples and from 37 to 90 mmol/L (37–90 mEq/L; mean, 69 ± 16 mmol/L [69 ± 16 mEq/L]) from back sweat samples, resulting in an overall mean (also including the forearm and thigh) for total body SwtNa+ of 62 ± 13 mmol/L (62 ± 13 mEq/L). Because BSA of the chest and back is greater than BSA of the extremities, particularly in football players, our sweat sodium samples taken from the forearm actually may have underestimated total body sodium losses. That being said, Shirreffs and Maughan21 collected total body sweat samples using a wash-down technique and recorded SwtNa+ of 50.8 mmol/L (50.8 mEq/L), which is nearly identical to what we found in our forearm samples, and their sweat sodium data ranged from 35.2 to 81 mmol/L (35.2–81 mEq/L).
With similar SwtNa+ but higher sweat losses in the LM and LB/QB than in the BK, we expected to see higher overall sodium losses in the larger players. However, the substantial variability in SwtRs and, to a greater extent, SwtNa+ (15–99 mEq/L) may have resulted in the lack of significant findings in total sodium losses among the groups (P = .06). Although not statistically different, it is clinically important to note the differences in average daily sodium losses of 7.6 ± 3.9 g (approximately 4 teaspoons [20 g] of table salt) in BK, 9.9 ± 5.3 g (approximately 5 teaspoons [25 g] of table salt) in LB/QB, and 12.5 ± 7.8 g (approximately 6.5 teaspoons [32.5 g] of table salt) in LM when players practiced for 4.5 h/d. We agree with other authors13 who have described the 3.1 g of sodium lost by one soccer player during 90 minutes of training as high (presumably the highest in their cohort); however, our BK lost a daily average in excess of twice that amount, and the LM lost more than 4 times that amount per day. Notably, the average sodium loss per 90 minutes of practice in our LM was 4.2 g, with the highest loss exceeding 10 g.
Although a dietary sodium intake of less than 1.2 g/d is recommended, current data15 have indicated that the typical American consumes 3.4 g of sodium (8.6 g NaCl or approximately 1.7 teaspoons [8.5 g] of table salt) per day. We would expect that large football players consume salt in excess of what the typical American ingests because they likely consume considerably more calories, and they consume it in response to their substantial sodium losses. However, in a study14 of nutrient intake in National Collegiate Athletic Association Division I athletes, researchers found that the male athletes consumed 2.94 ± 1.3 g of sodium per day. Of the 185 male athletes in that study, 29% were football players. Importantly, the football and basketball players had a lower energy intake but higher body mass compared with the athletes in other sports, which included track, baseball, golf, swimming, and wrestling.14 The authors suggested that football and basketball players may have difficulty consuming an adequate number of calories, which was supported by the fact that more than 70% of the football players reported that they were trying to gain weight. Because these athletes completed their nutrient intake and dietary behavior recalls at the end of the preseason, another viable explanation for the inability of the football players to gain weight could be sodium deficits and, therefore, fluid deficits.2,4,14 Clearly, 2.94 g/d intake of dietary sodium would not be adequate for the professional athletes in our study, as only 2 of 44 players (both BK) lost fewer than 3 g of sodium per day.
What is currently not known is if football players who lose tremendous amounts of sodium actually crave salt and, therefore, if they consume an appropriate amount in their normal diets to replace daily losses. Beauchamp et al30 experimentally induced sodium depletion in participants by using diuretics in combination with a very low sodium diet over 10 days. Although their participants did not describe differences in how salty or sweet foods tasted while they were sodium depleted, they did rate the pleasantness of salty foods very high (correlation between foods known to be salty and pleasantness of those foods; r = 0.86, P < .001) compared with when they were not sodium depleted.30 In a separate study,31 participants who were sodium depleted by exercise and sodium restriction and then placed on a sodium-free diet for the following 24 hours showed a higher preference for hypertonic sodium chloride solutions by the 17th and 23rd hours than they did before sodium depletion. Additionally, water deprivation alone is believed to play a role not only in producing the sensation of thirst but also in stimulating sodium appetite.32 However, an important difference between the participants in these studies and our cohort is that the football players were neither sodium nor fluid deprived.30,31
Interestingly, 7 of 13 NFL players recently studied33 during preseason underreplaced their daily sweat sodium losses when they practiced for 4.5 h/d, indicating that they either did not crave salt or could not consume enough salt in their normal diets. More studies in which sodium intake is investigated during preseason in a larger group of football players and at a variety of playing levels should be considered. Clinicians need to understand the large individual variability in SwtRs, SwtNa+, and, consequently, sodium losses in this group of athletes.
For several years, we have expected large sodium losses in football players but were surprised by the substantial individual variability and the actual extent of these salt losses. The range of sodium lost to sweating during a day with 4.5 hours of practice was 2.33 to 14.8 g in the BK, 3.15 to 17.5 g in the LB/QB, and 3.3 g to a remarkable 30 g in the LM. Of the 44 athletes who participated in this study, the individual player who lost 30 g/d (15 teaspoons [75 g] of table salt) had the third highest SwtR (2.94 L/h) and the highest SwtNa+ (99 mEq/L). Amazingly, replacing 30 g of sodium with the average sports drink would require nearly 65 L; this is not only impractical, but it would add 13 742 kcal and 3848 g of sugar and would cause hyponatremia.34 Clearly, it is improbable that football players who are heavy, salty sweaters can consume this amount of sodium in their diets and so they would require substantial dry sodium supplementation, such as salt tablets or capsules.
Sodium supplementation has been studied35 during distance events, such as triathlons, and is not considered necessary for these athletes; however, these athletes have been studied over the course of a 1-day event and not over consecutive days. Using salty fluids that were commercially available, 14 professional football players were supplemented at and between meals with 4.5 g of sodium per day for the first 5 days of training camp.6 The supplementation of 4.5 g of sodium (11.4 g NaCl) was based on replacing half of what was calculated as the average sodium losses in the average football player practicing 4 h/d.28,29 These players maintained normal blood sodium levels and body mass, and plasma volume expanded by the morning of the third day; however, blood potassium was elevated.6 In a separate study, using a similar protocol, 10 NFL players were supplemented with sodium chloride solutions containing 4.5 g of sodium but no added potassium for the first 5 days of training camp. The sodium supplementation was incrementally decreased on the sixth and seventh days, and the researchers reported no changes in blood sodium, potassium, or chloride and reported no differences in morning body mass during the first 10 days of training camp, compared with baseline measures.8 Most recently, football players who supplemented with sodium equal to 50% of their known daily sweat sodium losses but no potassium during the first week of preseason showed no change in blood electrolytes or body mass and an increase in plasma volume.36 These studies indicate that adequate sodium replacement may prevent low blood sodium and plasma volume previously reported2,4 in collegiate and professional football players.
Position statements and roundtable communications have focused on the replacement of fluid during exercise in volumes equal to or greater than sweat losses.23,37,38 However, this advice may need to be carefully considered for the football population, as hydration programs focused on fluid replacement of 100% or more during practices may actually exacerbate the sodium imbalances in the players who have high SwtRs and SwtNa+.10 Seizures due to hyponatremia have been reported in an NFL player (serum sodium = 116 upon admission to the hospital) who consumed 2 to 3 gallons (3.75–5.7 L) of water and at least 1.8 L of sports drinks during the first day of a mini-camp and was encouraged to consume more sports drinks at home.34 Hyponatremia due to overhydration was ruled to be the cause of death in a high school football player from California.39 Importantly, most fluid-replacement beverages contain approximately 20 mEq/L or less of sodium, which cannot replenish the salt losses that we have reported. It is critical for certified athletic trainers to understand this and not to be swayed by the notion that sports drinks are the answer to the dilemma of maintaining electrolyte balance in football players. In addition, some of these players are consuming in excess of 2 L/h, which is not only considerably more than fluid-replacement guidelines suggest23 but could likely cause gastrointestinal fullness to an extent that performance is negatively affected (oral communications with professional football players).40 Over the past 8 years many players on the Philadelphia Eagles team have told me they feel too full if they drink too many sports drinks in combination with the water they consume on the field.
Lastly, another important finding in this study was the remarkably consistent amount of fluid that these players consumed during practices, which was supported by the relationship (r = 0.60, P < .001) between SwtR and fluid consumption. Each group replaced virtually two-thirds of the fluids that it lost, which was what was found in 2 groups of football players exposed to very different on-field hydration protocols.10 Specifically, Fowkes Godek et al10 recently reported identical fluid replacement (66%) in NFL and collegiate players exposed to different on-field hydration programs, indicating that drinking during breaks in practice is no different from having constant access to fluids. In this study, even with a personal attendant to provide constant access to water and sports drinks, all 3 groups replaced exactly the same percentage of their sweat losses (about 66%). Athletes commonly incur this type of fluid deficit, which is termed involuntary dehydration, during exercise and although some authors23,37,38 believe that dehydration can be detrimental, it may actually help to minimize hyponatremia.9,10,17,25,41 This is important because other researchers41–47 believe that the minor amount of weight loss that our professional players experienced (<3% in all 44 players) is likely of no consequence to thermoregulation or performance.
Observational field research has inherent limitations, such as the inability to control intensity of exercise; the length of practice; and, to a lesser extent, the environmental conditions. We made every attempt to control for this by studying 2 or 3 participants from at least 2 of the groups during each practice.
CONCLUSIONS
Smaller BK sweated at lower rates compared with both midsized LB/QB and large LM, but the midsized players sweated at rates similar to those of LM. Importantly, athletic trainers and other sports medicine professionals who work in the sport of football need to recognize the potential for the vast range of sodium losses common to this cohort, so that individual fluid and electrolyte needs can be appropriately met. Knowledge of not only players' SwtRs but also of their specific SwtNa+ may be critical for helping these athletes maintain electrolyte balance, and therefore fluid balance, particularly when they practice multiple times on consecutive days. Given the daily sodium losses that we documented, it may be important for athletic trainers to educate football players not to overhydrate during practices so that they will not promote serum sodium dilution in addition to the sweat sodium losses that they incur. Tragically, this appears to have been the cause of death of a high school football player from California.39 Regardless of the position that they play, football players who sweat heavily and have a high SwtNa+ likely require sodium replacement in addition to increased dietary consumption of salt during the preseason.
Acknowledgments
We thank the players and coaching staff of the Philadelphia Eagles football team and Jason Kopec for his assistance with the data collection.
REFERENCES
- 1.Fowkes Godek S., Godek J. J., Bartolozzi A. R. Thermal responses in football and cross-country athletes during their respective practices in a hot environment. J Athl Train. 2004;39(3):235–240. [PMC free article] [PubMed] [Google Scholar]
- 2.Fowkes Godek S., Bartolozzi A. R., Kelly M. Changes in blood electrolytes and plasma volume in National Football League players during preseason training camp. Athl Train Sports Health Care. 2009;1(6):259–266. [Google Scholar]
- 3.Fowkes Godek S., Bartolozzi A. R., Godek J. J. Sweat rate and fluid turnover in American football players compared with runners in a hot and humid environment. Br J Sports Med. 2005;39(4):205–211. doi: 10.1136/bjsm.2004.011767. [DOI] [PMC free article] [PubMed] [Google Scholar]
- 4.Fowkes Godek S., Godek J. J., Bartolozzi A. R. Hydration status in college football players during consecutive days of twice-a-day preseason practices. Am J Sports Med. 2005;33(6):843–851. doi: 10.1177/0363546504270999. [DOI] [PubMed] [Google Scholar]
- 5.Fowkes Godek S., Bartolozzi A. R., Burkholder R., Sugarman E., Dorshimer G. Core temperature and percentage of dehydration in professional football linemen and backs during preseason practices. J Athl Train. 2006;41(1):8–17. [PMC free article] [PubMed] [Google Scholar]
- 6.Fowkes Godek S., Bartolozzi A. R., Sugarman E., Peduzzi C., Hunkele T., Burkholder R. Blood electrolytes and plasma volume changes in two groups of sodium supplemented NFL players during pre-season [abstract] J Athl Train. 2006;41(suppl 2):S60. [Google Scholar]
- 7.Fowkes Godek S., Bartolozzi A. R., Greene R., Burkholder R. Core temperature in NFL linemen and backs in full pads versus shorts and shells during pre-season practices [abstract] Med Sci Sports. 2007;39(5):S436–S437. [Google Scholar]
- 8.Fowkes Godek S., Bartolozzi A., Kopec J., Greene R. Blood, urine and body mass measures of fluid and electrolyte balance in NFL players supplemented with sodium chloride but no potassium during pre-season [abstract] J Athl Train. 2007;42(suppl 2):S61. [Google Scholar]
- 9.Fowkes Godek S., Bartolozzi A. R., Burkholder R., Sugarman E., Peduzzi C. Sweat rates and fluid turnover in professional football players: a comparison of National Football League linemen and backs. J Athl Train. 2008;43(2):184–189. doi: 10.4085/1062-6050-43.2.184. [DOI] [PMC free article] [PubMed] [Google Scholar]
- 10.Fowkes Godek S., Bartolozzi A. R., Peduzzi C., et al. Fluid consumption and sweating in National Football League and collegiate football players with different access to fluids during practice. J Athl Train. 2010;45(2):128–135. doi: 10.4085/1062-6050-45.2.128. [DOI] [PMC free article] [PubMed] [Google Scholar]
- 11.Fowkes Godek S., Bartolozzi A. R. Hydration and core temperature in a football player during preseason: a case study. Athl Ther Today. 2004;9(4):64–70. [Google Scholar]
- 12.Marino F. E., Mbambo Z., Kortekaas E., et al. Advantages of smaller body mass during distance running in warm, humid environments. Pflugers Arch. 2000;441(2–3):359–367. doi: 10.1007/s004240000432. [DOI] [PubMed] [Google Scholar]
- 13.Maughan R. J., Merson S. J., Broad N. P., Shirreffs S. M. Fluid and electrolyte intake and loss in elite soccer players during training. Int J Sport Nutr Exerc Metab. 2004;14(3):333–346. doi: 10.1123/ijsnem.14.3.333. [DOI] [PubMed] [Google Scholar]
- 14.Hinton P. S., Sanford T. C., Davidson M. M., Yakushko O. F., Beck N. C. Nutrient intakes and dietary behaviors of male and female collegiate athletes. Int J Sport Nutr Exerc Metab. 2004;14(4):389–405. doi: 10.1123/ijsnem.14.4.389. [DOI] [PubMed] [Google Scholar]
- 15.Kaplan N. M. The dietary guideline for sodium: should we shake it up? No. Am J Clin Nutr. 2000;71(5):1020–1026. doi: 10.1093/ajcn/71.5.1020. [DOI] [PubMed] [Google Scholar]
- 16.Maughan R. J., Shirreffs S. M., Merson S. J., Horswill C. A. Fluid and electrolyte balance in elite male football (soccer) players training in a cool environment. J Sports Sci. 2005;23(1):73–79. doi: 10.1080/02640410410001730115. [DOI] [PubMed] [Google Scholar]
- 17.Maughan R. J., Watson P., Evans G. H., Broad N., Shirreffs S. M. Water balance and salt losses in competitive football. Int J Sport Nutr Exerc Metab. 2007;17(6):583–594. doi: 10.1123/ijsnem.17.6.583. [DOI] [PubMed] [Google Scholar]
- 18.Shirreffs S. M., Aragon-Vargas L. F., Chamorro M., Maughan R. J., Serratosa L., Zachwieja J. J. The sweating response of elite professional soccer players to training in the heat. Int J Sports Med. 2005;26(2):90–95. doi: 10.1055/s-2004-821112. [DOI] [PubMed] [Google Scholar]
- 19.Shirreffs S. M., Sawka M. N., Stone M. Water and electrolyte needs for football training and match-play. J Sports Sci. 2006;24(7):699–707. doi: 10.1080/02640410500482677. [DOI] [PubMed] [Google Scholar]
- 20.Millard-Stafford M., Sparling P. B., Rosskopf L. B., Hinson B. T., DiCarlo L. J. Carbohydrate-electrolyte replacement during a simulated triathlon in the heat. Med Sci Sports Exerc. 1990;22(5):621–628. doi: 10.1249/00005768-199010000-00013. [DOI] [PubMed] [Google Scholar]
- 21.Shirreffs S. M., Maughan R. J. Whole body sweat collection in humans: an improved method with preliminary data on electrolyte content. J Appl Physiol. 1997;82(1):336–341. doi: 10.1152/jappl.1997.82.1.336. [DOI] [PubMed] [Google Scholar]
- 22.Shirreffs S. M., Maughan R. J. Volume repletion after exercise-induced volume depletion in humans: replacement of water and sodium losses. Am J Physiol. 1998;274(5, pt 2):F868–F875. doi: 10.1152/ajprenal.1998.274.5.F868. [DOI] [PubMed] [Google Scholar]
- 23.Casa D. J., Armstrong L. E., Hillman S. K., et al. National Athletic Trainers' Association position statement: fluid replacement for athletes. J Athl Train. 2000;35(2):212–224. [PMC free article] [PubMed] [Google Scholar]
- 24.Dubois D., Dubois E. F. A formula to estimate the approximate surface area if height and weight be known. Arch Int Med. 1916;17:863–871. [Google Scholar]
- 25.Broad E. M., Burke L. M., Cox G. R., Heeley P., Riley M. Body weight changes and voluntary fluid intakes during training and competition sessions in team sports. Int J Sport Nutr. 1996;6(3):307–320. doi: 10.1123/ijsn.6.3.307. [DOI] [PubMed] [Google Scholar]
- 26.Millard-Stafford M., Sparling P. B., Rosskopf L. B., Snow T. K., DiCarlo L. J., Hinson B. T. Fluid intake in male and female runners during a 40-km field run in the heat. J Sports Sci. 1995;13(3):257–263. doi: 10.1080/02640419508732235. [DOI] [PubMed] [Google Scholar]
- 27.Greene R., Fowkes Godek S., Bartolozzi A. R., Peduzzi C. Sweat sodium and total sodium losses in NFL players with EAMC during training camp versus matched non-crampers [abstract] Med Sci Sports. 2007;39(5):S15. [Google Scholar]
- 28.Burkholder R., Fowkes Godek S., Peduzzi C., Condon S., Kopec J., Greene R. Sweat sodium content and sodium losses in NFL players during practices in week 1 versus week 3 of preseason [abstract] J Athl Train. 2007;42(suppl 2):S59. [Google Scholar]
- 29.Condon S., Fowkes Godek S., Peduzzi C., Kopec J., Burkholder R. A racial comparison of sweat sodium content in National Football League players [abstract] J Athl Train. 2007;42(suppl 2):S59. [Google Scholar]
- 30.Beauchamp G. K., Bertino M., Burke D., Engelman K. Experimental sodium depletion and salt taste in normal human volunteers. Am J Clin Nutr. 1990;51(5):881–889. doi: 10.1093/ajcn/51.5.881. [DOI] [PubMed] [Google Scholar]
- 31.Takamata A., Mack G. W., Gillen C. M., Nadel E. R. Sodium appetite, thirst, and body fluid regulation in humans during rehydration without sodium replacement. Am J Physiol. 1994;266(5, pt 2):R1493–R1502. doi: 10.1152/ajpregu.1994.266.5.R1493. [DOI] [PubMed] [Google Scholar]
- 32.De Luca L. A., Jr, Vendramini R. C., Pereira D. T., et al. Water deprivation and the double- depletion hypothesis: common neural mechanisms underlie thirst and salt appetite. Braz J Med Biol Res. 2007;40(5):707–712. doi: 10.1590/s0100-879x2007000500015. [DOI] [PubMed] [Google Scholar]
- 33.Burkholder R., Fowkes Godek S., Pike K., Peduzzi C., Allen C., Bartolozzi A. R. Dietary sodium intake and sweat sodium losses in professional football players during pre-season training camp [abstract] J Athl Train. 2009;44(suppl 3):S79. [Google Scholar]
- 34.Dimeff R. J. Seizure disorder in a professional American football player. Curr Sports Med Rep. 2006;5(4):173–176. doi: 10.1097/01.csmr.0000306502.32987.57. [DOI] [PubMed] [Google Scholar]
- 35.Hew-Butler T. D., Sharwood K., Collins M., Speedy D., Noakes T. Sodium supplementation is not required to maintain serum sodium concentrations during an Ironman triathlon. Br J Sports Med. 2006;40(3):255–259. doi: 10.1136/bjsm.2005.022418. [DOI] [PMC free article] [PubMed] [Google Scholar]
- 36.Fowkes Godek S., Bartolozzi A. R., Burkholder R., Condon S., Peduzzi C. Fluid and electrolyte balance in NFL players individually supplemented with 50% of their known daily sweat sodium losses using NaCl enhanced fruit juice during preseason [abstract] J Athl Train. 2009;44(suppl 3):S36. [Google Scholar]
- 37.Sawka M. N., Burke L. M., et al. American College of Sports Medicine. American College of Sports Medicine position stand: exercise and fluid replacement. Med Sci Sports Exerc. 2007;39(2):377–390. doi: 10.1249/mss.0b013e31802ca597. [DOI] [PubMed] [Google Scholar]
- 38.Bergeron M. F., McKeag D. B., Casa D. J., et al. Youth football: heat stress and injury risk. Med Sci Sports Exerc. 2005;37(8):1421–1430. doi: 10.1249/01.mss.0000174891.46893.82. [DOI] [PubMed] [Google Scholar]
- 39.Ratliff D. Coroner: water overdose killed H.S. football player. http://www.kget.com/news/local/story/Coroner-Water-Overdose-Killed-H-S-Football-Player/zLCscuDxQk-jc88oEDyZ4g.cspx. Accessed December 16, 2009.
- 40.Daries H. N., Noakes T. D., Dennis S. C. Effect of fluid intake volume on 2-h running performances in a 25 degrees C environment. Med Sci Sports Exerc. 2000;32(10):1783–1789. doi: 10.1097/00005768-200010000-00019. [DOI] [PubMed] [Google Scholar]
- 41.Dugas J. P., Oosthuizen U., Tucker R., Noakes T. D. Rates of fluid ingestion alter pacing but not thermoregulatory responses during prolonged exercise in hot and humid conditions with appropriate convective cooling. Eur J Appl Physiol. 2009;105(1):69–80. doi: 10.1007/s00421-008-0876-6. [DOI] [PubMed] [Google Scholar]
- 42.Byrne C., Lee J. K., Chew S. A., Lim C. L., Tan E. Y. Continuous thermoregulatory responses to mass-participation distance running in heat. Med Sci Sports Exerc. 2006;38(5):803–810. doi: 10.1249/01.mss.0000218134.74238.6a. [DOI] [PubMed] [Google Scholar]
- 43.Noakes T. IMMDA. Fluid replacement during marathon running. Clin J Sport Med. 2003;13(5):309–318. doi: 10.1097/00042752-200309000-00007. [DOI] [PubMed] [Google Scholar]
- 44.Noakes T. D., Myburgh K. H., du Plessis J., et al. Metabolic rate, not percent dehydration, predicts rectal temperature in marathon runners. Med Sci Sports Exerc. 1991;23(4):443–449. [PubMed] [Google Scholar]
- 45.Cheuvront S. N., Carter R., III, Haymes E. M., Sawka M. N. No effect of moderate hypohydration or hyperthermia on anaerobic exercise performance. Med Sci Sports Exerc. 2006;38(6):1093–1097. doi: 10.1249/01.mss.0000222838.74015.15. [DOI] [PubMed] [Google Scholar]
- 46.Cheuvront S. N., Haymes E. M. Ad libitum fluid intakes and thermoregulatory responses of female distance runners in three environments. J Sports Sci. 2001;19(11):845–854. doi: 10.1080/026404101753113796. [DOI] [PubMed] [Google Scholar]
- 47.McConell G. K., Stephens T. J., Canny B. J. Fluid ingestion does not influence intense 1-h exercise performance in a mild environment. Med Sci Sports Exerc. 1999;31(3):386–392. doi: 10.1097/00005768-199903000-00006. [DOI] [PubMed] [Google Scholar]