Abstract
There is considerable interest in quantitatively measuring nucleic acids from single cells to small populations. The most commonly employed laboratory method is the real-time polymerase chain reaction (PCR) analyzed with the crossing point or crossing threshold (Ct) method. Utilizing a multiwell plate reader we have performed hundreds of replicate reactions at each of a set of initial conditions whose initial number of copies span a concentration range of ten orders of magnitude. The resultant Ct value distributions are analyzed with standard and novel statistical techniques to assess the variability/reliability of the PCR process. Our analysis supports the following conclusions. Given sufficient replicates, the mean and/or median Ct values are statistically distinguishable and can be rank ordered across ten orders of magnitude in initial template concentration. As expected, the variances in the Ct distributions grow as the number of initial copies declines to 1. We demonstrate that these variances are large enough to confound quantitative classification of the initial condition at low template concentrations. The data indicate that a misclassification transition is centered around 3000 initial copies of template DNA and that the transition region correlates with independent data on the thermal wear of the TAQ polymerase enzyme. We provide data that indicate that an alternative endpoint detection strategy based on the theory of well mixing and plate filling statistics is accurate below the misclassification transition where the real time method becomes unreliable.
Keywords: Misclassification Transition, Single Molecule Counting, Rank Ordering
1 Introduction
Real time Polymerase Chain Reaction (PCR) is widely used for quantitative analysis [1, 2, 3] in a variety of clinical and research areas including the study of genetically modified foods, vaccine efficacy, and in systems biology [4, 5, 6]. In a real time PCR reaction the DNA amplification process is recorded. The goal of a quantitative analysis is to use the amplification time series data, Y(n) = AX(n), to solve the inverse problem of determining a reasonable proxy for the amount of initial template, X(0). A satisfactory solution of this inverse problem has been hampered by the amplification of error, dilution error, the multivariate nature of the enzyme system and the lack of a model that accounts for the variability [1, 7, 8, 9, 10, 11].
In its stead, the ad-hoc crossing point, Ct, method has emerged [12]. The heuristic behind the selection of the crossing threshold is predicated on the observation that amplification curves from identically prepared initial conditions diverge dramatically with iteration. In accordance with this observation a threshold value is chosen close to the detection threshold to limit variability from amplification error. But variability remains. It is a well known result from statistics [13, Section 4.8] that averaging over replicates reduces variance in ratio to the number of replicates. In practice, from 1 to 5 replicates appears typical. Since there is a balance between cost, time, effort and accuracy it is of practical interest to understand the requirement for replicates and its dependence on initial template concentration.
The goal of this study was to examine the variability in the distribution of Ct values generated from a large number of identically prepared replicates as a function of the initial template concentration to determine the following:
Are measures of central tendency informative of initial template concentration over 10 orders of magnitude?
How many replicates are required to discriminate between different initial template concentrations?
How does the number of replicates depend on the initial template concentration?
Using a multiwell plate format we measured hundreds of replicates to produce Ct value distributions. Using standard and novel statistical techniques we analyze the Ct value distributions and demonstrate that the sample mean and/or median Ct values are statistically significantly distinguishable over ten orders of magnitude. Furthermore, we show that the sample mean Ct values are reliably ordered according to the initial concentration of template. In other words, if x and y are initial template concentrations with x < y and μx and μy are the corresponding sample mean Ct values then μx > μy. The order reverses because less initial template requires more cycles of PCR to amplify. We utilize ordering as a convenient and natural device to quantify the role of replicates on reliability. We ask and answer the following question: Given an unlabeled dilution series how many replicates are required to reliably order the tubes? We find that the answer depends on the range of initial template.
A focus of this work was to cover as broad a range of initial conditions as possible with the same experimental format. We observed that the mean and/or median Ct values had the smallest variance above 104 initial copies. Most published standard curves focus on this range [2]. Few studies have analyzed issues of variability and robustness below this range. We show that below 104 initial copies the probability of misclassification of the initial template concentration given a Ct value grows rapidly and saturates near a half. The dispersion in the Ct value distributions and the rise in misclassification correlate with an independent measure of the thermal wear of the TAQ polymerase enzyme.
Driven by the observed broadening of the Ct value distributions below a thousand initial copies, and inspired by elegant methods that sidestep the issues created by the dynamics of exponential growth [14, 15, 16, 17, 18], we examined a format for single molecule detection utilizing an endpoint analysis and the statistical properties of well mixing and plate filling. We present data that such an assay is accurate where the real time method becomes unreliable.
2 Materials and Methods
2.1 PCR
Rt-PCR results were generated using linearized double stranded EC3 plasmid DNA containing the ybdO gene. The plasmid was linearized by digestion with the restriction enzyme BamH1 prior to PCR. The following primer sequences were used.
Forward: 5’-AAT TAT TCT AAA ACC AGC GTG TC-3’
Reverse 5’-TTT GGG ATT GAA TCA CTG TTT C-3’
The PCR supermix was prepared as described in [19], with the exception that we used Qiagen HotStarTaq Cat # 203203, Roche dNTPs Cat# 13583000, DMSO Sigma # D8418 at 2%, and Sybr Green (Sigma # 86205) at 5-times the recommended concentration. Primers were used at a concentration of 1 µM. All samples were run on the 384 well plate platform using an Applied Biosystems 7900HT thermocycler and the SDS 2.3 software. The Ct value threshold was set at 5.0 RFU (Relative Fluorescence Units) for all samples. The DNA concentrations of concentrated stocks were measured using a Nano-Drop 100 spectrophotometer prior to use. Subsequent dilutions were performed using sterile, nuclease free water from Ambion # AM9937. The following thermo-cycling program was used.
2min at 50°C Initial Warmup Phase
15min at95°C Initial TAQ Activation Step
1min at 95°C DNA Denaturation
1min at 50°C Primer Annealing
1min at 72°C DNA Extension
0.25min at 80°C Fluorescence Measurement
Repeat Steps 3–6 forty times.
2.2 Preparation of Identical Replicates
To ensure uniformity in the face of pipetting error the PCR supermix was prepared in well-mixed batches in a 14-mL conical tube. Each sample consisted of 184 replicates and 8 negative controls, requiring exactly half of a 384 well plate. All of the components except for DNA were loaded into a 14 mL conical tube in the following order: 800 µL PCR buffer, 5.6 mL of nuclease free water, 160 µL DMSO, 320 µL MgCl2 (Qiagen Cat # 124113012), 160 µL of a primer mix (a 1:1 mix of the forward and reverse primer stored at a concentration of 50 M each), 160 µL Sybr Green (100× stored in DMSO), 160 µL of dNTPs, and lastly 80 µL of Taq polymerase. We have noticed that the order at which these are added affects the reproducibility of the assay. The mixture was vortexed at high speed for 1 minute. 335 µL of supermix was then removed to be used as a negative control and placed into a 1 mL eppendorf tube and 25 µL of water was added. This mixture was then briefly vortexed to ensure well mixing. The remaining 7.105 mL of supermix was then split equally four ways into 2 mL cryostat tubes, and 134 µL of water plus the amount of desired DNA was added to each cryostat tube. Each tube was then briefly vortexed. For each reaction contained within a single well of the plate, 10 µL of the respective reaction mix was loaded into a well of the 384 well plate.
2.3 TAQ Polymerase Pre-Wear Assay
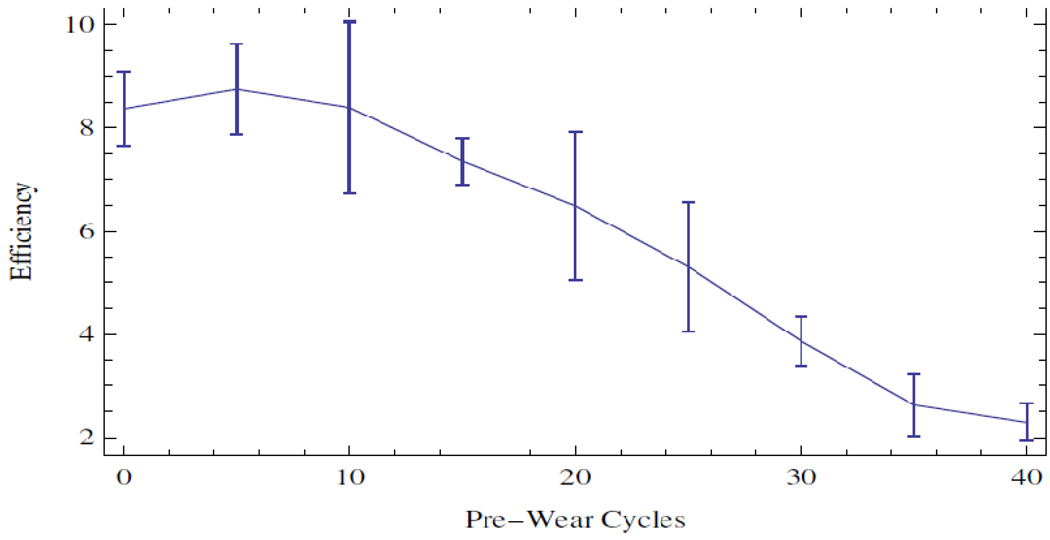
The PCR supermix was prepared as described above, but without template DNA. Steps 1 and 2 of the PCR process were executed following which samples were pre-worn by thermocycling the supermix as described in steps 3 through 6 above. Samples were pre-worn from 5 to 40 cycles. 10 8 copies of initial template DNA were added to the preworn enzyme with subsequent resumption of cycling. An efficiency was calculated by averaging the derivative over the resultant amplification curve.
2.4 Statistical Analysis of Ct Distributions
The sample mean Ct values for each initial template concentration were compared pairwise using a permutation test that is asymptotically valid and robust in situations where the distributions are not necessarily normal and/or the ratio of the variances is unknown, indicating that a t-test is not supported [20, 21]. The test statistic T [20], measures the difference in mean rank of the samples within their union, scaled by a consistent estimator of their variance. Because the Ct value distributions may be skewed by outliers, we also considered the median as a measure of central tendency. The median Ct values were compared pair-wise using a bootstrap test that has been shown to outperform all reasonable alternative methods [22].
Given a linear regression, y = mx + b, of the mean/median Ct values against x = log(n), the log of the number of initial copies of template, a relative error was calculated from the quantiles of the Ct value distributions as follows. Allow to be high and low quantile values chosen from the Ct value distribution generated by initial log template x. Since the Ct value generally increases with decreasing amount of initial template the slope m of the regression line(s) is negative. Thus, the difference in the predicted amount of initial template DNA from the distributions divided by the input amount is given as:
Let U represent the universe of possible Ct values, and let T stand for the collection of possible initial template concentrations. The initial template concentrations are thought of as the class labels. We consider the probability of misclassifying an observed Ct value given a known class label. Suppose that we draw a Ct value from a given class, how likely is it to find that value in any of the other classes? The mean misclassification probability, is estimated from the Ct value distributions corresponding to different initial template concentrations according to the following formula.
Where P(i|x) is the conditional probability of finding the Ct value i, given the initial template concentration x, and the P(i|T\x) is the conditional probability of observing that same value given any initial template concentration other than x. The later conditional probability is interpreted as the probability of misclassification. The conditional probabilities are estimated from the measured Ct value frequency distributions.
2.5 Plate Filling with Microbeads
Experiments were performed using 20µm latex beads from Beckman Coulter (#PN6602798) using flat bottom 96 well plates from Becton Dickinson Labware. 96 well plates were used in place of 384 well plates for ease of microscopic analysis. Various dilutions of beads were prepared using a Beckman Multisizer Coulter Counter 2. 25 µL of each dilution was loaded into each well of the 96 well plate. The number of beads in each well was counted with a TE-2000 microscope.
2.6 Plate Filling Simulations
The statistics of the plate filling stochastic process were modeled using Monte-Carlo simulation. For instance, the expected number of empty wells in a 96 well plate was estimated by simulation using the following function:
-
Table[Mean[
-
Table[Length[
-
Complement[Range[96],
RandomInteger[Range[96], m]]], {10000}]], {m, 1, 600}]
-
-
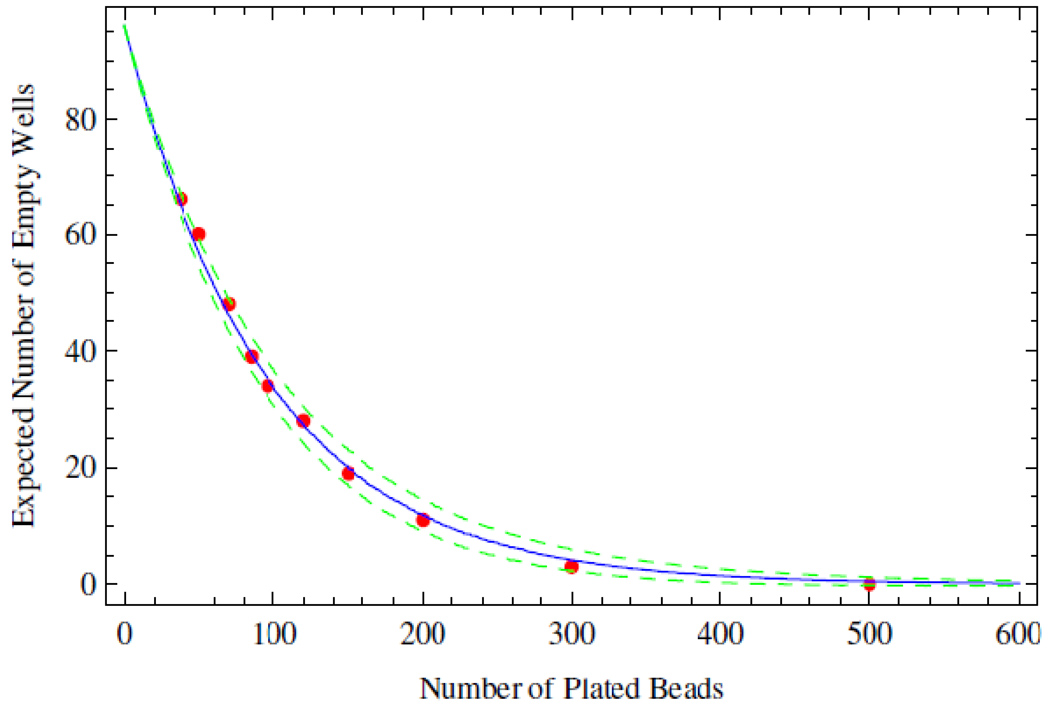
Here m is the number of molecules being plated from a well mixed solution. The mean is estimated from 10,000 realizations. The standard deviation is computed by replacing the function Mean by StandardDeviation. A graph of these functions is shown in Figure 9. All simulations and analysis were carried out in Mathematica 6.03 (Wolfram Research), and the notebooks are available upon request.
Figure 9.
Agreement between experimental and theoretical plate filling statistics. The expected number of empty wells is shown as a function of the total number of beads distributed among the wells of a 96-well plate. The expected number of unfilled wells calculated from theory is shown as the solid blue line, while one standard deviation is shown as the dotted green line. Experimental data are shown in red.
3 Results
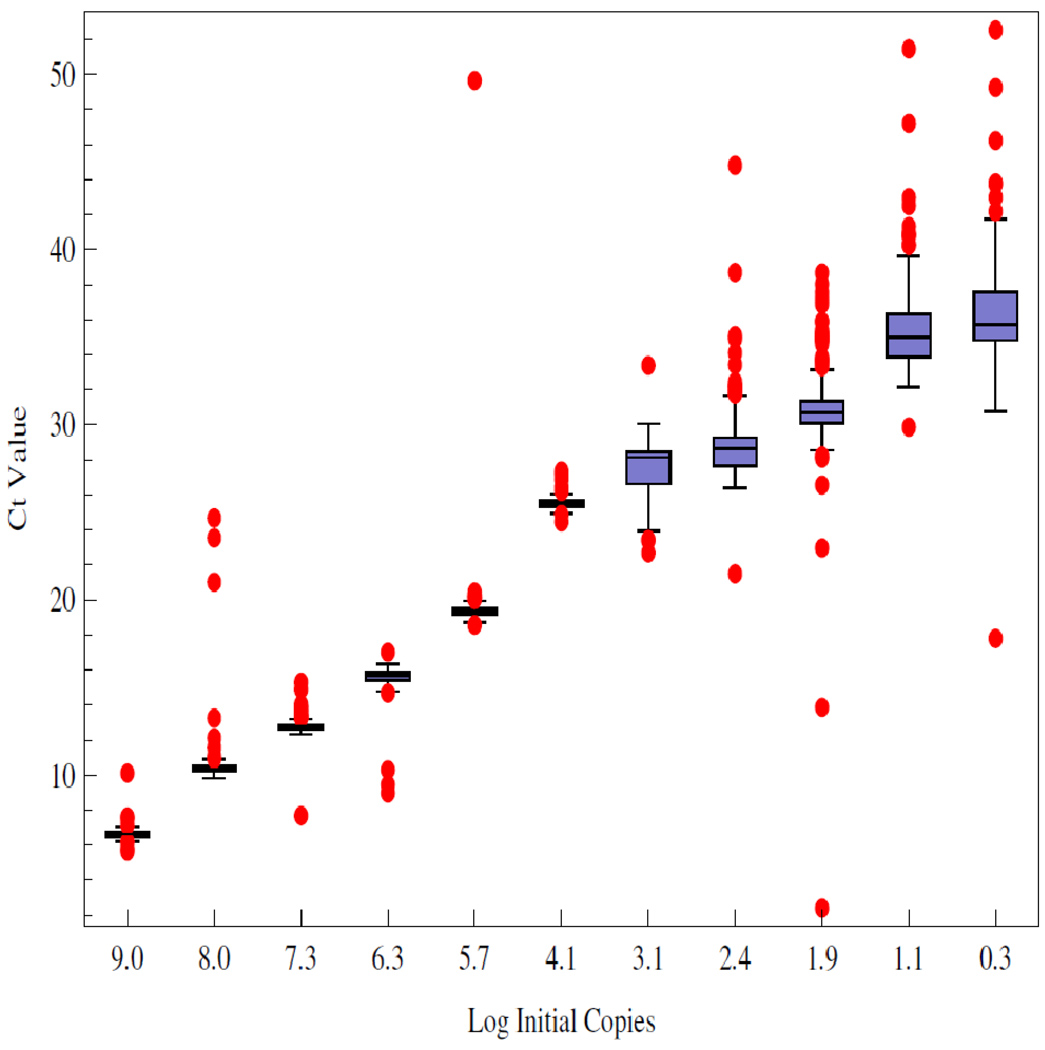
The Ct value data are summarized in Figure 1. The figure shows that above 10 4 copies the data are distributed about the median with smaller variance than those below. Outliers exist across all the data, mostly trending upward of the median, indicative of reactions lagging behind the pack. The data show the distributions as collected across ten orders of magnitude in initial template.
Figure 1.
Summary of the Ct value data, stratified as a function of the log of the initial number of copies of DNA amplified. As described in methods, a minimum of 175 replicates were run at each initial condition. The box covers two quartiles about the median with outliers shown as the red dots. Outliers are defined as points beyond 3/2 the discrete interquantile range from the edge of the box.
3.1 Mean and Median Ct values
While the Ct value distributions below 10 4 copies of initial template DNA are broad and noisy, the sample means and medians form a monotone increasing series when stratified according to initial template. These data are shown in Table 1. The means and medians are very nearly equal in all cases and the data distributions appear unimodal.
Table 1.
Sample Mean and Median Ct values. The corresponding distributions are shown in Figure 1. Observe that the sample means and medians form an ordered sequence stratified by initial template.
| Distribution Number | 1 | 2 | 3 | 4 | 5 | 6 | 7 | 8 | 9 | 10 | 11 |
|---|---|---|---|---|---|---|---|---|---|---|---|
| Log Copies Template | 9.0 | 8.0 | 7.3 | 6.3 | 5.7 | 4.1 | 3.1 | 2.4 | 1.9 | 1.1 | 0.3 |
| Replicates | 184 | 182 | 183 | 183 | 184 | 183 | 184 | 179 | 730 | 175 | 178 |
| Mean CtValue | 6.6 | 10.6 | 12.8 | 15.6 | 19.5 | 25.5 | 27.6 | 28.8 | 30.7 | 35.5 | 36.4 |
| Median CtValue | 6.6 | 10.4 | 12.8 | 15.7 | 19.3 | 25.5 | 28.1 | 28.7 | 30.7 | 35.0 | 35.7 |
At initial template concentrations larger than 10 4 initial copies the data distributions seen in Figure 1 appear to identify distinguishable mean and median values and no hypothesis test appears necessary. However at lower template concentrations it is not clear that the means are not within a fraction of a standard deviation of one another. When all of the data points are taken into account the means and medians are statistically different at a level of significance greater than 1/20000 with the exception of the smallest two medians that were statistically different at the 3/1000 level of significance. The result of the significance test for the means is displayed in Table 2.
Table 2.
Results of testing the null hypothesis of stochastic equality. A hypothesis tests was applied pairwise to Ct value distributions adjacent in initial template concentration. The extreme values of the distribution of the T-statistic under the null hypothesis are shown along with the T-statistic for adjacent distributions. The distributions, e.g. “2v1”, are labeled as in Table 1. In each test, the null distribution was simulated using 20,000 random permutations applied to the pooled data as described in [20]. In each test the calculated T-statistic fell outside of the range indicating that the p-value is less than 1/20000. In each case the null hypothesis is rejected with confidence.
| Property | 2v1 | 3v2 | 4v3 | 5v4 | 6v5 | 7v6 | 8v7 | 9v8 | 10v9 | 11v10 |
|---|---|---|---|---|---|---|---|---|---|---|
| Min | −5.02 | −3.85 | −4.63 | −4.25 | −4.06 | −4.10 | −3.94 | −4.62 | −4.50 | −3.57 |
| Max | 3.93 | 4.17 | 3.87 | 3.74 | 4.13 | 5.03 | 4.77 | 4.87 | 3.73 | 3.74 |
| T | 684.33 | 39.61 | 51.45 | 23809.7 | 91. | 24.27 | 7.29 | 18.37 | 81.7 | 4.22 |
The Ct value distributions may not be normal and because we do not a priori know the ratio of the variances, standard hypothesis tests to compare means are not justified. Several non-parametric methods have been proposed for this common situation [20, 21] and shown to have power. The last row of Table 2 contains the T-statistic comparing template-adjacent distributions. The values of the T-statistic are generally declining as template decreases and come closer to the upper boundary of the null distribution. Because the fourth and fifth distributions are non-overlapping the variance estimator takes its minimum value and this explains the large T value. All of the other pairs of distributions contain some overlap and hence have much larger variances. The data indicate that with approximately 184 replicates the Ct method can provide discrimination over nine orders of magnitude. One goal of our work, to be described below, is to provide some analysis of how few replicates are required to reliably make the same claim.
3.2 Standard Curves
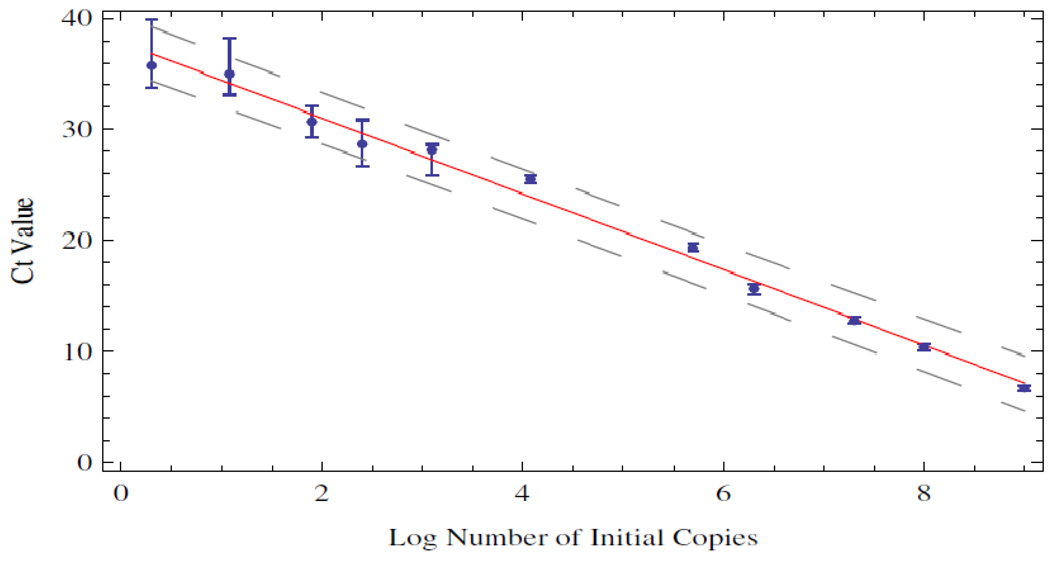
A linear regression of the mean Ct values against log initial copies of DNA template is shown in Figure 2. The regression line captures the data reasonably well over the entire range of initial template concentration. In contrast, Figure 1 gives the impression that the data are described by a function that is initially linear and then contains at least two sigmoid like transitions. This can also be seen in the oscillation of the data about the regression line in Figure 2.
Figure 2.
Linear regression of the mean Ct values with log initial copy number. The regression line is shown in red along with a 95% confidence interval in dashed line. The error bars on the individual data points reflect one standard deviation computed from the Ct value distributions.
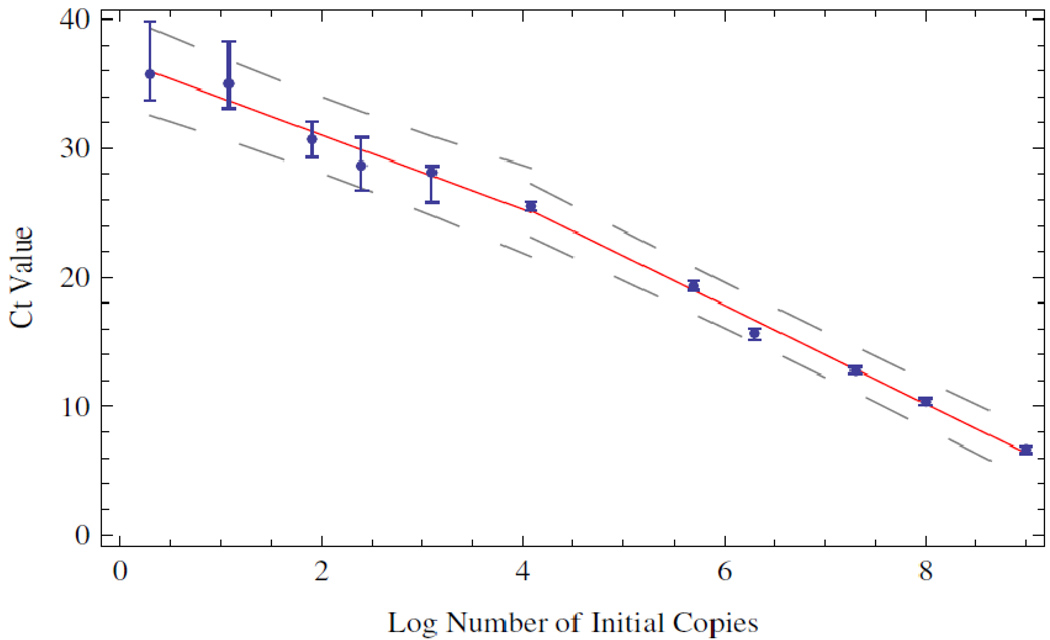
In an independent experiment with the same enzyme and supermix, we examined the wear that the enzyme experiences as a function of thermocycling alone. The middle of the transition region corresponds to a Ct value of approximately 25. As seen in Figure 1, the thermal wear transition corresponds to the region near 10 4 copies where the distributions begin to broaden. Because of this independent observation, we split the data in two at this transition point and considered a piecewise linear regression. The data are summarized in Figure 4.
Figure 4.
Piecewise linear regression of the mean Ct values. The data were split according to the trends observed in Figures 1 and 3.
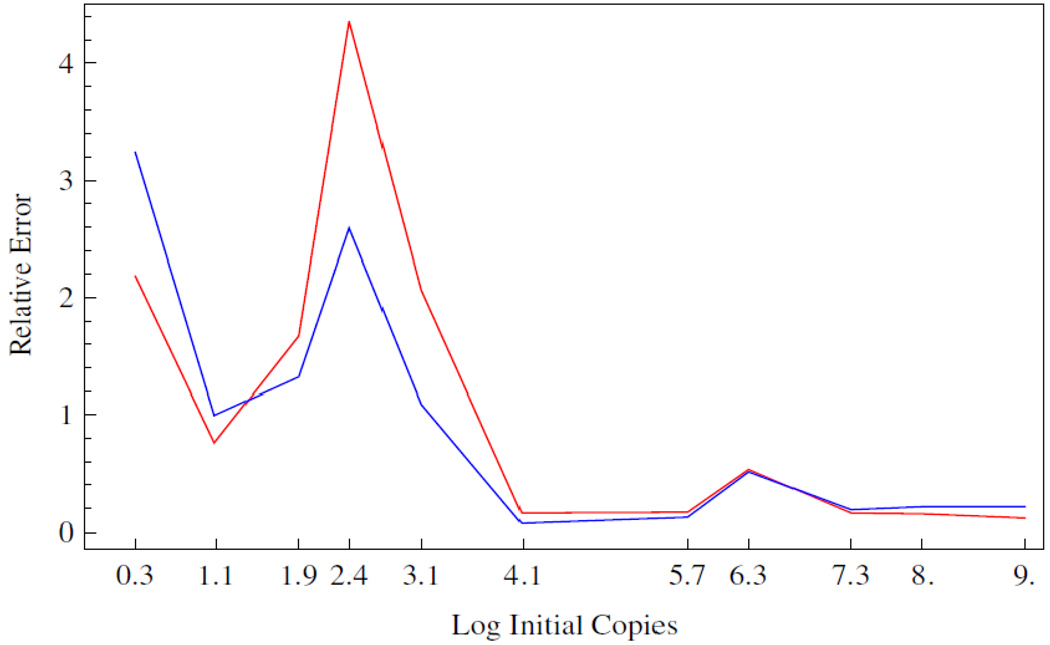
Given a regression model of the data we computed a measure of the relative error of the inversion process, from the spread in the Ct value distributions, using the equation for , as described in section 2.4. The first and third quartiles were used to produce the data shown in Figure 5. The data show that the relative error is approximately 20% above 10 4 initial copies, and rises sharply below. The piecewise linear regression, shown as the red line, produces a larger relative error in the transition region, and agrees elsewhere.
Figure 5.
Relative error of the PCR process as calculated from the Ct value distributions and the standard curves shown in Figures 2 and 4, Blue and Red respectively. The Ct values corresponding to the first and third quartile were used to calculate a ΔDNA value whose limits were calculated using the regression line(s), according to the definition of given in section 2.4.
3.3 Misclassification
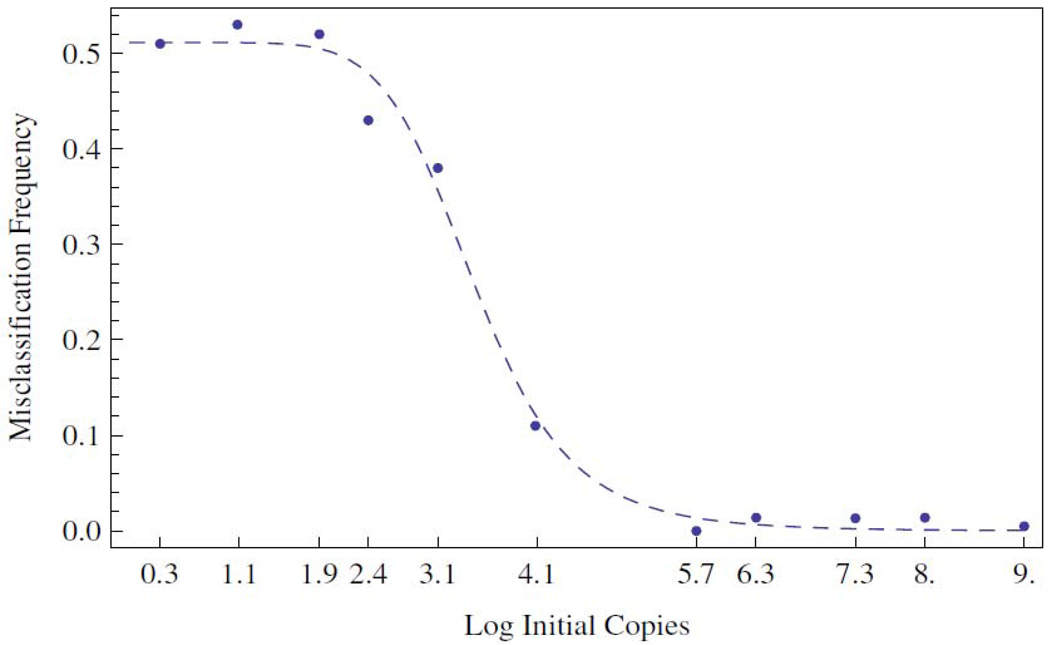
The graph of the relative error of the linear regression, shown in Figure 5 is an attempt to quantify the effect that the broadening of the Ct value distributions has on the inverse problem of assigning an initial template concentration from a measured Ct value. In an alternative attempt to summarize the impact of the variance of the Ct value distributions on the process of categorizing the initial template concentration based on a measured Ct value we considered statistics such as that summarized in the equation for P(x) described in section 2.4.
The construction of a standard curve, as described in the previous section, is one way to assign a template concentration to a measured Ct value. Now consider another. Consider each distribution of Ct values as representing a class. The class label is the initial template concentration. The heuristic is this: Given a measured Ct value coming from one of these classes, how likely is it to misassociate this value with the wrong class label? The larger the overlap between the meat of the distributions, the more likely it is that an unknown value will be misclassified. The formula for P(x) given quantifies this notion. The results, conditioned on our data set, are shown in Figure 6.
Figure 6.
Misclassification frequency calculated according to the definition of P(x) given in section 2.4 and conditioned upon the Ct value distributions shown in Figure 1. A best fit Hill's function is shown as the dashed line. The midpoint of the transition occurs at approximately 2950 copies of initial template DNA.
The analysis indicates, as is clearly correlated with the results shown in Figure 1, that above 10 5 copies the probability of misclassification are small, less than 0.1. Over a narrow range spanning the next two decades of concentration the probability rises to one half. Subsequently, at lower concentrations, the probability more or less saturates at the value of one half and equates classification to coin flipping. The two sided nature of the flip is interpreted as the chance of being in the right class or out, in a one versus all sense. From a best-fit Hill’s function, shown as the dotted curve, it is deduced that the midpoint of the misclassification transition occurs at 10 3.47 ≈ 2950 initial copies of template DNA. As can be seen in Figure 2, the ordered pair (3.47,25) lies close to the regression line and well within the error stripe, indicating the concordance between the relative error, misclassification and pre-wear data.
3.4 Rank Ordering with Replicates
In the first section we summarized the findings that the sample mean and median Ct values computed from all the data are statistically distinguishable and rank ordered. This was the case using all 184 replicates per initial template concentration. Doubtless it is of interest to understand how few data are required to make this same claim.
In this section we imagine the following experiment. Suppose that an investigator has produced a serial dilution in a set of tubes, with no error other than that coming from a correctly calibrated pipetteman. However, the tubes containing the dilution series are unlabeled and become scrambled as to order, but not contents. It is unequivocal that the amount of DNA within the tubes form a monotone series. The question is to determine how many replicate PCR runs are required such that the resultant sample mean Ct values correctly order, and hence label, the tubes with a given level of confidence? We imagine that rank ordering is one level of quantitation removed from inversion, but a closely related pre-requisite.
Conditioned on our data we can answer this question by Monte-Carlo simulation. From each Ct value distribution we draw k replicates uniformly at random and compute their sample mean . This mimics an experiment with k-replicates. The resulting set are sorted according to their numerical values and if this order agrees with that of their class labels, x, we score this trial positive. We compute the fraction of positive draws, that resulted in correctly ordered sample means, from a total of 20,000 draws at each value of k. The results are shown in Figures 7 and 8.
Figure 7.
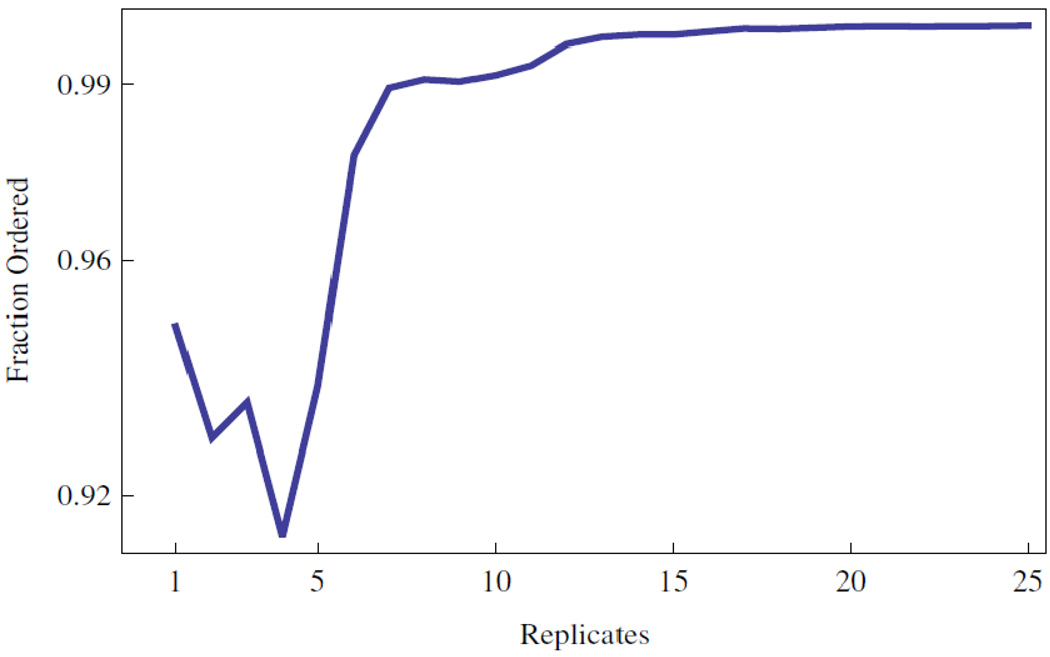
Reliability of replicates given the task of rank ordering a dilution series. The results for rank ordering the initial template concentrations with x ≥ 104.
Figure 8.
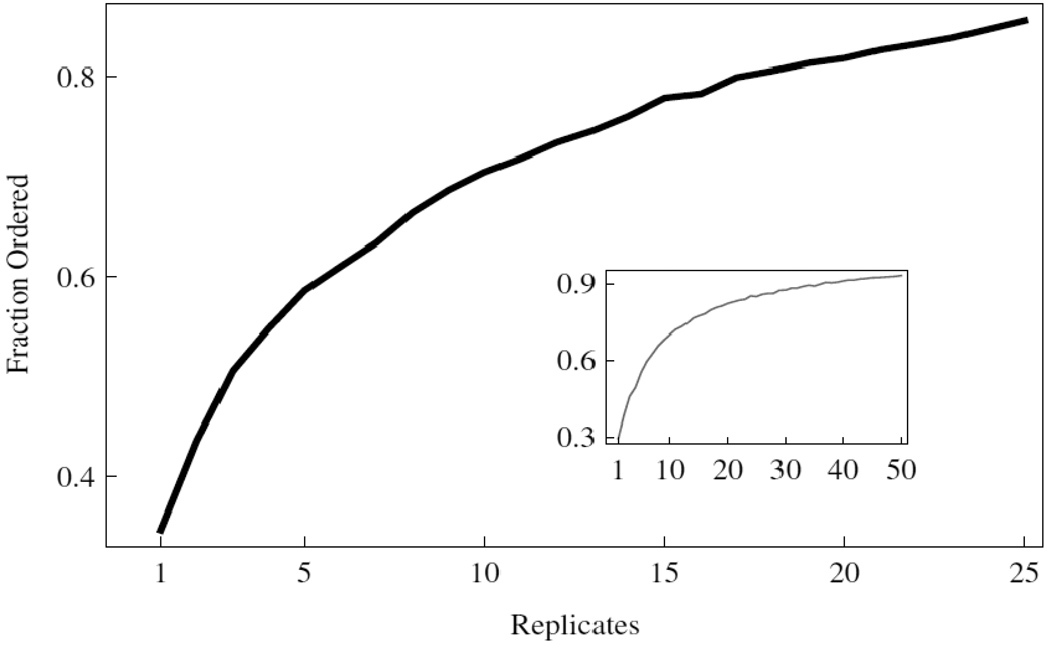
Reliability of replicates given the task of rank ordering a dilution series. The results for rank ordering the initial template distributions with x < 104. Inset shows the results over the entire range of initial template DNA, see Table 1.
Figure 7 shows that individual data points can rank order the highest concentrations from 10 4 to 10 9 initial copies with greater than 90% accuracy conditioned on our data. The use of 8 or more replicates guarantees 99% accuracy. The inset to Figure 8 shows the performance when all the data are considered together. These data indicate that 35 or more replicates are required to exceed 90% accuracy over the entire concentration range. Figure 8 shows that the larger variance of the distributions with smaller initial template are responsible for the behavior of the sample over the entire range.
3.5 End Point Detection
In the previous sections we have detailed an analysis of variance that shows that below 10 4 and certainly below 100 initial copies of template DNA, quantitation via standard curves or classification via a Ct value is confounded by error. As an alternative we describe a format for single molecule detection utilizing an endpoint analysis. We have separated the analysis into two parts. In the first part we consider the process of plate filling. We show that theory and experiment are in good agreement. In the second part we show that the process of amplification by PCR simply reveals the pattern of plate filling.
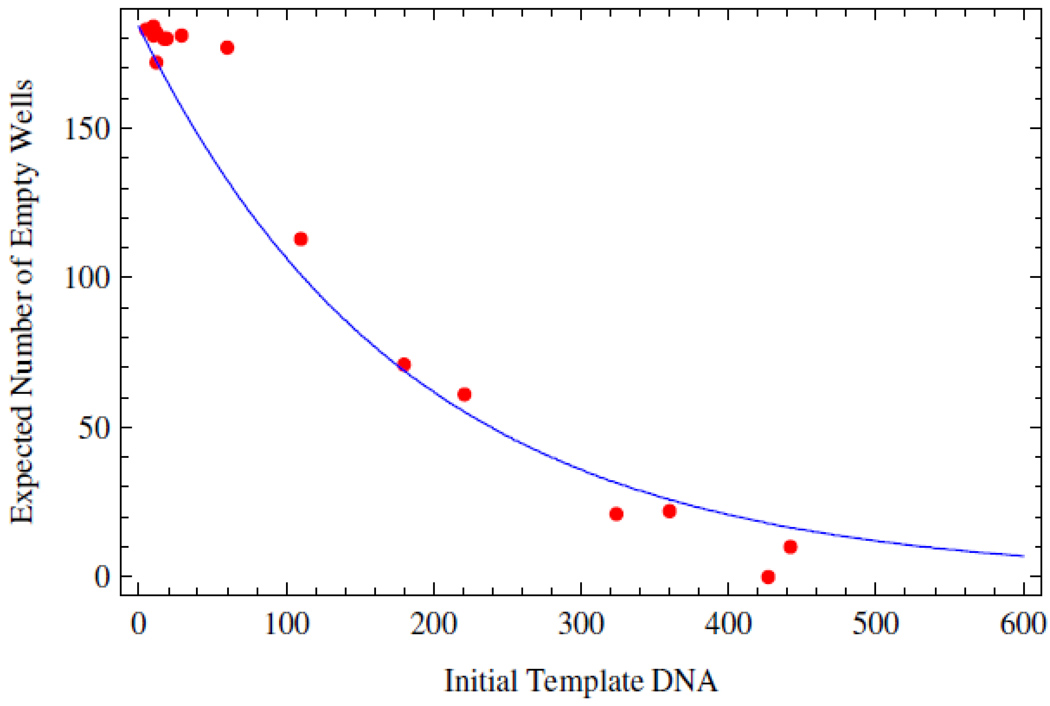
Suppose, as before, that we pipette identical, well mixed, aliquots of a DNA solution into the wells of a multiwell plate and perform 40 cycles of PCR and count the total number of wells that amplified above the detection limitation of the machine. Our data demonstrate that the expected number of unamplified wells is an informative statistic that has the property that its error declines as the total number of molecules of DNA declines [23].
Figure 9 shows the excellent congruence between theory and experiment for filling of 96-well plates with solutions of 20 micron latex beads as described in the methods. Utilizing PCR to discriminate wells filled with DNA from those that are not, is more complex than optical bead counting. Figure 10 describes the results of an endpoint analysis. Each data point represents an independent experiment. The concentrations of DNA plated for PCR were determined through dilution as described in methods. When these putative DNA concentrations are uniformly scaled by a factor of 2.4 the data agree remarkably well with the theory over the entire length of the plate filling curve.
Figure 10.
The number of unamplified wells as a function of the number of DNA molecules spread over a 384 well plate. The expected number of empty wells calculated from theory in blue. The red dots represent experimental PCR endpoint data.
4 Conclusions
With a sensitive PCR plate reader we have examined the variability of real time PCR process. We have shown that using less than a few hundred replicates per initial template concentration ensures that the mean Ct values are statistically distinguishable and rank ordered corresponding with the initial amount of template DNA. We have shown that the mean/median values can be regressed over ten orders of magnitude.
The Ct value distributions appear noisy below 10 4 copies of initial template DNA and the results of two independent statistical techniques confirm this observation. Independent data on TAQ-wear indicate that the enzyme experiences a transition of decreasing efficiency in the corresponding region.
Given a standard curve, the Ct value distributions were used to quantify the impact of the variability of the Ct values on the process of predicting the initial template concentration. The relative error varies from 7% to 50% over the highest initial template concentrations averaging near 20%. Both the relative error and the misclassification analysis capture the transition from low variance to high: The misclassification frequency is smoother and perhaps more intuitive to interpret while the relative error analysis perhaps more quantitative. The misclassification analysis suggests an alternative classification approach to solving the inverse problem. Instead of using a standard curve to convert a Ct value into an initial template concentration we consider probabilistic classification into one of a discrete number of template classes. We are currently exploring this idea.
A question central to the analysis of the Ct value distribution data concerns the role of replicates. The value of replicates stems from the statistical fact that the variance of the distribution of sample means is smaller than the variance of the data distributions. What lessons can the data distributions teach about how many replicates are required in practice for resolution and reproducibility? Rank ordering of the sample means is a convenient and meaningful device for exploring this question. Rank ordering simulations with our data suggest that the number of replicates required depends on the range of initial template. Below the transition region individual data points provide better than 90% rank accuracy, while 35 or more replicates are suggested below the transition region for the same degree of rank accuracy. But this is a disheartening result for the following reason: More replicates are required precisely where the sample may be scarce. For samples with small initial template concentrations it may be more accurate to consider an endpoint method using the expected number of (un)amplified wells than to consider replicates.
These data, and the work of other groups [24] have demonstrated that the use of the Ct method in conjunction with statistical replicates renders the process of real time PCR capable of quantitative analysis for initial DNA samples ranging from upwards of 10 4 molecules. However the data presented above show that for tens to hundreds of initial copies real time PCR is unreliable for quantitation. We and other groups have been exploring alternative methods for single molecule detection and counting. In this regard, a process involving endpoint analysis shows significant promise.
We have described a decomposition of single molecule counting into plate filling and amplification. We have demonstrated through simulation and experiment that the expected number of (un)amplified wells is a robust statistic on which to base an inverse problem or a rigorous hypothesis test to count small numbers of single molecules. The observed linear scaling between expected and perceived DNA concentration indicates that amplification by PCR is directly related to plate filling.
It remains an open problem to determine the conditional probability with which PCR can amplify above threshold in 40 cycles from a single strand of DNA. While it is currently impossible to enumerate individual molecules or particles smaller than a nanometer, it is straightforward to count macroscopic objects such as latex beads or single yeast cells with a Coulter counter. Haploid yeast cells provide a convenient and verifiable means to deliver single copies of Bacillus subtilis genes such as ybdO into the wells of a multi-well PCR plate.
In this way, we are currently exploring the relationship between amplification and DNA copy number.
Figure 3.
TAQ efficiency as a function of thermo-cycling pre-wear. An efficiency is computed as the average derivative of relative fluorescence over the amplification curves. Error bars represent a standard deviation over three independent experiments.
Acknowledgments
This work was partially supported through NSF-DMS 0443855, NSF ECS 0601528, NIH EB009235, and the short-lived W.M. Keck Foundation Grant#062014.
Contributor Information
Chris C. Stowers, Bioprocess Division, Dow AgroSciences LLC, Indianapolis, IN 46268.
Frederick R. Haselton, Department of Biomedical Engineering, Vanderbilt University, Nashville, TN. 37232
Erik M. Boczko, Department of Biomedical Informatics, Vanderbilt University Medical Center, Nashville, TN. 37232
References
- 1.Freeman W, Walker S, Vrana K. Quantitative rt-PCR: pitfalls and potential. Biotechniques. 1999;26:112–125. doi: 10.2144/99261rv01. [DOI] [PubMed] [Google Scholar]
- 2.Larionov A, Krause A, Miller W. A standard curve based method for relative real time PCR data processing. BMC Bioinformatics. 2005;6:62. doi: 10.1186/1471-2105-6-62. [DOI] [PMC free article] [PubMed] [Google Scholar]
- 3.Yuan J, Reed A, Chen F, Stewart C. Statistical analysis of real-time PCR data. BMC Bioinformatics. 2006;7:85. doi: 10.1186/1471-2105-7-85. [DOI] [PMC free article] [PubMed] [Google Scholar]
- 4.Abramov D, Trofimov D, Rebrikov D. Accuracy of a real-time polymerase chain-reaction assay for quantitative estimation of genetically modified food sources in food products. Applied Biochemistry and Microbiology. 2006;42:485–488. [PubMed] [Google Scholar]
- 5.Diehl F, Li M, Dressman D, Yiping H, Shen D, Szabo S, Diaz L, Goodman S, David K, Juhl H, Kinzler K, Vogelstein B. Detection and quantification of mutations in the plasma of patients with colorectal tumors. PNAS. 2005;102:16368–16373. doi: 10.1073/pnas.0507904102. [DOI] [PMC free article] [PubMed] [Google Scholar]
- 6.Roussel Y, Harris A, Lee M, Wilks M. Novel methods of quantitative real-time PCR data analysis in murine HelicobaCter pylori vaccine model. Vaccine. 2007;25:2919–2929. doi: 10.1016/j.vaccine.2006.07.013. [DOI] [PubMed] [Google Scholar]
- 7.Jagers P, Klebaner K. Random variation and concentration effects in PCR. Journal of Theoretical Biology. 2003;224:299–304. doi: 10.1016/s0022-5193(03)00166-8. [DOI] [PubMed] [Google Scholar]
- 8.Lalam N, Jacob C, Jagers P. Modeling the PCR amplification process by a size-dependent branching process and estimation of the efficiency. Advanced Applied Probability. 2004;36:602–615. [Google Scholar]
- 9.Liu W, Saint D. A new quantitative method of real time reverse transcription polymerase chain reaction assay based on simulation of polymerase chain reaction kinetics. Analytical Biochemistry. 2002;302:52–59. doi: 10.1006/abio.2001.5530. [DOI] [PubMed] [Google Scholar]
- 10.Nedelman J, Haegerty P, Lawrence C. Quantitative PCR: procedures and precision. Bulletin of Mathematical Biology. 1992;54:477–502. [Google Scholar]
- 11.Vaerman J, Saussoy P, Inargiola I. Evaluation of real-time PCR data. Journal of Biological Regulators and Homeostatic Agents. 2004;18:212–214. [PubMed] [Google Scholar]
- 12.Pfaffl M. A new mathematical model for relative quantification in real-time PCR. Nucleic Acid Research. 2001;29:e00. doi: 10.1093/nar/29.9.e45. [DOI] [PMC free article] [PubMed] [Google Scholar]
- 13.DeGroot MH. Probability and Statistics. (2nd Edition) 1986 Addison Wesley Reading MA. [Google Scholar]
- 14.Cady N, Stelick S, Kunnavakkam M, Lui Y, Batt C. A microchip-based DNA purification and real-time PCR biosensor for bacterial detection. Proceedings of IEEE Sensors. 2004:1191–1194. [Google Scholar]
- 15.Matsubara Y, Kerman K, Kobayashi M, Yamamura S, Morita Y, Tamiya E. Microchamber assay based DNA quantification and specific sequence detection from a single copy via PCR in nanoliter volumes. Journal of Biosensors and Electronics. 2004;20:1482–1490. doi: 10.1016/j.bios.2004.07.002. [DOI] [PubMed] [Google Scholar]
- 16.Mitra R, Church G. In situ localized amplification and contact replication of many individual DNA molecules. Nucleic Acids Research. 1999;27:e34. doi: 10.1093/nar/27.24.e34. [DOI] [PMC free article] [PubMed] [Google Scholar]
- 17.Samatov T, Chetverina H, Chetverin A. Real-time monitoring of DNA colonies growing in a polyacrylamide gel. Analytical Biochemistry. 2006;356:300–302. doi: 10.1016/j.ab.2006.04.037. [DOI] [PubMed] [Google Scholar]
- 18.Williams R, Peisajovish S, Miller O, Magdassi S, Tawfik D, Griffiths A. Amplification of complex gene libraries by emulsion PCR. Nature Methods. 2006;3:545–550. doi: 10.1038/nmeth896. [DOI] [PubMed] [Google Scholar]
- 19.Karsai A, Muller S, Platz S, Hauser T. Evaluation of a home-made SYBR Green 1 reaction mixture for real-time PCR quantification of gene expression. Biotechniques-Short Technical Reports. 2002;32:790–796. doi: 10.2144/02324st05. [DOI] [PMC free article] [PubMed] [Google Scholar]
- 20.Neubert K, Brunner E. A studentized permutation test for the nonparametric Behrens-Fisher problem. Comp. Stat. Data Anal. 2007;51:5192–5204. [Google Scholar]
- 21.Reiczigel J, Zakarias I, Rozsa L. A bootstrap test of stochastic equality of two populations. Amer. Stat. 2005;59:156–161. [Google Scholar]
- 22.Wilcox RR. Comparing Medians. Comp. Stat. Data Anal. 2006;51:1934–1943. [Google Scholar]
- 23.Stowers C, Boczko EM. Platescale: The birthday problem applied to single molecule PCR. Biocomp08. 2008 http://www.ucmss.com/cr/main/papersNew/papersAll/BIC9135.pdf. [Google Scholar]
- 24.Cook P, Fu C, Hickey M, Han E, Miller K. SAS programs for real-time RT-PCR having multiple independent samples. Biotechniques. 2004;37:990–995. doi: 10.2144/04376BIN02. [DOI] [PubMed] [Google Scholar]


